. 2016 Dec 13;316(22):2385-2401.
doi: 10.1001/jama.2016.13645.

US County-Level Trends in Mortality Rates for Major Causes of Death, 1980-2014

Affiliations

US County-Level Trends in Mortality Rates for Major Causes of Death, 1980-2014

Laura Dwyer-Lindgren et al. JAMA. .

Abstract

Importance: County-level patterns in mortality rates by cause have not been systematically described but are potentially useful for public health officials, clinicians, and researchers seeking to improve health and reduce geographic disparities.

Objectives: To demonstrate the use of a novel method for county-level estimation and to estimate annual mortality rates by US county for 21 mutually exclusive causes of death from 1980 through 2014.

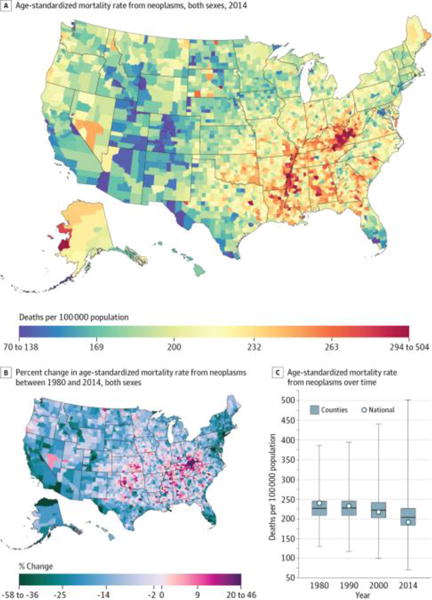
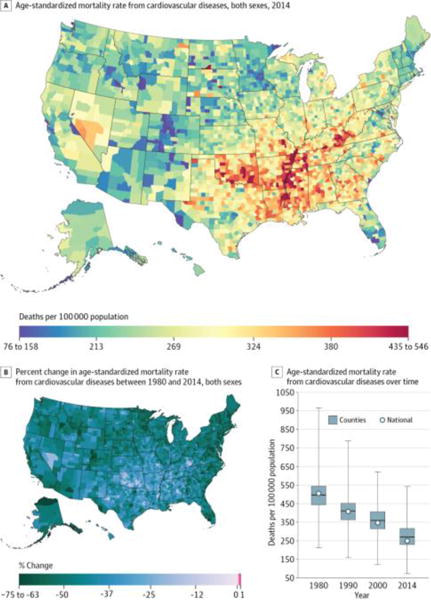
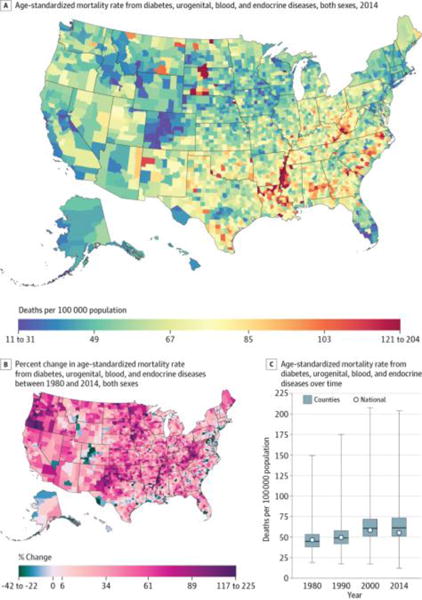
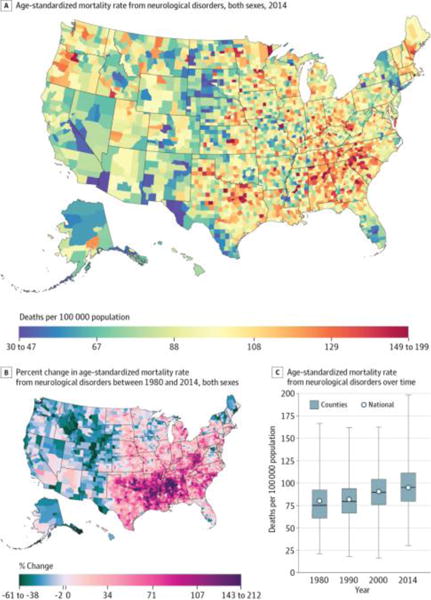
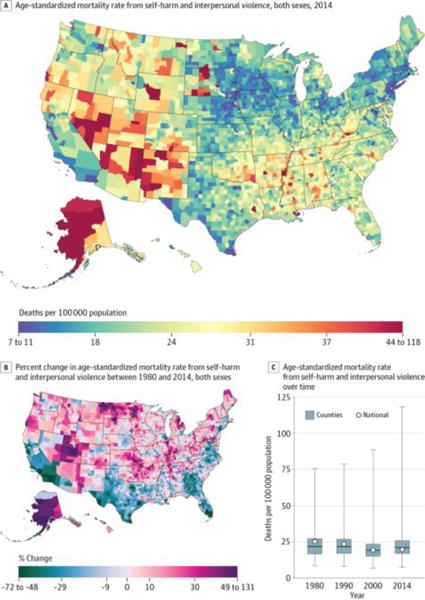
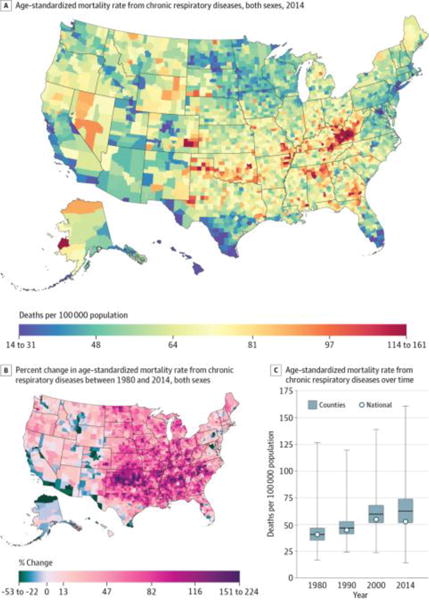
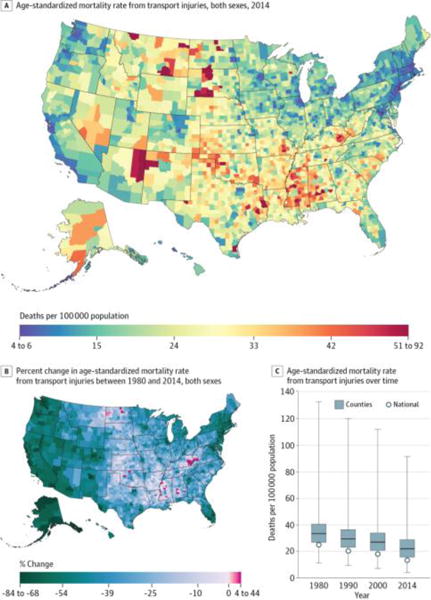
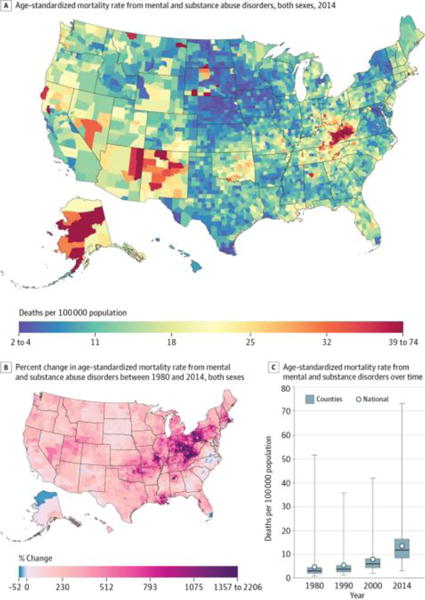
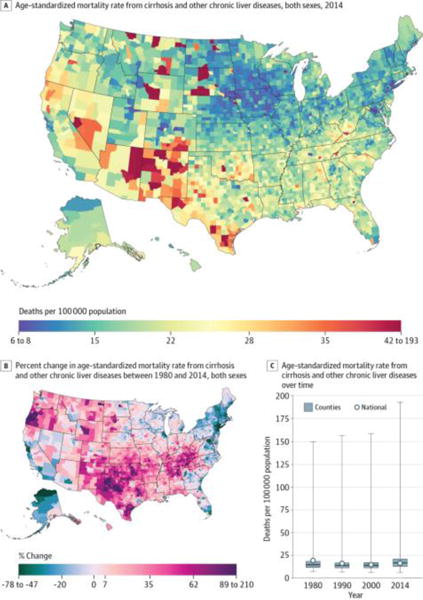
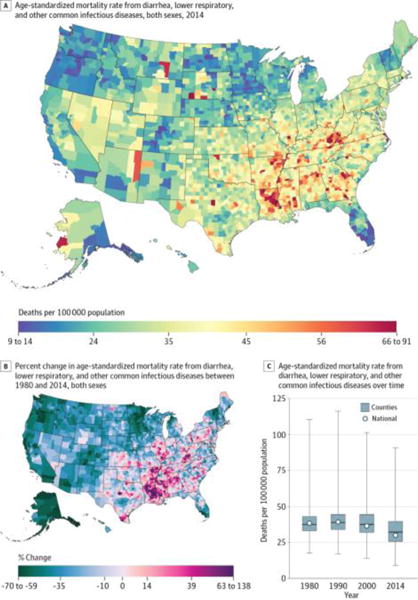
Design, setting, and participants: Redistribution methods for garbage codes (implausible or insufficiently specific cause of death codes) and small area estimation methods (statistical methods for estimating rates in small subpopulations) were applied to death registration data from the National Vital Statistics System to estimate annual county-level mortality rates for 21 causes of death. These estimates were raked (scaled along multiple dimensions) to ensure consistency between causes and with existing national-level estimates. Geographic patterns in the age-standardized mortality rates in 2014 and in the change in the age-standardized mortality rates between 1980 and 2014 for the 10 highest-burden causes were determined.

Exposure: County of residence.

Main outcomes and measures: Cause-specific age-standardized mortality rates.

Results: A total of 80 412 524 deaths were recorded from January 1, 1980, through December 31, 2014, in the United States. Of these, 19.4 million deaths were assigned garbage codes. Mortality rates were analyzed for 3110 counties or groups of counties. Large between-county disparities were evident for every cause, with the gap in age-standardized mortality rates between counties in the 90th and 10th percentiles varying from 14.0 deaths per 100 000 population (cirrhosis and chronic liver diseases) to 147.0 deaths per 100 000 population (cardiovascular diseases). Geographic regions with elevated mortality rates differed among causes: for example, cardiovascular disease mortality tended to be highest along the southern half of the Mississippi River, while mortality rates from self-harm and interpersonal violence were elevated in southwestern counties, and mortality rates from chronic respiratory disease were highest in counties in eastern Kentucky and western West Virginia. Counties also varied widely in terms of the change in cause-specific mortality rates between 1980 and 2014. For most causes (eg, neoplasms, neurological disorders, and self-harm and interpersonal violence), both increases and decreases in county-level mortality rates were observed.

Conclusions and relevance: In this analysis of US cause-specific county-level mortality rates from 1980 through 2014, there were large between-county differences for every cause of death, although geographic patterns varied substantially by cause of death. The approach to county-level analyses with small area models used in this study has the potential to provide novel insights into US disease-specific mortality time trends and their differences across geographic regions.


Conflict of interest statement

Conflict of Interest Disclosures: All authors have completed and submitted the ICMJE Form for Disclosure of Potential Conflicts of Interest and none were reported.

Figures

Figure 1
Figure 1. County-Level Mortality From Neoplasms
A, Age-standardized mortality rate for both sexes combined in 2014. B, Percent change in the age-standardized mortality rate for both sexes combined between 1980 and 2014. A and B, The color scale is truncated at approximately the first and 99th percentiles as indicated by the range given in the color scale. C, Age-standardized mortality rate in 1980, 1990, 2000, and 2014. The bottom border, middle line, and top border of the boxes indicate the 25th, 50th, and 75th percentiles, respectively, across all counties; whiskers, the full range across counties; and circles, the national-level rate.
Figure 2
Figure 2. County-Level Mortality From Cardiovascular Diseases
A, Age-standardized mortality rate for both sexes combined in 2014. The color scale is truncated at approximately the first and 99th percentiles as indicated by the range given in the color scale. B, Percent change in the age-standardized mortality rate for both sexes combined between 1980 and 2014. The color scale is truncated at the first percentile but not at the 99th percentile, to avoid combining counties with decreases in the mortality rate and counties with increases in the mortality rate into a single group. C, Age-standardized mortality rate in 1980, 1990, 2000, and 2014. The bottom border, middle line, and top border of the boxes indicate the 25th, 50th, and 75th percentiles, respectively, across all counties; whiskers, the full range across counties; and circles, the national-level rate.
Figure 3
Figure 3. County-Level Mortality From Diabetes, Urogenital, Blood, and Endocrine Diseases
A, Age-standardized mortality rate for both sexes combined in 2014. B, Percent change in the age-standardized mortality rate for both sexes combined between 1980 and 2014. A and B, The color scale is truncated at approximately the first and 99th percentiles as indicated by the range given in the color scale. C, Age-standardized mortality rate in 1980, 1990, 2000, and 2014. The bottom border, middle line, and top border of the boxes indicate the 25th, 50th, and 75th percentiles, respectively, across all counties; whiskers, the full range across counties; and circles, the national-level rate.
Figure 4
Figure 4. County-Level Mortality From Neurological Disorders
A, Age-standardized mortality rate for both sexes combined in 2014. B, Percent change in the age-standardized mortality rate for both sexes combined between 1980 and 2014. A and B, The color scale is truncated at approximately the first and 99th percentiles as indicated by the range given in the color scale. C, Age-standardized mortality rate in 1980, 1990, 2000, and 2014. The bottom border, middle line, and top border of the boxes indicate the 25th, 50th, and 75th percentiles, respectively, across all counties; whiskers, the full range across counties; and circles, the national-level rate.
Figure 5
Figure 5. County-Level Mortality From Self-harm and Interpersonal Violence
A, Age-standardized mortality rate for both sexes combined in 2014. B, Percent change in the age-standardized mortality rate for both sexes combined between 1980 and 2014. A and B, The color scale is truncated at approximately the first and 99th percentiles as indicated by the range given in the color scale. C, Age-standardized mortality rate in 1980, 1990, 2000, and 2014. The bottom border, middle line, and top border of the boxes indicate the 25th, 50th, and 75th percentiles, respectively, across all counties; whiskers, the full range across counties; and circles, the national-level rate.
Figure 6
Figure 6. County-Level Mortality From Chronic Respiratory Diseases
A, Age-standardized mortality rate for both sexes combined in 2014. B, Percent change in the age-standardized mortality rate for both sexes combined between 1980 and 2014. A and B, The color scale is truncated at approximately the first and 99th percentiles as indicated by the range given in the color scale. C, Age-standardized mortality rate in 1980, 1990, 2000, and 2014. The bottom border, middle line, and top border of the boxes indicate the 25th, 50th, and 75th percentiles, respectively, across all counties; whiskers, the full range across counties; and circles, the national-level rate.
Figure 7
Figure 7. County-Level Mortality From Transport Injuries
A, Age-standardized mortality rate for both sexes combined in 2014. B, Percent change in the age-standardized mortality rate for both sexes combined between 1980 and 2014. A and B, The color scale is truncated at approximately the first and 99th percentiles as indicated by the range given in the color scale. C, Age-standardized mortality rate in 1980, 1990, 2000, and 2014. The bottom border, middle line, and top border of the boxes indicate the 25th, 50th, and 75th percentiles, respectively, across all counties; whiskers, the full range across counties; and circles, the national-level rate.
Figure 8
Figure 8. County-Level Mortality From Mental and Substance Use Disorders
A, Age-standardized mortality rate for both sexes combined in 2014. The color scale is truncated at approximately the first and 99th percentiles as indicated by the range given in the color scale. B, Percent change in the age-standardized mortality rate for both sexes combined between 1980 and 2014. The color scale is truncated at the 99th percentile but not at the first percentile, to avoid combining counties with decreases in the mortality rate and counties with increases in the mortality rate into a single group. C, Age-standardized mortality rate in 1980, 1990, 2000, and 2014. The bottom border, middle line, and top border of the boxes indicate the 25th, 50th, and 75th percentiles, respectively, across all counties; whiskers, the full range across counties; and circles, the national-level rate.
Figure 9
Figure 9. County-Level Mortality From Cirrhosis and Other Chronic Liver Diseases
A, Age-standardized mortality rate for both sexes combined in 2014. B, Percent change in the age-standardized mortality rate for both sexes combined between 1980 and 2014. A and B, The color scale is truncated at approximately the first and 99th percentiles as indicated by the range given in the color scale. C, Age-standardized mortality rate in 1980, 1990, 2000, and 2014. The bottom border, middle line, and top border of the boxes indicate the 25th, 50th, and 75th percentiles, respectively, across all counties; whiskers, the full range across counties; and circles, the national-level rate.
Figure 10
Figure 10. County-Level Mortality From Diarrhea, Lower Respiratory, and Other Common Infectious Diseases
A, Age-standardized mortality rate for both sexes combined in 2014. B, Percent change in the age-standardized mortality rate for both sexes combined between 1980 and 2014. A and B, The color scale is truncated at approximately the first and 99th percentiles as indicated by the range given in the color scale. C, Age-standardized mortality rate in 1980, 1990, 2000, and 2014. The bottom border, middle line, and top border of the boxes indicate the 25th, 50th, and 75th percentiles, respectively, across all counties; whiskers, the full range across counties; and circles, the national-level rate.

Comment in

References

    1. Wang H, Schumacher AE, Levitz CE, Mokdad AH, Murray CJ. Left behind: widening disparities for males and females in US county life expectancy, 1985–2010. Popul Health Metr. 2013;11(1):8. - PMC - PubMed
    1. Chetty R, Stepner M, Abraham S, et al. The association between income and life expectancy in the United States, 2001–2014. JAMA. 2016;315(16):1750–1766. - PMC - PubMed
    1. Chien LC, Yu HL, Schootman M. Efficient mapping and geographic disparities in breast cancer mortality at the county-level by race and age in the U.S. Spat Spatiotemporal Epidemiol. 2013;5:27–37. - PMC - PubMed
    1. Fabsitz R, Feinleib M. Geographic patterns in county mortality rates from cardiovascular diseases. Am J Epidemiol. 1980;111(3):315–328. - PubMed
    1. Casper M, Kramer MR, Quick H, Schieb LJ, Vaughan AS, Greer S. Changes in the geographic patterns of heart disease mortality in the United States: 1973 to 2010. Circulation. 2016;133(12):1171–1180. - PMC - PubMed

Publication types