. 2017 Feb;108(2):226-235.
doi: 10.1111/cas.13132.

Intravital Förster resonance energy transfer imaging reveals osteopontin-mediated polymorphonuclear leukocyte activation by tumor cell emboli

Affiliations

Intravital Förster resonance energy transfer imaging reveals osteopontin-mediated polymorphonuclear leukocyte activation by tumor cell emboli

Yuji Kamioka et al. Cancer Sci. 2017 Feb.

Abstract

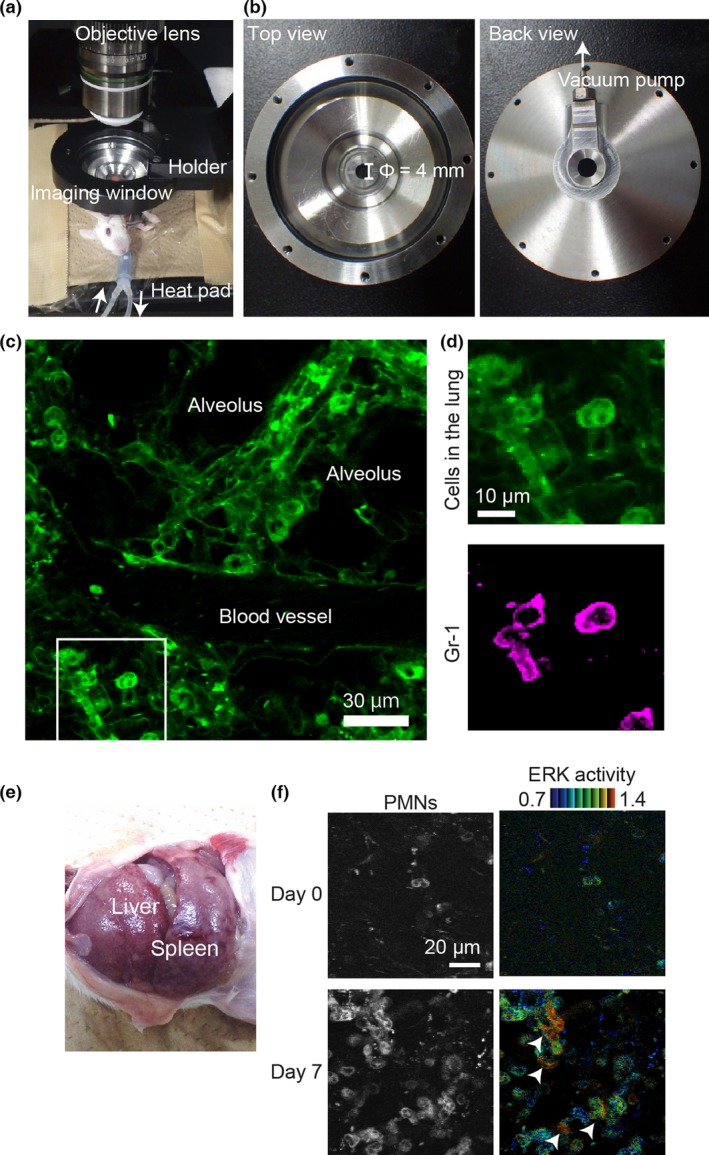
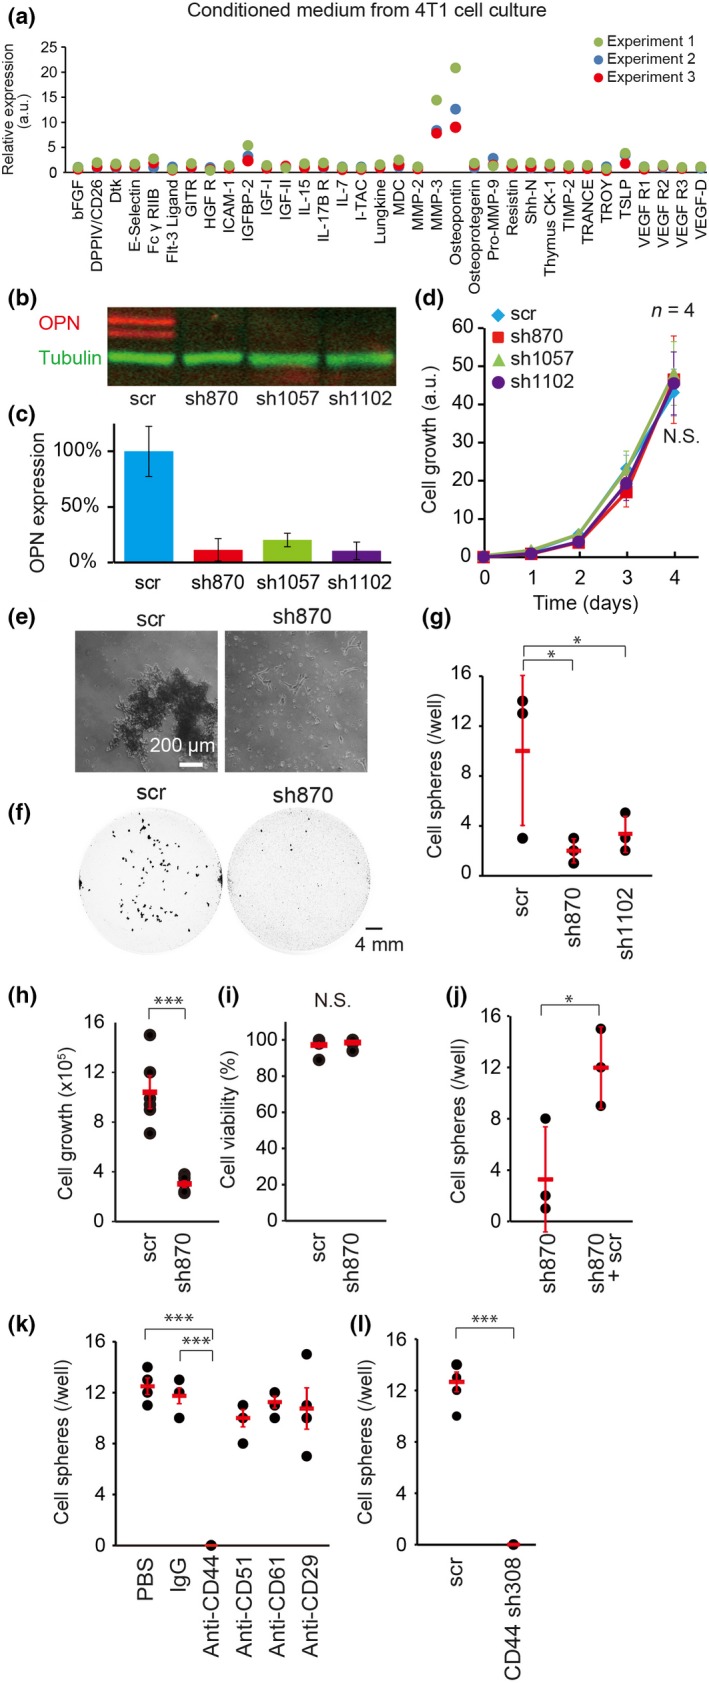
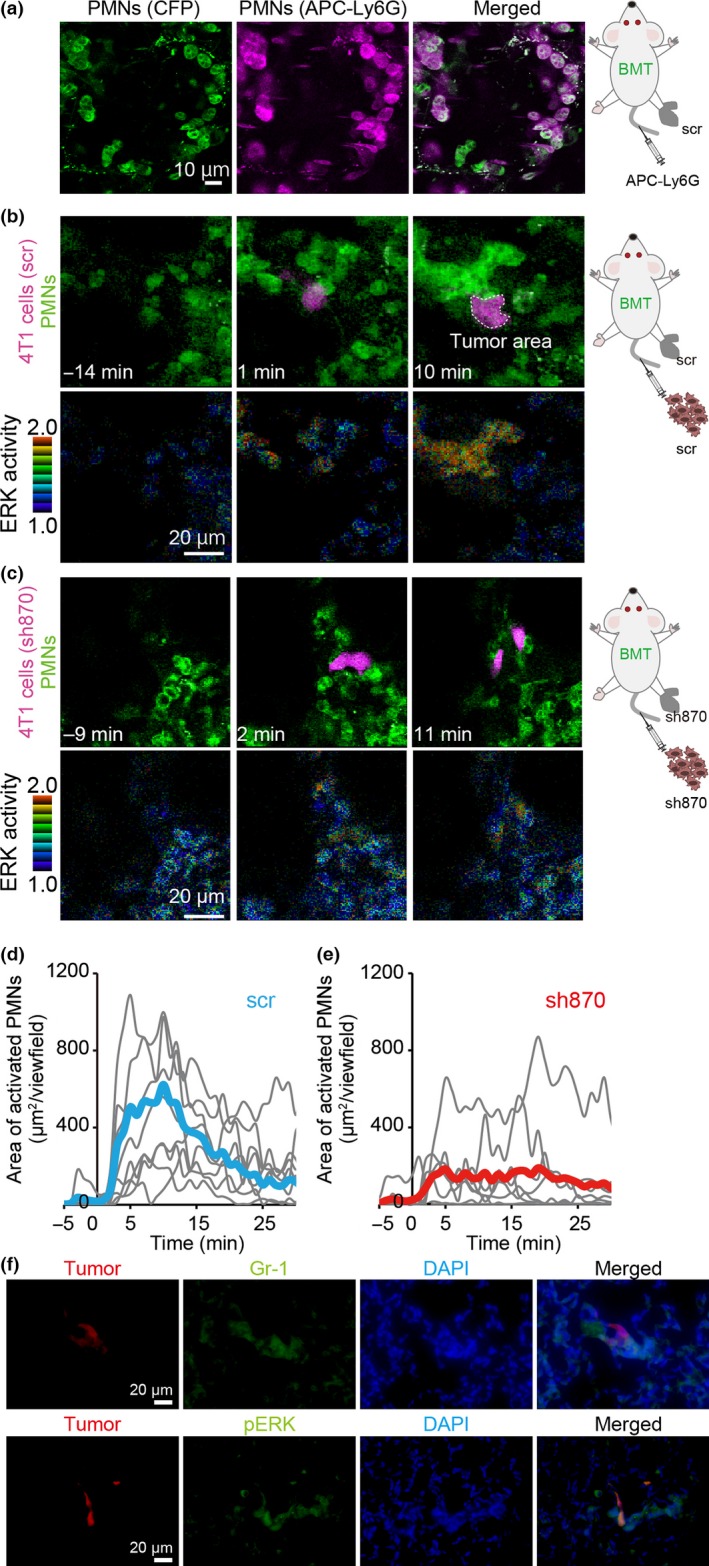
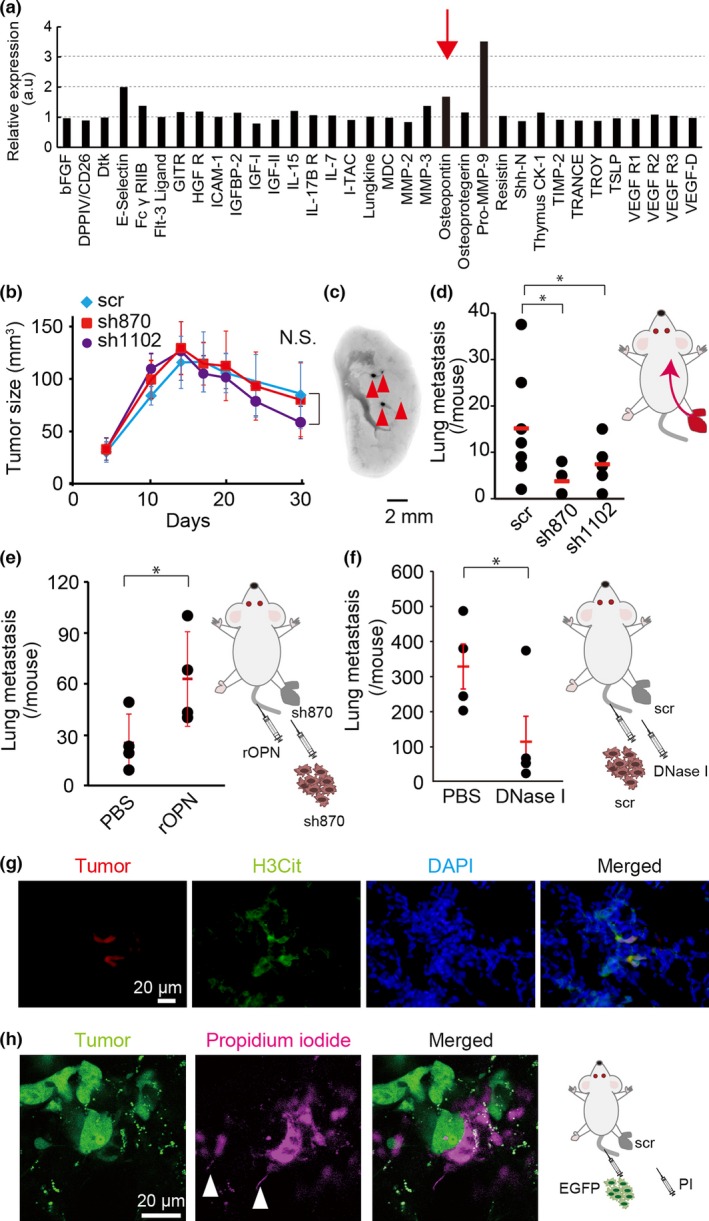
Myeloid-derived suppressor cells (MDSCs) cause paraneoplastic leukemoid reactions and facilitate tumor cell metastasis. However, the interaction of MDSCs with tumor cells in live tissue has not been adequately visualized. To accomplish this task, we developed an intravital imaging protocol to observe metastasized tumor cells in mouse lungs. For visualization of the activation of MDSCs, bone marrow cells derived from transgenic mice expressing a Förster resonance energy transfer biosensor for ERK were implanted into host mice. Under a two-photon excitation microscope, numerous polymorphonuclear cells (PMNs) were found to infiltrate the lungs of tumor-bearing mice in which 4T1 mammary tumor cells were implanted into the footpads. By Förster resonance energy transfer imaging, we found ERK activation in PMNs around the 4T1 tumor emboli in the lungs. Because antibody array analysis implied the involvement of osteopontin (OPN) in the metastasis of 4T1 cells, we further analyzed the effect of OPN knockdown. The OPN knockdown in 4T1 cells did not affect the cell growth, but markedly suppressed lung metastasis of 4T1 cells and ERK activation in PMNs in the lung. Intravenous injection of recombinant OPN restored the lung metastasis of OPN-deficient 4T1 cells, suggesting that OPN functioned in a paracrine manner. It has been reported that ERK activation of neutrophils causes NETosis and that PMNs promote metastasis of tumor cells by NETosis. In agreement with previous reports, the NETosis inhibitor DNase I inhibited lung metastasis of 4T1 cells. These observations suggest that OPN promotes metastasis of 4T1 cells by activating PMNs and inducing NETosis.

Keywords: Cancer imaging; immune system imaging; immunosurveillance; tumor immunology; two-photon excitation microscopy.


Figures

Figure 1
Figure 1
Intravital Förster resonance energy transfer (FRET) imaging of lung metastasis in mouse by two‐photon excitation microscopy. (a) Layout of the intravital imaging system for the mouse lung. An anesthetized FRET mouse for ERK was placed on an electric heating pad and set under a custom‐made, vacuum‐stabilized imaging window to minimize the motion artifacts caused by breathing. (b) The top and back view of the vacuum‐stabilized imaging window. The diameter of the window area is 4 mm. (c) Cyan fluorescent protein fluorescence image of the lung of a FRET mouse, into which 6 μg phycoerythrin (PE)‐labeled anti‐Gr‐1 antibody was injected i.v. (d) Magnified images of the boxed region in (c). The PE image of the same region is also shown. Note that the polymorphonuclear cells (PMNs) are stained with PE‐labeled anti‐Gr‐1 antibody. (e) Image of hepatosplenomegaly 3 weeks after tumor inoculation at the footpad. (f) Bone marrow cells of a FRET mouse for ERK were transferred to a recipient BALB/c mouse. One month after bone marrow transplantation, 4T1 cells were inoculated at the footpad. The lung was observed on the day of tumor cell inoculation (day 0) and day 7. Yellow fluorescent protein images (left) and FRET/cyan fluorescent protein images for ERK activity (right) are shown. Of note, ERK activation is observed in some PMNs (arrowheads).
Figure 2
Figure 2
Requirement of osteopontin (OPN) for sphere formation in vitro. (a) Conditioned medium of 4T1 cells was subjected to analysis with a Mouse Cytokine Array 4 Kit (n = 3). (b, c) 4T1 cells expressing an shRNA against OPN (sh870, sh1057, or sh1102) or a scramble negative control shRNA (scr) were analyzed by SDSPAGE and immunoblotted with anti‐OPN (red) and anti‐β‐tubulin (green) antibodies. β‐Tubulin was used for normalization in (c). Bars = SD (n = 3). (d) 4T1 cell lines expressing shRNAs were subjected to cell growth assay in vitro. Bars = SD (n = 4). Statistical significance was not detected by one‐way anova (N.S.). (e) Near‐infrared fluorescent protein (iRFP)‐labeled 4T1 cells expressing scr or sh870 were cultured in suspension. Phase contrast images are shown. Bar = 200 μm. (f) iRFP images of 4T1 cell spheres grown in suspension. Bar = 4 mm. (g–i) 4T1 cells with shRNAs were cultured for 24 h in suspension (5 × 105/well). Spheres larger than 0.1 mm2 were counted (g). Bars = SD (n = 3). Cells were harvested, dissociated, stained with Trypan blue, and analyzed with an automated cell counter (h, i). Bars = SD (n = 6). (j) In the first well, iRFP‐labeled sh870‐expressing 4T1 cells (5 × 105/well) were cultured. In the second well, iRFP‐labeled sh870‐expressing 4T1 cells (2.5 × 105/well) and non‐labeled scr‐expressing 4T1 cells (2.5 × 105/well) were cocultured. After 24 h, the number of cell spheres with iRFP was counted. Bars = SD (n = 3). (k) 4T1 cells were cultured in the presence of the indicated antibodies at a concentration of 2 μg/mL. Bars = SD (n = 4). (l) 4T1 cells expressing scr or an shRNA against CD44 (sh308) were cultured in suspension for 24 h. Bars = SD (n = 4). (g–l) Statistical significance was determined by Student's t‐test. *P < 0.05; ***P < 0.001.
Figure 3
Figure 3
Osteopontin (OPN)‐dependence of polymorphonuclear cell (PMN) activation in lungs of tumor‐bearing mice. Bone marrow cells of a Förster resonance energy transfer (FRET) mouse for ERK were transplanted to host BALB/c mice. After 1 month, the mice received 4T1 cells expressing scramble shRNA (scr) or shRNA against OPN (sh870) at the footpad. Two weeks after inoculation of 4T1 cells, mice were observed with a two‐photon excitation microscope. (a) To the mouse bearing scr‐expressing 4T1 cells, 6 μg allophycocyanin (APC)‐labeled anti‐Ly6G antibody was injected into the tail vein. Lungs were observed in vivo under a two‐photon excitation microscope. (b, c) In the process of imaging, the mice were injected i.v. with 4T1 cells expressing either scr (b) or sh870 (c). Upper panels show PMNs (cyan fluorescent protein [CFP], shown in green) and tumor cells (tdTomato, shown in magenta). Lower panels show ERK activity (FRET/CFP ratio image), with the range of activity indicated on the left. (d, e) In each time‐lapse image, the activated PMN area showing high ERK activity, that is FRET/CFP ratio ≥1.3, was measured and plotted against time (= 8). Blue and red lines show the mean value of scr‐ and sh870‐expressing 4T1 cells, respectively. (f) 4T1 cells expressing scr were inoculated at the footpad (1 × 106/mouse). Two weeks later, 4T1 cells expressing scr and tdTomato were injected i.v. into the tumor‐bearing mouse (1 × 105/mouse). Five minutes after injection, lungs were fixed with 4% paraformaldehyde in PBS. Frozen sections were stained with anti‐phospho‐ERK (pERK) and anti‐Gr‐1 antibodies. Bar = 20 μm. BMT, bone marrow‐transplanted.
Figure 4
Figure 4
Requirement of osteopontin (OPN) for metastasis in vivo. (a) Blood plasma samples prepared from a 4T1 tumor‐bearing mouse and a control mouse were subjected to analysis with a Mouse Cytokine Array 4 Kit. The ratio of protein expression in the 4T1 tumor‐bearing mouse to that in the control mouse is shown. (b) 4T1 cells expressing an shRNA against OPN (sh870 or sh1102) or scramble shRNA (scr) were inoculated into the footpads of BALB/c mice. The tumor size was measured at the indicated time. Bars = SD (n = 4). Statistical significance was not detected by one‐way anova (N.S.). (c) Representative image of the metastatic foci of near‐infrared fluorescent protein (iRFP)‐labeled scr‐expressing 4T1 cells. Arrowheads indicate metastatic foci. (d) Numbers of metastatic foci of 4T1 cells expressing an shRNA (scr, sh870, or sh1102) were counted. Bars = SD (n = 7). Statistical significance was not detected by Student's t‐test. (e) Sh870‐expressing 4T1 cells were injected into the footpads of BALB/c mice. Two weeks later, recombinant OPN protein (rOPN; 8.4 μg/mouse) was injected i.v. into tumor‐bearing mice for 5 days prior to injection of iRFP‐labeled sh870‐expressing 4T1 cells. The numbers of metastatic foci were counted. Bars = SD (n = 4). Statistical significance was not detected by Student's t‐test. (f) The scr‐expressing 4T1 cells were injected into the footpads of BALB/c mice. Two weeks later, iRFP‐labeled scr‐expressing 4T1 cells were injected i.v. One hour later, DNase I (2000 U/mouse) was also injected i.v. into tumor‐bearing mice. Three days later, the numbers of metastatic foci were counted. Bars = SD (n = 4). Statistical significance was not detected by Student's t‐test. (g) 4T1 cells expressing scr were inoculated at the footpad (1 × 106/mouse). Two weeks after the inoculation, the mouse was injected i.v. with 4T1 cells expressing scr and tdTomato red fluorescent protein (1 × 105/mouse). Five hours after the injection, lungs were fixed with 4% paraformaldehyde in PBS. Frozen sections of fixed lungs were stained with anti‐citrullinated histone H3 (H3Cit) antibody and DAPI. Bar = 20 μm. (h) Intravital imaging of NETosis in tumor‐bearing mouse. A tumor‐bearing mouse was prepared as in (g). 4T1 cells expressing scr and EGFP were injected i.v. into the tumor‐bearing mouse (1 × 105/mouse). Five hours after the injection, intravital imaging of lung was carried out and propidium iodide (PI) was injected i.v. to visualize extracellular DNA. White arrowheads indicate characteristic DNA fibers of NETosis. Bar = 20 μm. *P < 0.05.

Similar articles

Cited by

References

    1. McAllister SS, Weinberg RA. The tumour‐induced systemic environment as a critical regulator of cancer progression and metastasis. Nat Cell Biol 2014; 16: 717–27. - PMC - PubMed
    1. Cortez‐Retamozo V, Etzrodt M, Newton A et al Origins of tumor‐associated macrophages and neutrophils. Proc Natl Acad Sci U S A 2012; 109: 2491–6. - PMC - PubMed
    1. Talmadge JE, Gabrilovich DI. History of myeloid‐derived suppressor cells. Nat Rev Cancer 2013; 13: 739–52. - PMC - PubMed
    1. Heppner GH, Miller FR, Shekhar PM. Nontransgenic models of breast cancer. Breast Cancer Res 2000; 2: 331–4. - PMC - PubMed
    1. Kowanetz M, Wu X, Lee J et al Granulocyte‐colony stimulating factor promotes lung metastasis through mobilization of Ly6G+Ly6C+ granulocytes. Proc Natl Acad Sci U S A 2010; 107: 21248–55. - PMC - PubMed

MeSH terms

Substances