. 2016 Dec 12;30(6):879-890.
doi: 10.1016/j.ccell.2016.11.004.

Molecular Liver Cancer Prevention in Cirrhosis by Organ Transcriptome Analysis and Lysophosphatidic Acid Pathway Inhibition

Affiliations

Molecular Liver Cancer Prevention in Cirrhosis by Organ Transcriptome Analysis and Lysophosphatidic Acid Pathway Inhibition

Shigeki Nakagawa et al. Cancer Cell. .

Abstract

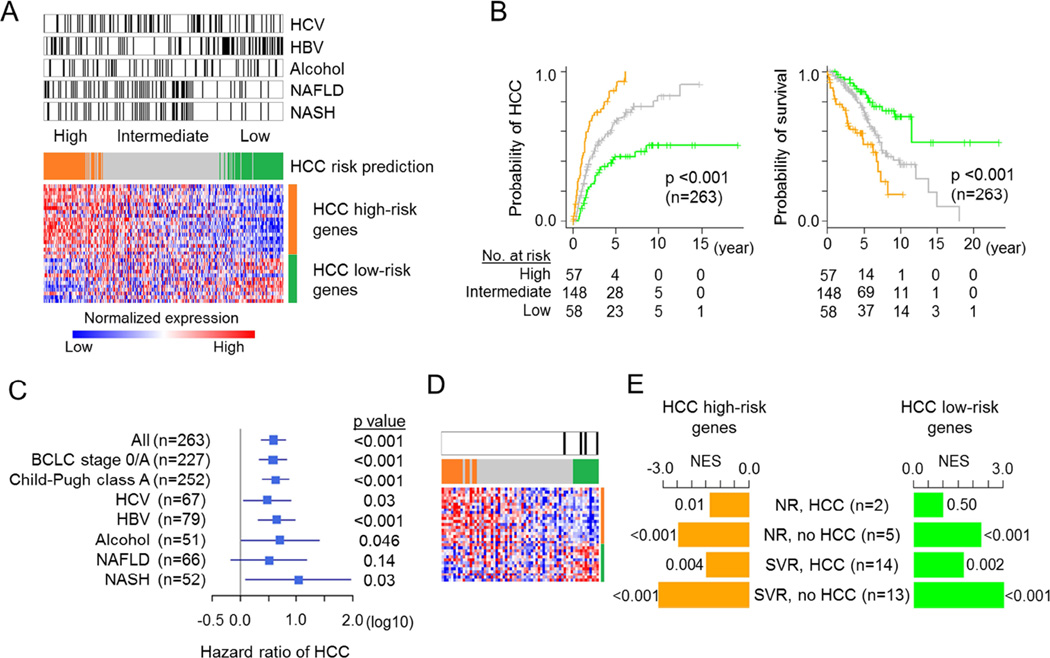
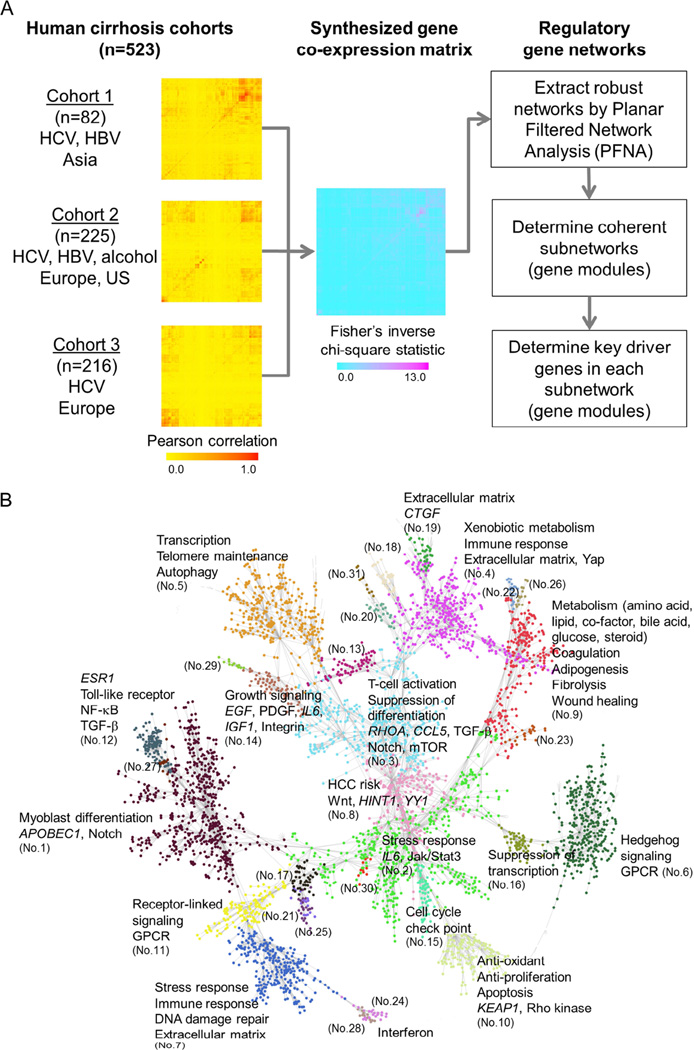
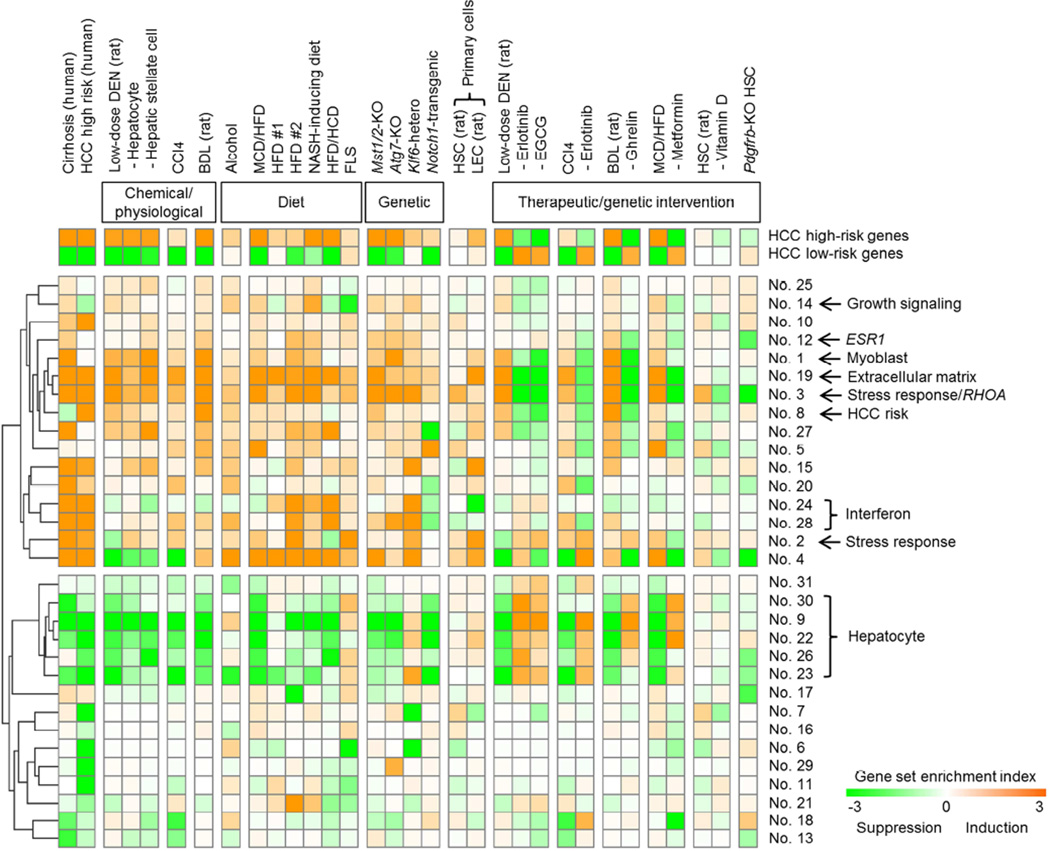
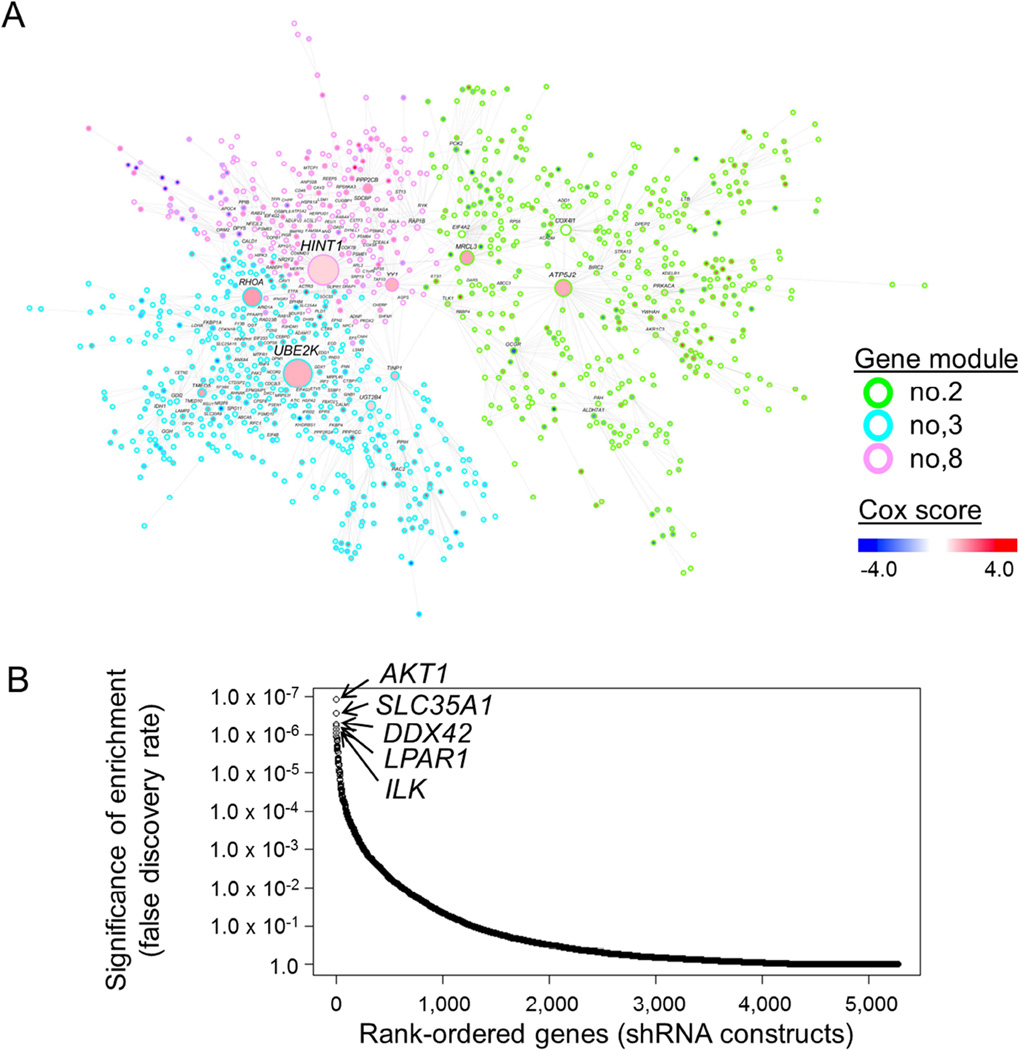
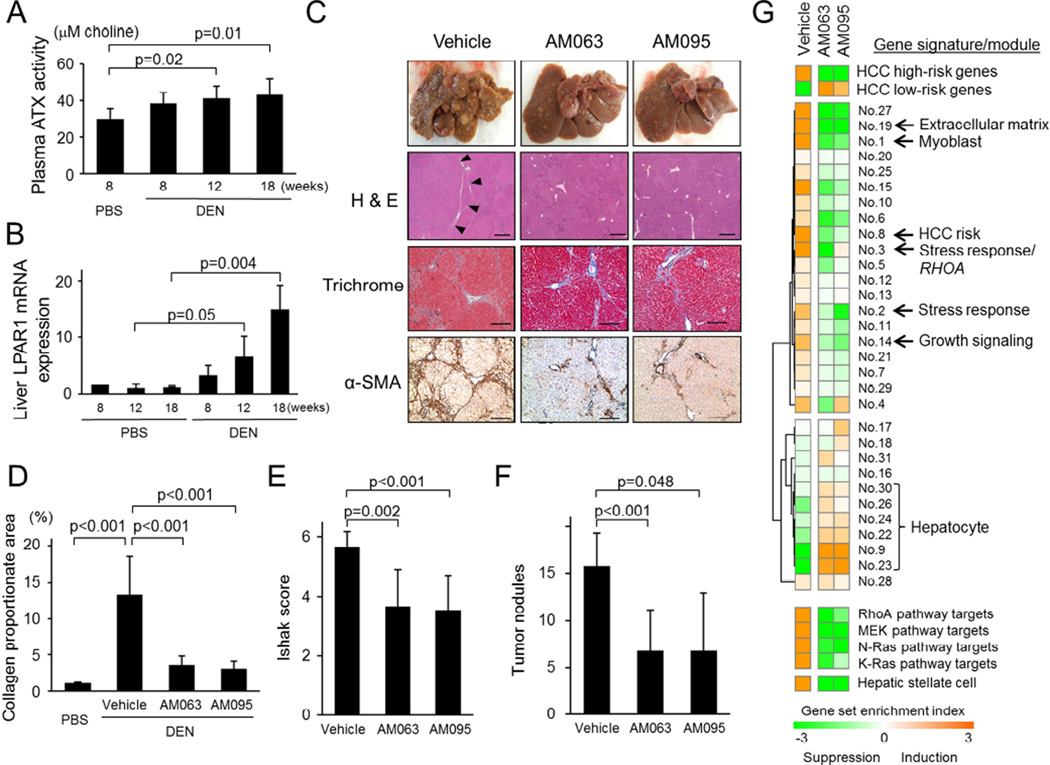
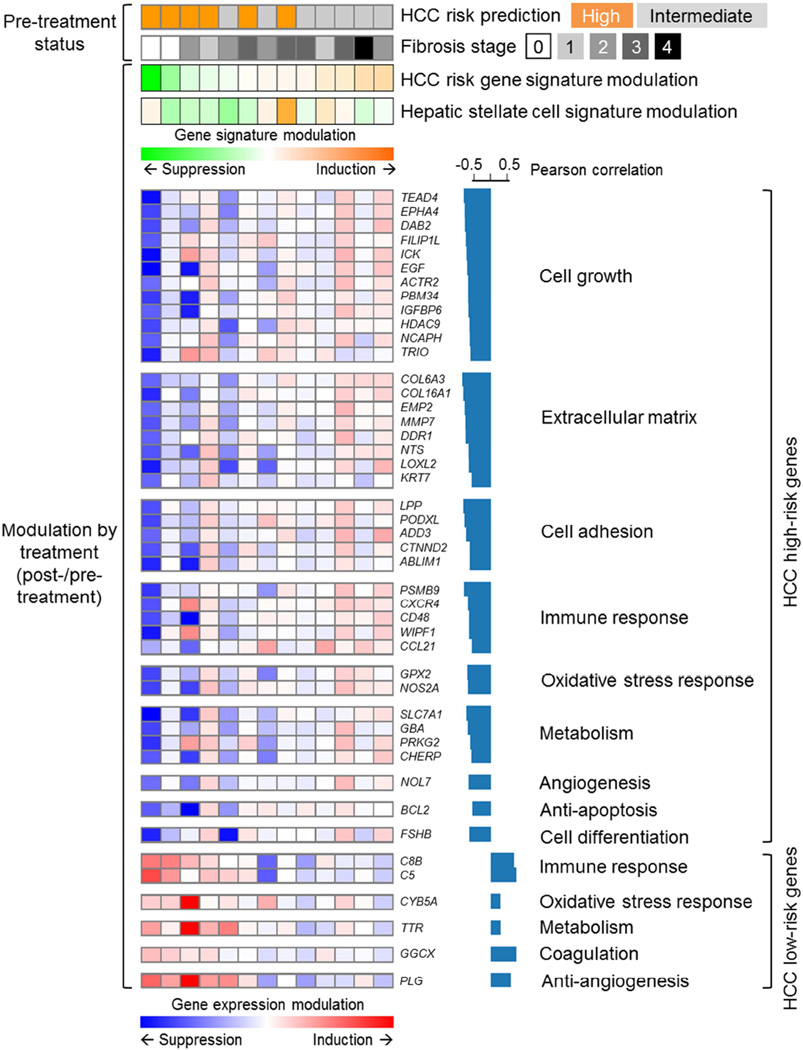
Cirrhosis is a milieu that develops hepatocellular carcinoma (HCC), the second most lethal cancer worldwide. HCC prediction and prevention in cirrhosis are key unmet medical needs. Here we have established an HCC risk gene signature applicable to all major HCC etiologies: hepatitis B/C, alcohol, and non-alcoholic steatohepatitis. A transcriptome meta-analysis of >500 human cirrhotics revealed global regulatory gene modules driving HCC risk and the lysophosphatidic acid pathway as a central chemoprevention target. Pharmacological inhibition of the pathway in vivo reduced tumors and reversed the gene signature, which was verified in organotypic ex vivo culture of patient-derived fibrotic liver tissues. These results demonstrate the utility of clinical organ transcriptome to enable a strategy, namely, reverse-engineering precision cancer prevention.

Keywords: cancer chemoprevention; gene signature; hepatocellular carcinoma; prognostic prediction; transcriptome.


Figures

Figure 1
Figure 1. HCC risk gene signature in the major HCC etiologies
(A) Heatmap of the 32-gene HCC risk gene signature, which classified the patients (n=263) into high-, intermediate-, and low-risk groups as indicated as orange, gray, and green color bars, respectively. Black bars on top indicate presence of each HCC etiology. (B) Probabilities of HCC (left) and overall survival (right) according to the gene signature-based HCC risk prediction. p values were calculated by log-rank test. (C) Hazard ratios of HCC development according to HCC etiology in multivariable Cox regression modeling adjusted for clinically-established risk factors. Blue squares indicate hazard ratios, and horizontal bars indicate corresponding 95% confidence interval. BCLC stage, Barcelona Clinic Liver Cancer prognostic stage. (D) Expression pattern of HCC risk gene signature in a subgroup of patients with HCV infection (n=67). Black bars indicate patients who achieved sustained virologic response (SVR) to anti-HCV therapy prior to HCC development. (E) HCC risk gene signature in paired liver biopsies obtained before and after anti-HCV therapy in patients with chronic hepatitis C who achieved no response (NR) or SVR and subsequently developed HCC or remained HCC-free. Magnitude of signature change is presented as normalized enrichment score (NES) computed by Gene Set Enrichment Analysis. Values attached to each bar indicates false discovery rate (FDR). See also Figure S1 and Table S1.
Figure 2
Figure 2. Human liver cirrhosis regulatory gene modules for discovery of HCC chemoprevention targets
(A) Transcriptomic meta-analysis of clinical liver fibrosis/cirrhosis cohorts to identify regulatory gene modules and putative key driver genes. Gene-gene correlation matrices in three human cirrhosis cohorts (left), synthesized gene-gene correlation matrix by using Fisher’s inverse chi-square statistic (middle), and workflow to identify regulatory gene modules and key driver genes (right) are shown. Rows and columns in the heatmaps represent genes in each cohort. (B) A graphical presentation of the 31 gene modules identified by Planar Filtered Network Analysis (PFNA) algorithm. Each node represents a gene colored according to assigned gene module. NF-κB: nuclear factor κ-B, TGF-β: transforming growth factor-β, GPCR: G protein-coupled receptor, PDGF: platelet-derived growth factor, mTOR: mechanistic target of rapamycin. See also Figure S2 and Tables S2, S3, S4, and S5.
Figure 3
Figure 3. Cross-species/model comparison in the space of human cirrhosis regulatory gene modules
Activation status of each cirrhosis gene module was assessed by Gene Set Enrichment Analysis, and visualized as gene set enrichment index (GSEI) calculated from gene set enrichment p value based on iterative random gene permutations (1,000 times for each module in each condition). Orange and green colors in heatmap indicate statistical significance of induction and suppression of each gene module, respectively, in association with each phenotype or intervention in each model. GSEI of +3 indicates induction (orange) at enrichment p=0.001, GSEI of −3 indicates suppression (green) at enrichment p=0.001, and GSEI of 0 indicates no modulation (white) at enrichment p=1.0. In “Cirrhosis (human)” column, genes in the transcriptome dataset were rank-ordered according to differential expression between cirrhotic and healthy livers to compute GSEI. In “HCC high risk (human)” column, genes were rank-ordered according to association with time to HCC development measured by Cox score (Hoshida et al., 2008) to compute GSEI. DEN, diethylnitrosamine; CCl4, carbon tetrachloride; BDL, bile duct ligation; MCD, methionine/choline-deficient diet, HFD, high fat diet; HCD, high cholesterol diet; FLS, fatty liver Shionogi; HSC, hepatic stellate cell; LEC, liver endothelial cell; EGCG, epigallocatechin gallate. See also Table S6
Figure 4
Figure 4. Bioinformatic identification of HCC chemoprevention targets
(A) Central hub gene modules no.2, no.3, and no.8 in human liver fibrosis/cirrhosis gene networks. Co-regulatory gene modules at the center of human liver fibrosis/cirrhosis regulatory gene networks determined by Planer Filtered Network Analysis (PFNA) in the genome-wide transcriptome profiles of 523 fibrotic/cirrhotic liver tissues (Cohort 1–3). Outline color of each node (gene) indicates gene module the gene belongs to (green, no.2; cyan, no.3; pink, no.8). Node color indicates correlation with HCC risk measured by Cox score in Cohort 1, from which the HCC risk gene signature was originally derived (red and blue colors indicate correlation with high and low HCC risk, respectively). Node size reflects connectivity to neighboring genes measured by degree. Putative key driver genes identified by Key Driver Analysis (KDA) are labeled with gene symbol. (B) Functional regulators of the HCC risk-associated gene module (no.8). Enrichment of experimental genetic perturbation transcriptome signatures defined by shRNA library-based knockdown of 5,272 genes (down-regulated gene signatures by the gene knockdown) derived from NIH Library of Integrated Cellular Signatures (LINCS) project (www.lincsproject.org) in the HCC risk-associated gene module, no.8, was systematically assessed in an unbiased manner using Fisher’s exact test with FDR correction. Genes are rank-ordered according to significance of enrichment (Fisher’s exact test false discovery rate), and top 5 genes are indicated with gene symbols. See also Figure S3 and Table S7.
Figure 5
Figure 5. LPA pathway inhibition attenuated fibrosis progression and reduced HCC in cirrhosis-driven HCC rat model
(A) Plasma autotaxin (ATX) activity over time during liver fibrosis progression in low-dose diethylnitrosamine (DEN) rat compared to control animals treated with PBS. (B) Hepatic lysophosphatidic acid receptor 1 gene (Lpar1) expression (normalized to Actin) over time during liver fibrosis progression. (C) Macroscopic images of the livers and tumors, H & E staining (arrow heads indicate tumor, scale bar indicates 100 µm), trichrome stain of fibrosis (scale bar indicates 250 µm), and α-smooth muscle actin (SMA) (marker of activated hepatic stellate cells, scale bar indicates 250 µm). (D) Change in collagen proportionate area by AM063 or AM095 treatment. (E) Change in histological liver fibrosis score, Ishak score (Ishak et al., 1995), by AM063 or AM095 treatment. (F) Change in number of HCC nodules by AM063 or AM095 treatment. (G) Modulation of HCC risk gene signature, human cirrhosis gene modules, and LPA downstream pathways (RhoA/MEK/Ras pathways) by AM063 or AM095 in RNA-Seq transcriptome profiles of low-dose DEN rat livers. The heatmap shows gene set enrichment index (GSEI) calculated from gene set enrichment p value based on iterative random gene permutations (1,000 times). GSEI of +3 indicates induction (orange) at enrichment p=0.001, GSEI of −3 indicates suppression (green) at enrichment p=0.001, and GSEI of 0 indicates no modulation (white) at enrichment p=1.0. Each experiment was performed at least in three biological replicates, and the results are presented by mean and standard deviation (error bar). p values were calculated by t-test with Bonferroni correction. See also Figure S4.
Figure 6
Figure 6. HCC risk gene signature modulation by LPA pathway inhibition by AM095 in organotypic ex vivo culture of clinical fibrotic liver tissues
HCC risk gene signature prediction was determined using tissues before the treatment. Modulation of HCC risk gene signature and hepatic stellate cell signature by AM095 is presented as gene set enrichment index (GSEI). Modulation of the signature member genes is presented as log2-fold change compared to respective DMSO-treated controls. Orange and green colors in the upper heatmap indicate induction and suppression of gene signature by GSEI, respectively. GSEI of +3 indicates induction (orange) at enrichment p=0.001, GSEI of −3 indicates suppression (green) at enrichment p=0.001, and GSEI of 0 indicates no modulation (white) at enrichment p=1.0. Read and blue colors in the lower heatmap indicate up- and down-regulation of gene expression, respectively. See also Figure S5.

Similar articles

Cited by

References

    1. Agrawal P, Yu K, Salomon AR, Sedivy JM. Proteomic profiling of Myc-associated proteins. Cell Cycle. 2010;9:4908–4921. - PMC - PubMed
    1. Berres ML, Koenen RR, Rueland A, Zaldivar MM, Heinrichs D, Sahin H, Schmitz P, Streetz KL, Berg T, Gassler N, et al. Antagonism of the chemokine Ccl5 ameliorates experimental liver fibrosis in mice. J Clin Invest. 2010;120:4129–4140. - PMC - PubMed
    1. Burra P, Rodriguez-Castro KI. Neoplastic disease after liver transplantation: Focus on de novo neoplasms. World J Gastroenterol. 2015;21:8753–8768. - PMC - PubMed
    1. Calle EE, Rodriguez C, Walker-Thurmond K, Thun MJ. Overweight, obesity, and mortality from cancer in a prospectively studied cohort of U.S. adults. N Engl J Med. 2003;348:1625–1638. - PubMed
    1. Calvisi DF, Ladu S, Pinna F, Frau M, Tomasi ML, Sini M, Simile MM, Bonelli P, Muroni MR, Seddaiu MA, et al. SKP2 and CKS1 promote degradation of cell cycle regulators and are associated with hepatocellular carcinoma prognosis. Gastroenterology. 2009;137:1816–1826. e1811–e1810. - PubMed

MeSH terms