. 2016 Dec 12;30(6):891-908.
doi: 10.1016/j.ccell.2016.11.003.

Integrated (epi)-Genomic Analyses Identify Subgroup-Specific Therapeutic Targets in CNS Rhabdoid Tumors

Jonathon Torchia  1 Brian Golbourn  2 Shengrui Feng  3 King Ching Ho  4 Patrick Sin-Chan  1 Alexandre Vasiljevic  5 Joseph D Norman  4 Paul Guilhamon  6 Livia Garzia  7 Natalia R Agamez  4 Mei Lu  4 Tiffany S Chan  1 Daniel Picard  4 Pasqualino de Antonellis  7 Dong-Anh Khuong-Quang  8 Aline C Planello  6 Constanze Zeller  6 Dalia Barsyte-Lovejoy  6 Lucie Lafay-Cousin  9 Louis Letourneau  10 Mathieu Bourgey  10 Man Yu  11 Deena M A Gendoo  4 Misko Dzamba  12 Mark Barszczyk  11 Tiago Medina  6 Alexandra N Riemenschneider  13 A Sorana Morrissy  7 Young-Shin Ra  14 Vijay Ramaswamy  4 Marc Remke  4 Christopher P Dunham  15 Stephen Yip  16 Ho-Keung Ng  17 Jian-Qiang Lu  18 Vivek Mehta  19 Steffen Albrecht  20 Jose Pimentel  21 Jennifer A Chan  22 Gino R Somers  23 Claudia C Faria  24 Lucia Roque  25 Maryam Fouladi  26 Lindsey M Hoffman  27 Andrew S Moore  28 Yin Wang  29 Seung Ah Choi  30 Jordan R Hansford  31 Daniel Catchpoole  32 Diane K Birks  27 Nicholas K Foreman  27 Doug Strother  33 Almos Klekner  34 Laszló Bognár  34 Miklós Garami  35 Péter Hauser  35 Tibor Hortobágyi  36 Beverly Wilson  33 Juliette Hukin  37 Anne-Sophie Carret  38 Timothy E Van Meter  39 Eugene I Hwang  40 Amar Gajjar  41 Shih-Hwa Chiou  42 Hideo Nakamura  43 Helen Toledano  44 Iris Fried  45 Daniel Fults  46 Takafumi Wataya  47 Chris Fryer  37 David D Eisenstat  33 Katrin Scheinemann  48 Adam J Fleming  48 Donna L Johnston  49 Jean Michaud  50 Shayna Zelcer  51 Robert Hammond  52 Samina Afzal  53 David A Ramsay  52 Nongnuch Sirachainan  54 Suradej Hongeng  54 Noppadol Larbcharoensub  55 Richard G Grundy  56 Rishi R Lulla  57 Jason R Fangusaro  57 Harriet Druker  58 Ute Bartels  58 Ronald Grant  58 David Malkin  59 C Jane McGlade  60 Theodore Nicolaides  61 Tarik Tihan  62 Joanna Phillips  62 Jacek Majewski  63 Alexandre Montpetit  10 Guillaume Bourque  63 Gary D Bader  64 Alyssa T Reddy  65 G Yancey Gillespie  66 Monika Warmuth-Metz  67 Stefan Rutkowski  68 Uri Tabori  69 Mathieu Lupien  3 Michael Brudno  70 Ulrich Schüller  71 Torsten Pietsch  72 Alexander R Judkins  73 Cynthia E Hawkins  74 Eric Bouffet  4 Seung-Ki Kim  30 Peter B Dirks  13 Michael D Taylor  75 Anat Erdreich-Epstein  76 Cheryl H Arrowsmith  6 Daniel D De Carvalho  77 James T Rutka  78 Nada Jabado  79 Annie Huang  80
Affiliations

Integrated (epi)-Genomic Analyses Identify Subgroup-Specific Therapeutic Targets in CNS Rhabdoid Tumors

Jonathon Torchia et al. Cancer Cell. .

Abstract

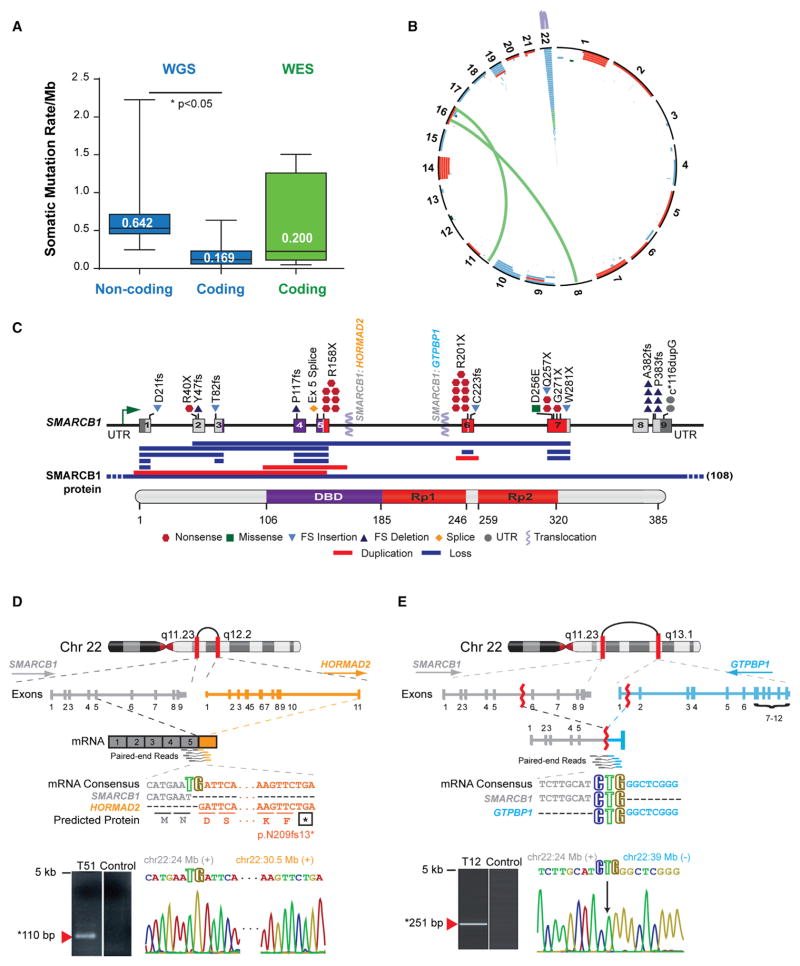
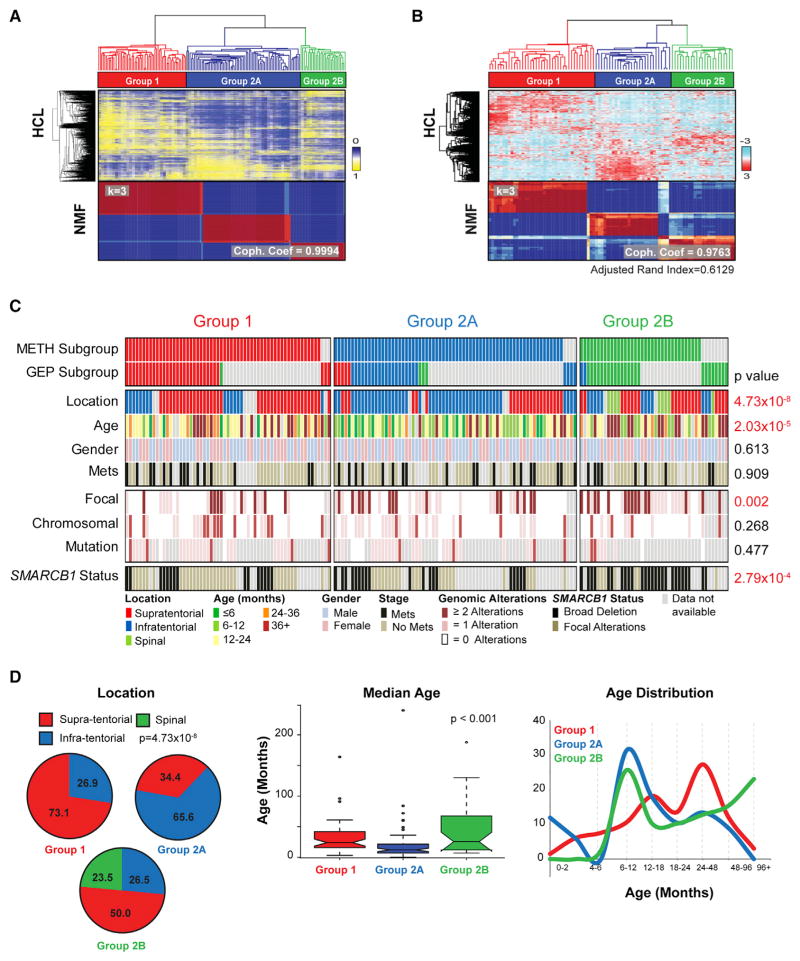
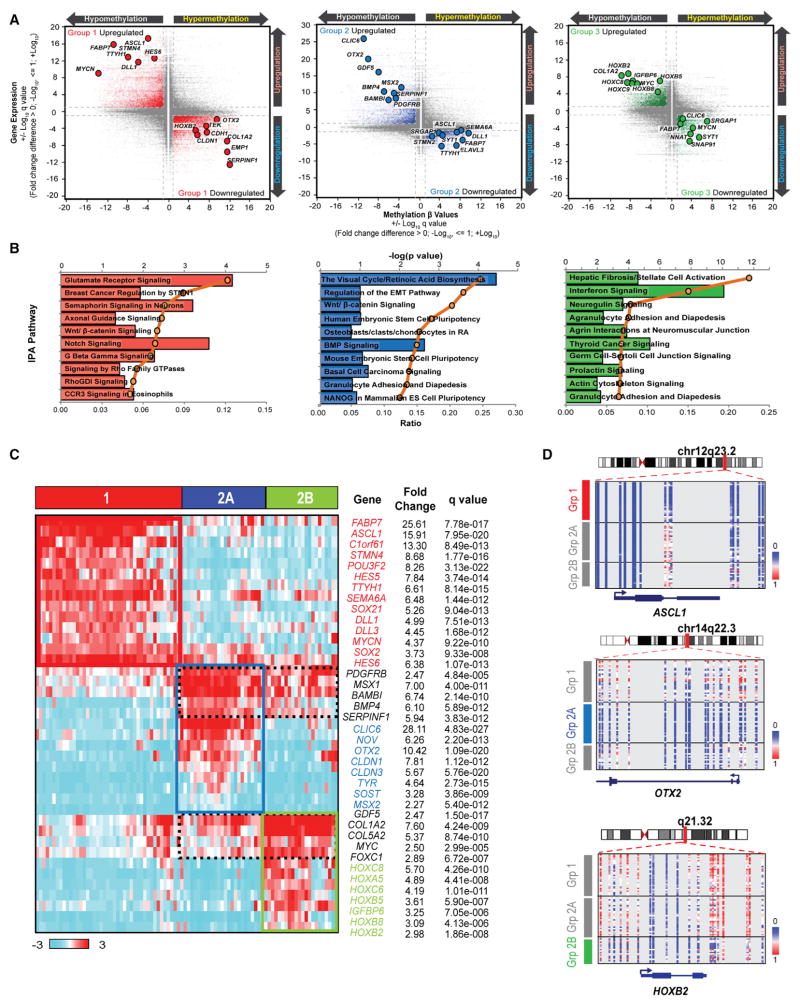
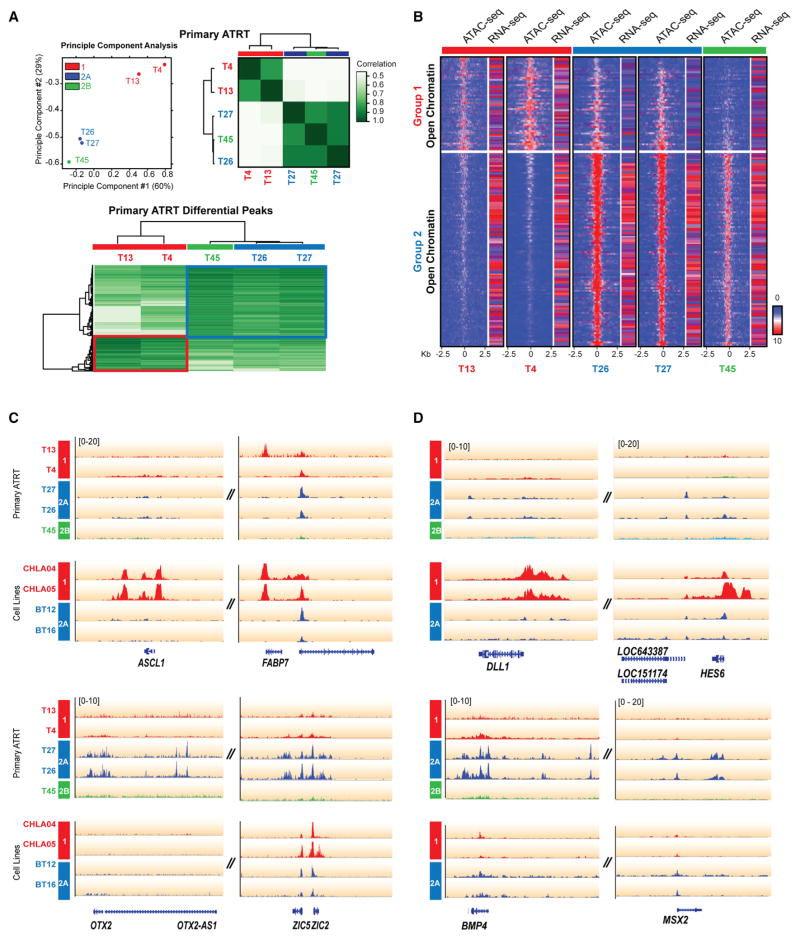
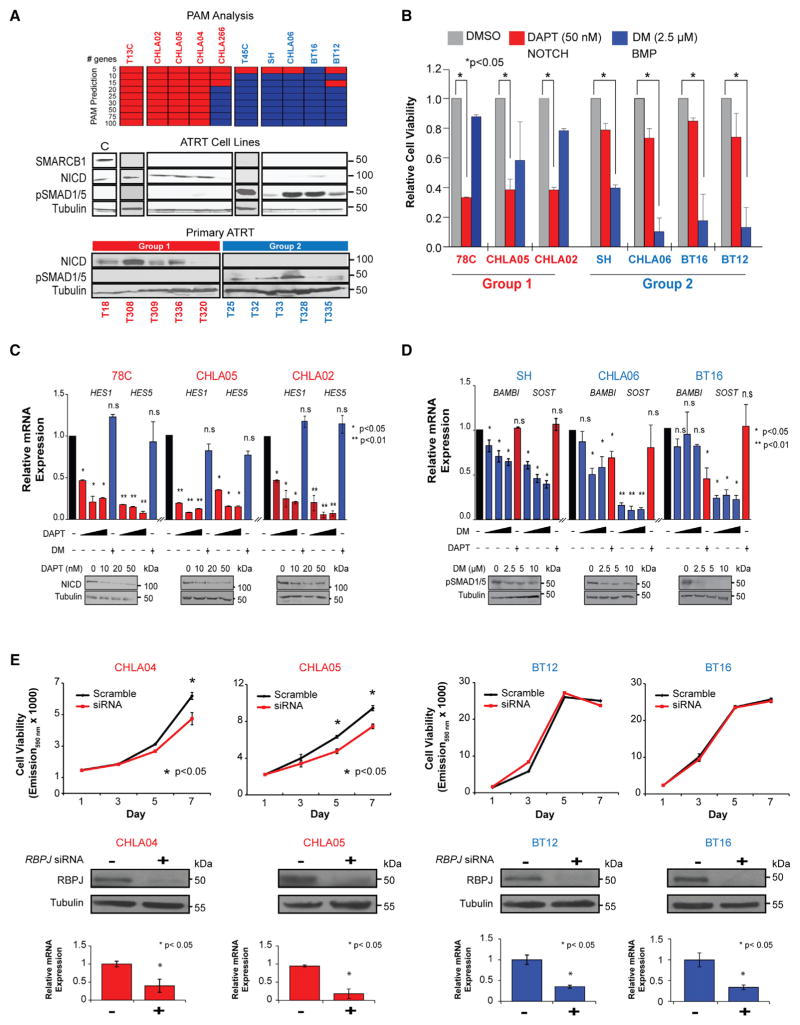
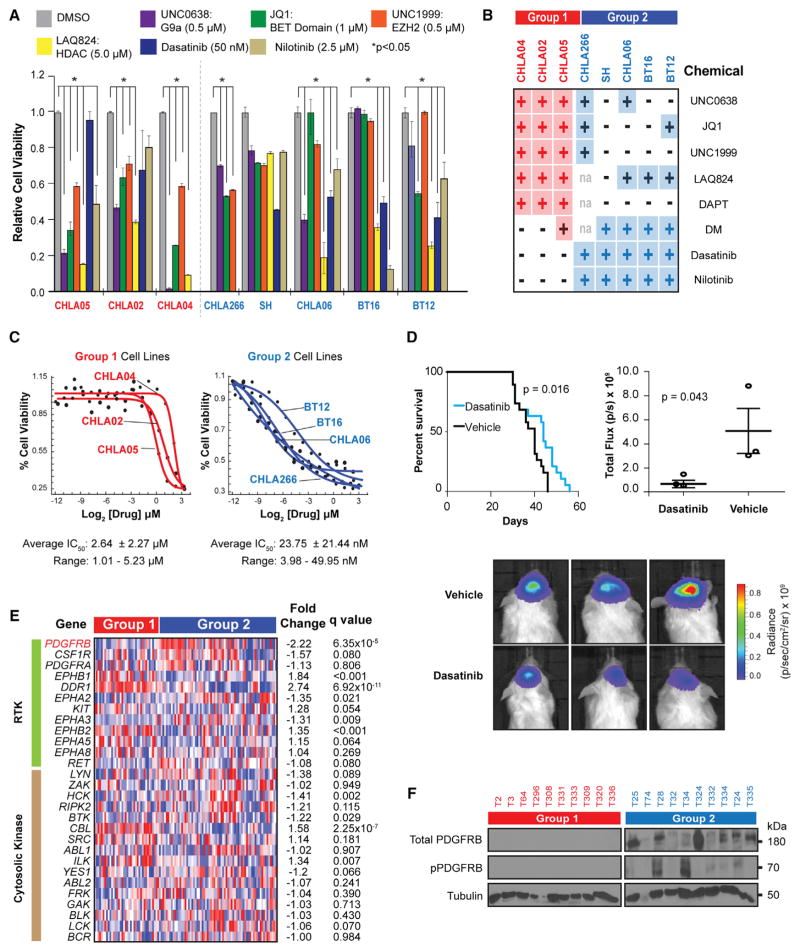
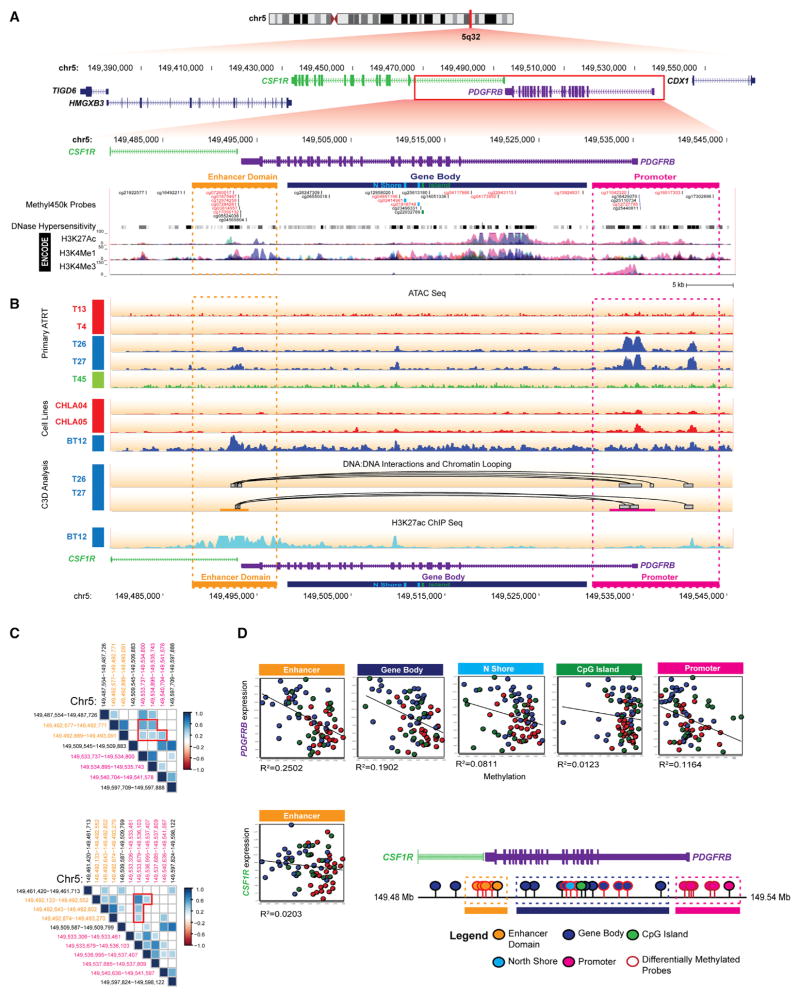
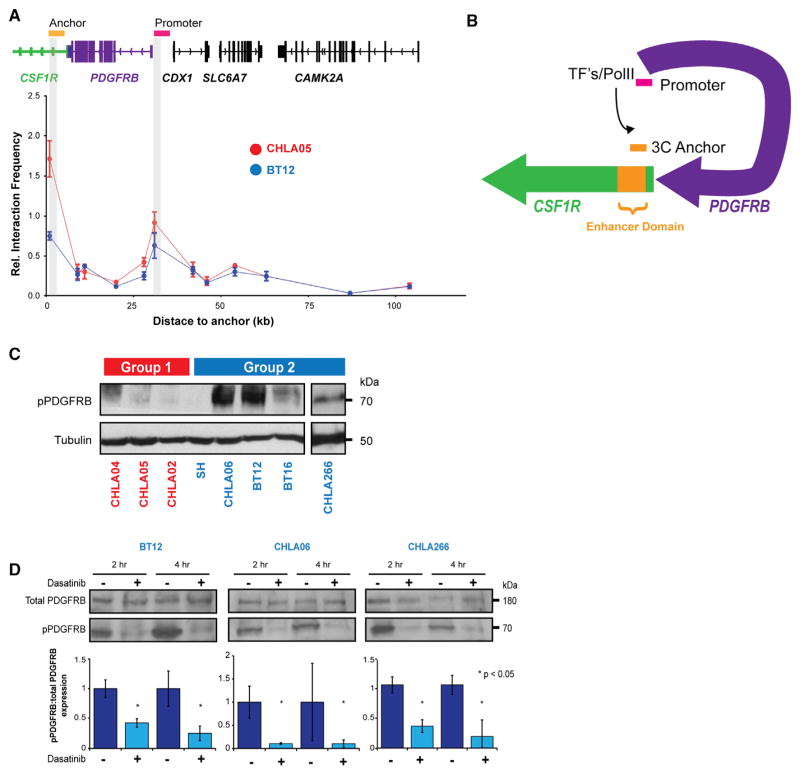
We recently reported that atypical teratoid rhabdoid tumors (ATRTs) comprise at least two transcriptional subtypes with different clinical outcomes; however, the mechanisms underlying therapeutic heterogeneity remained unclear. In this study, we analyzed 191 primary ATRTs and 10 ATRT cell lines to define the genomic and epigenomic landscape of ATRTs and identify subgroup-specific therapeutic targets. We found ATRTs segregated into three epigenetic subgroups with distinct genomic profiles, SMARCB1 genotypes, and chromatin landscape that correlated with differential cellular responses to a panel of signaling and epigenetic inhibitors. Significantly, we discovered that differential methylation of a PDGFRB-associated enhancer confers specific sensitivity of group 2 ATRT cells to dasatinib and nilotinib, and suggest that these are promising therapies for this highly lethal ATRT subtype.

Keywords: ATRT; enhancer; epigenomics; genomics; rhabdoid tumors; subgroup-specific therapeutics.


Figures

Figure 1
Figure 1. ATRT Coding Genome Is Predominantly Targeted By Structural Alterations
(A) Global genome and coding region somatic mutation rate in ATRTs. Median somatic mutation rates/Mb were calculated using WGS and WES data on 26 primary ATRTs with matched normal DNA. Boxplot middle represents median, box boundaries represent first and third quartiles; whiskers represent min and max values. (B) Circos plot of recurrent structural alterations, including SCNAs and gene rearrangements, from integrated WGS, RNA-seq, SNP, and 450k methylation array copy number data of 180 primary ATRTs. (C) Schema of SMARCB1 alterations relative to DNA binding domain (DBD) and repeat regions 1 and 2 (Rp1 and Rp2) domains in the SMARCB1 protein. (D) Schema of a chr22q intrachromosomal fusion of SMARCB1 exon 5 (gray) and HORMAD2 exon 11 (orange) identified by RNA-seq in ATRT T51 with consensus sequence and RT-PCR and Sanger sequencing validation of the fusion mRNA. (E) Schematic of a chr22q intrachromosomal translocation involving SMARCB1 intron 5 (gray) and GTPBP1 intron 1 (blue) identified by WES in ATRT T12 with CREST predicted mRNA consensus sequence of respective gene fragments and PCR and Sanger sequencing validation of breakpoint. See also Figure S1, Tables S1, S2, S3, S4, and S5.
Figure 2
Figure 2. ATRTs Comprise Three Epigenetic Subgroups with Distinct Clinical Profiles and Genotypes
(A and B) ATRTs were classified by unsupervised consensus hierarchical (HCL) and non-negative matrix factorization (NMF) cluster analyses of 450k methylation array (A) or Illumina HT12 gene expression array data (B). Adjusted Rand Index indicates concordance in methylation and gene expression clusters. Most stable tumor grouping indicated by highest cophenetic coefficient (Coph. Coef; k = 3) with 250 genes and 10,000 methylation probes are shown. (C) Clinical, molecular, and genotypic features of 177 primary ATRTs. Tumor subgroups determined by methylation or gene expression are indicated by red (group 1), blue (group 2A), green (group 2B) or gray (group not available) bars; clinical (tumor location, patient age, metastatic status), global patterns of CNAs (chromosomal or subchromosomal/focal), and type of SMARCB1 alterations in individual tumors are indicated. Clinical or molecular features with significant subgroup correlation are indicated in red. SMARCB1 alterations were classified as focal (point mutations, small indels, intergenic deletions) or broad (intragenic events, large deletions). (D) Tumor location, median age, and age distribution in ATRT subgroups. Boxplot middle represents median, box boundaries represent first and third quartiles, and whiskers represent 10th and 90th percentiles. See also Figures S2, S3, and Table S6.
Figure 3
Figure 3. ATRT Subgroups have Distinct Lineage-Enriched Transcriptional and Methylation Signatures
(A) Starburst plot of ATRT subgroup-specific genes with reciprocal changes in methylation (x axis) and gene expression (y axis). Genes associated with group 1 (left panel; red), group 2A (middle panel; blue), and group 2B (right panel; green) ATRTs are highlighted. (B) Top ten (top axis) enriched pathways for each subgroup was determined by ingenuity pathway analysis (IPA) of subgroup-specific genes with ±2-fold difference in expression; relative enrichment of pathways is shown on bottom axis. (C) Gene expression heatmap of subgroup-enriched neural/mesenchymal lineage and NOTCH/BMP/HOX signaling genes in ATRT determined by supervised t test with FDR correction. Genes enriched in individual subgroups, or shared by subgroups 2A and 2B are shown by solid and dashed boxes, respectively. (D) Heatmaps show methylation levels of representative lineage genes in ATRT subgroups; methylation status of probes in ASCL1, OTX2, and HOXB2 are shown relative to transcriptional start sites. See also Figures S4, S5, and Table S7.
Figure 4
Figure 4. ATRT Subgroups Have Unique Chromatin Landscape and Functional Genomes
(A) Principle component analysis (PCA) and correlation analysis of ATAC-seq data from five primary ATRTs. Aligned sequence reads from ATAC-seq profiling were converted to peak tag counts using HOMER software for PCA and correlation analysis using DiffBind software; color gradients indicate sample relatedness. Heatmap shows peaks enriched in group 1 and 2 ATRTs. (B) Genome-wide chromatin openness profiles of group 1 (T4, 13), 2A (T26, 27), and 2B (T45) ATRTs. Differentially open chromatin peaks (FDR < 0.5) were identified using DiffBind analysis of ATAC-seq data. Heatmap shows average read density in 20 bp bins (range ±2.5 kb from peak center) and FPKM values of corresponding genes in individual tumors determined by RNA-seq. The color scale is proportional to read enrichment and normalized between ChIP-seq experiments relative to input DNA. (C and D) ATAC-seq alignment tracks for subgroup-specific lineage (C) and signaling (D) genes in primary tumors and cell lines. Gene tracks are shown relative to hg19 RefSeq annotation and ATRT molecular group (red, 1; blue, 2A; green, 2B). See also Table S8.
Figure 5
Figure 5. NOTCH and BMP Inhibitors Have Subgroup-Specific Effects on ATRT Cell Growth
(A) Molecular subtype of ten ATRT cell lines is shown with a heatmap of PAM predicted gene classifiers based on primary ATRT gene expression data and western blot analyses of NOTCH intracellular domain (NICD) and pSMAD1/5 expression in cell lines and primary tumors. UW228 medulloblastoma cell line served as a control (C) for SMARCB1 expression; tubulin served as loading control. (B) MTS assays of group 1 and 2 cell lines respectively at 3 and 5 days post-treatment with DAPT and dorsomorphin (DM), cell viability is normalized to DMSO-treated controls. (C and D) Effect of DAPT and DM on NOTCH and BMP signaling in ATRT cells was confirmed by qRT-PCR analyses of respective target genes and western blot analyses for NICD and pSMAD1/5 in group 1 (C) and group 2 (D) cell lines treated with increasing doses (black triangles) of DAPT or DM, and cross-treated with a single dose of DM or DAPT; ± signs indicate presence or absence of specific drugs. mRNA levels are normalized to actin, and to carrier treated controls (black bars). Significance was calculated using Student’s t test. (E) Cell viability of group 1 (CHLA04, 05) and group 2 (BT12, 16) cell lines treated with RBPJ (25 nM) and scrambled control (20 nM) siRNA were assessed using Alamar blue assays; western blot and qRT-PCR analyses confirmed RBPJ knockdown. Error bars show ±SEM (n = 3). See also Figure S6.
Figure 6
Figure 6. Subgroup-Specific Effect of Signaling and Epigenetic Pathway Inhibitors on ATRT Cell Growth
(A) Cell viability of cell lines treated with indicated small molecules for 7 days was determined by the MTS assays relative to DMSO controls over 5–7 days. Error bars show ±SEM (n = 3). (B) Summary of MTS assays for cell lines treated with indicated chemicals. + and − indicate > or <30% reduction in cell viability, respectively. (C) Group 1 and 2 cell lines were treated with 0.3 nM–10 μM dasatinib; IC50 was determined using Alamar blue assays at day 6 post-treatment. (D) Kaplan-Meier survival analysis of mice with orthotopic BT12 cell line xenografts treated with 30 mg/kg intraperitoneal dasatinib injections for 2 weeks. Dot plot (middle bar represents mean, whiskers represent 10th and 90th percentiles) and BLI images depicting tumor mass at day 21 post-injection in three representative control and treated mice. Differences in survival and tumor growth were assessed using log rank (Mantel-Cox) test and ANOVA analysis, respectively. (E) Gene expression heatmap of PDGFRB (red) and putative receptor (green) and cytosolic tyrosine kinase (brown) targets of dasatinib/nilotinib in ATRTs. Significance was determined by FDR adjusted Student’s t test. (F) Western blot analyses of total and pPDGFRB in primary ATRTs. See also Figure S7.
Figure 7
Figure 7. A PDGFRB Enhancer Element Exhibits Differential Methylation and Chromatin Association in Group 2 ATRTs
(A) Schema of CSF1R (green) and PDGFRB (purple) relative to UCSC and/or ENCODE tracks and flanking genes (chr5:149,370,252-149,566,612) with a zoomed view of putative enhancer relative to exon 1 and gene body of CSF1R (blue) and PDGFRB promoter (purple) (chr5:149,479,360-149,545,365), 450k probe locations, DNaseI hypersensitivity, and ENCODE cell line tracks for H3K27Ac, H3K4Me1, and H3K4Me3 ChIP-seq data. Probes in PDGFRB promoter and putative enhancer with relative hypomethylation in group 2 ATRTs is shown in red font and dashed pink and orange boxes. (B) ATAC-seq signal for CSF1R/PDGFRB in primary ATRTs and cell line data is shown with C3D predicted associations (curved lines) of PDGFRB enhancer and promoter (boxed). Bottom track shows H3K27Ac ChIP-seq signal for BT12, a dasatinib-sensitive group 2 cell line. Group 1, 2A, and 2B primary ATRTs and cell lines are indicated in red, blue, and green, respectively. (C) Correlation matrix of associated open chromatin regions in a 120 kb window around the PDGFRB promoter predicted by C3D analysis of ATAC-seq data from tumors T26 (top panel) and T27 (bottom panel). Absolute correlation is shown proportional to size of colored squares, positive and negative correlations are indicated in blue and red, respectively. All correlations were tested within a 500 kb window of PDGFRB promoter and adjusted for statistical significance (FDR method); blank squares indicate insignificant correlations. (D) Pearson’s correlation/linear regression analyses of PDGFRB and CSF1R gene expression (log2, y axis) and methylation levels (β value, x axis) at the enhancer domain, PDGFRB gene body, North (N) shore, CpG island, and PDGFRB promoter. Location of differentially methylated CSF1R-PDGFRB probes based on 450k array data of 75 ATRTs is schematized. See also Figure S8.
Figure 8
Figure 8. A Promoter-Enhancer Loop Regulates PDGFRB Expression and Confers Dasatinib/Nilotinib Sensitivity in Group 2 ATRT
(A) 3C analyses of PDGFRB enhancer:promoter interaction in ATRT cell lines CHLA05 (red) and BT12 (blue). Plot indicates relative co-amplification and interaction frequency of an anchor primer in the putative enhancer with test primers located at various distances in the CSF1R/PDGFRB gene body and promoter (gray bars). (B) Schema of 3C analysis indicating DNA looping and direct interaction of PDGFRB promoter and an enhancer 50 kb upstream. (C) Western blot analyses of pPDGFRB expression in ATRT cell lines. (D) Western blot and corresponding densitometric analyses of total and pPDGFRB expression in group 2 cell lines post-treatment with 50 nM of dasatinib (+) and DMSO (−). Error bars show ±SEM (n = 3).

Similar articles

Cited by

References

    1. Anthony TE, Klein C, Fishell G, Heintz N. Radial glia serve as neuronal progenitors in all regions of the central nervous system. Neuron. 2004;41:881–890. - PubMed
    1. Araujo J, Logothetis C. Dasatinib: a potent SRC inhibitor in clinical development for the treatment of solid tumors. Cancer Treat Rev. 2010;36:492–500. - PMC - PubMed
    1. Birks DK, Donson AM, Patel PR, Dunham C, Muscat A, Algar EM, Ashley DM, Kleinschmidt-Demasters BK, Vibhakar R, Handler MH, Foreman NK. High expression of BMP pathway genes distinguishes a subset of atypical teratoid/rhabdoid tumors associated with shorter survival. Neurooncol. 2011;13:1296–1307. - PMC - PubMed
    1. Bourdeaut F, Lequin D, Brugieres L, Reynaud S, Dufour C, Doz F, Andre N, Stephan JL, Perel Y, Oberlin O, et al. Frequent hSNF5/INI1 germ-line mutations in patients with rhabdoid tumor. Clin Cancer Res. 2011;17:31–38. - PubMed
    1. Cecconi F, Proetzel G, Alvarez-Bolado G, Jay D, Gruss P. Expression of Meis2, a Knotted-related murine homeobox gene, indicates a role in the differentiation of the forebrain and the somitic mesoderm. Dev Dyn. 1997;210:184–190. - PubMed

MeSH terms

Supplementary concepts