. 2016 Dec 14;16(12):7551-7564.
doi: 10.1021/acs.nanolett.6b03378. Epub 2016 Nov 15.

Nanodiamond-Gadolinium(III) Aggregates for Tracking Cancer Growth In Vivo at High Field

Affiliations

Nanodiamond-Gadolinium(III) Aggregates for Tracking Cancer Growth In Vivo at High Field

Nikhil Rammohan et al. Nano Lett. .

Abstract

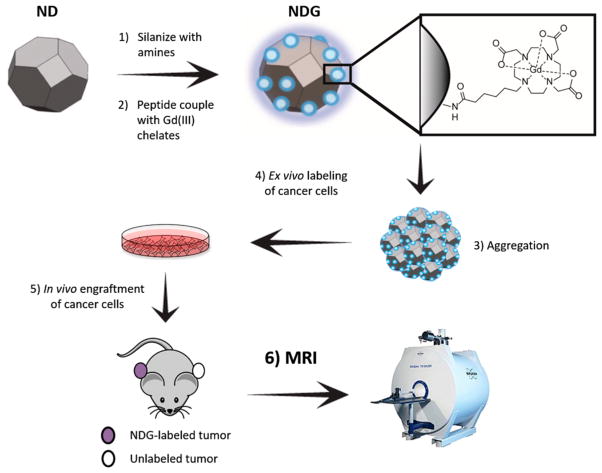
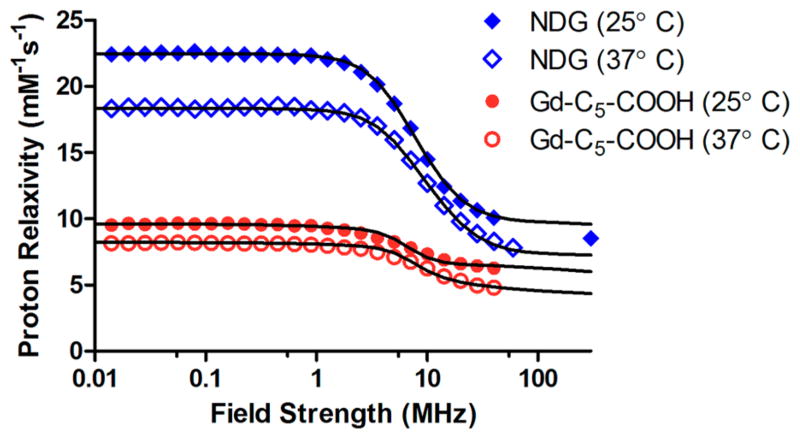
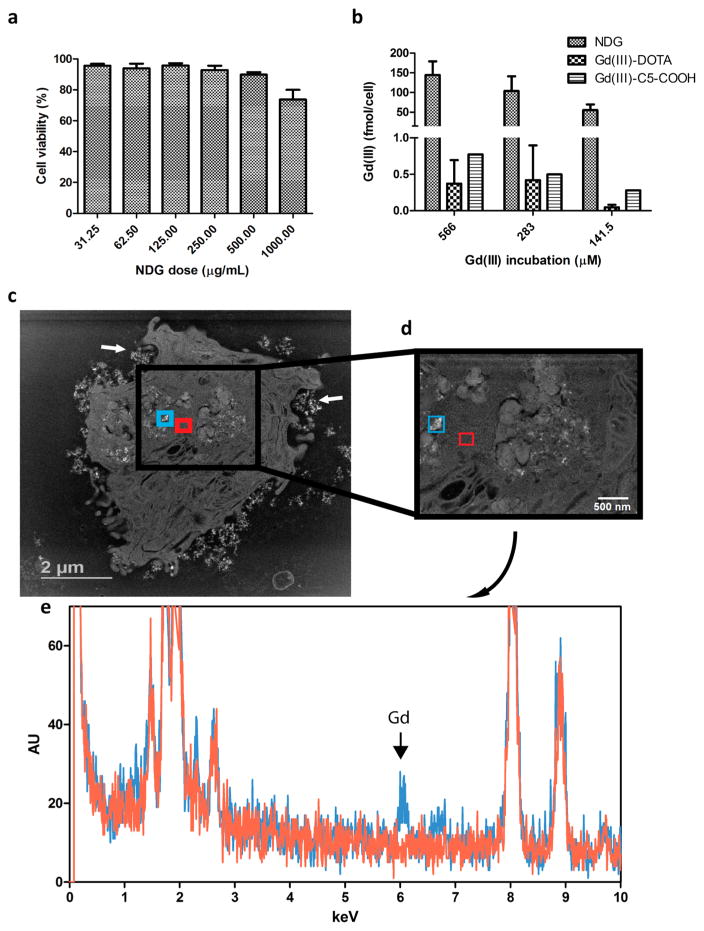
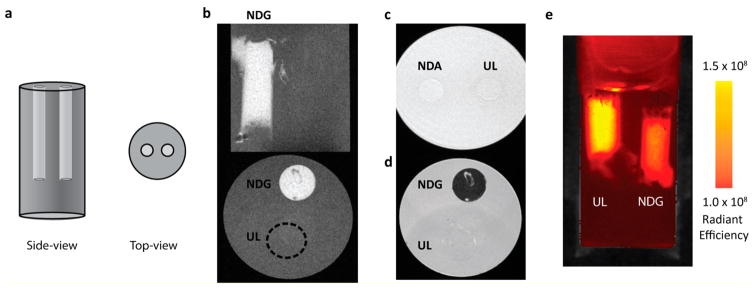
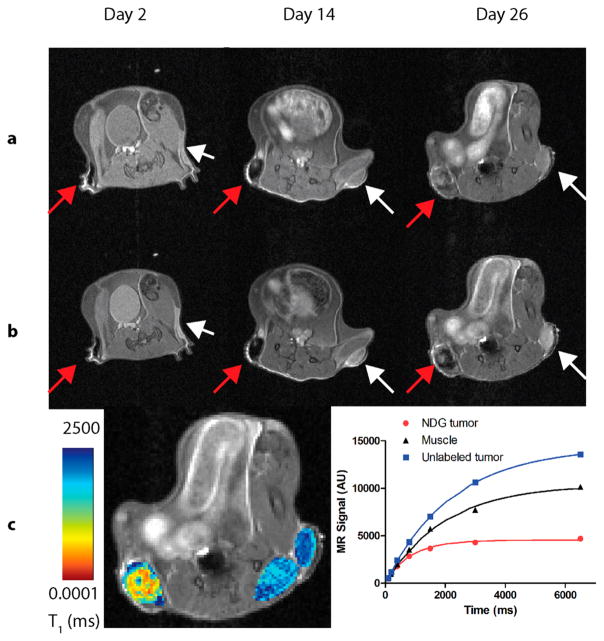
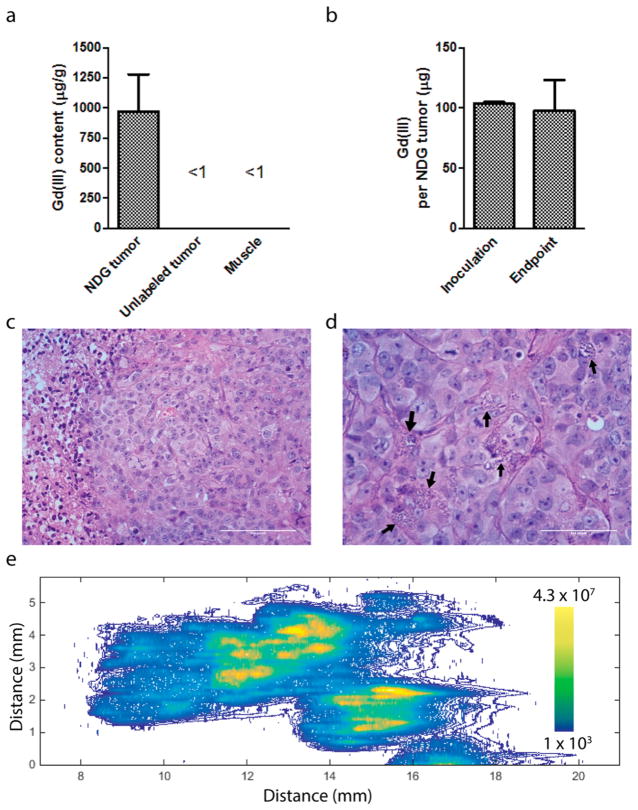
The ability to track labeled cancer cells in vivo would allow researchers to study their distribution, growth, and metastatic potential within the intact organism. Magnetic resonance (MR) imaging is invaluable for tracking cancer cells in vivo as it benefits from high spatial resolution and the absence of ionizing radiation. However, many MR contrast agents (CAs) required to label cells either do not significantly accumulate in cells or are not biologically compatible for translational studies. We have developed carbon-based nanodiamond-gadolinium(III) aggregates (NDG) for MR imaging that demonstrated remarkable properties for cell tracking in vivo. First, NDG had high relaxivity independent of field strength, a finding unprecedented for gadolinium(III) [Gd(III)]-nanoparticle conjugates. Second, NDG demonstrated a 300-fold increase in the cellular delivery of Gd(III) compared to that of clinical Gd(III) chelates without sacrificing biocompatibility. Further, we were able to monitor the tumor growth of NDG-labeled flank tumors by T1- and T2-weighted MR imaging for 26 days in vivo, longer than was reported for other MR CAs or nuclear agents. Finally, by utilizing quantitative maps of relaxation times, we were able to describe tumor morphology and heterogeneity (corroborated by histological analysis), which would not be possible with competing molecular imaging modalities.

Keywords: MRI; Nanodiamonds; cancer; gadolinium; in vivo.


Conflict of interest statement

Notes

The authors declare no competing financial interest.

Figures

Figure 1
Figure 1
Nanodiamond–gadolinium(III) aggregates (NDG) for tracking cancer cell growth in vivo. (1) A colloidal suspension of 4–6 nm detonation nanodiamonds (NDs) is reduced using borane in tetrahydrofuran, followed by silanization with (3-aminopropyl)-trimethoxysilane to increase primary amines on the ND surface (NDA). (2) NDA is peptide-coupled to Gd(III) chelates bearing a carboxylate with a six-carbon linker arm using EDC–NHS chemistry. (3) NDG spontaneously aggregates but maintains colloidal stability in water, saline, and serum-supplemented media. 4) MDA-MB-231 m-Cherry human breast cancer cells are labeled with NDG. (5) NDG-labeled cells are engrafted on the flank of immunocompromised SCID beige mice; on the other flank is engrafted an unlabeled xenograft of the same cells as a control. (6) Mice are serially imaged by MRI at 7 T to visualize tumor growth and morphology.
Figure 2
Figure 2
Nuclear magnetic relaxation dispersion profiles of NDG and Gd–C5–COOH. Longitudinal proton relaxivities of NDG and Gd–C5–COOH decrease with increasing magnetic field strength but remain stable at field strengths greater than 60 MHz. The r1 of NDG is higher than that of Gd–C5–COOH at all field strengths. Unlike most other Gd(III)-nanoparticle constructs, NDG does not benefit from a τR-mediated increase between 10 and 100 MHz, nor does it suffer from a decrease in relaxivity between 60 and 300 MHz. This is likely due to ND aggregates in solution providing a loose framework for Gd(III) conjugation that does not hinder the rotational freedom of the chelates. The lines are the best fit curves obtained using parameter values reported in Table S1.
Figure 3
Figure 3
Labeling MDA-MB-231 m-Cherry cells with NDG. (a) Cell viability shows that NDG is well-tolerated across a wide dose range. (b) Cells are incubated with NDG, Gd(III)–DOTA or Gd–C5–COOH for 24 h, after which they are harvested for analysis of Gd(III) content. NDG confers 300-fold improvement in cellular delivery of Gd(III) compared to Gd(III)–DOTA and Gd–C5–COOH. (c) STEM image of single cell after 24 h of incubation with NDG. Enhancing NDG aggregates are seen inside the cell and being engulfed near the plasma membrane (white arrows). (d) STEM image at greater magnification showing two highlighted areas: one with apparent NDG aggregates (teal) and another without (red). (e) EDX spectroscopy of the two regions highlighted in (d); the Lα1 peak of gadolinium is clearly observed in the spectrum for the region bearing NDG aggregates (teal) and not in the region of vacant cytoplasm (red). The Lα2 peak of gadolinium is also seen.
Figure 4
Figure 4
(a) Experimental setup for imaging cells suspended in agarose. A pair of 5 mm cylindrical cavities are created in a vial containing a 1:1 agarose–media gel. Each cavity is gelled with either NDG-labeled or unlabeled cells suspended in a 1:1 agarose–media mixture. (b) Coronal (top) and axial (bottom) section of vial containing cells suspended in agarose–media. “NDG” indicates the cavity containing NDG-labeled cells, where significant contrast enhancement is observed, while the cavity containing unlabeled cells (“UL”) is indiscernible (location indicated by dotted circle in axial section). (c) Axial T1-weighted MR image of NDA-labeled and unlabeled cells. NDA-labeled cells are indistinguishable from unlabeled cells in terms of contrast. “NDA” indicates NDA-labeled cells, “UL” indicates unlabeled cells. (d) Axial T2-weighted MR image of NDG-labeled and unlabeled cells (same vial as that used in (b)). NDG-labeled cells exhibit negative contrast, while a faint outline of the unlabeled cells is visible using T2-weighting. “NDG” indicates NDG-labeled cells; “UL” indicates unlabeled cells. (e) The same vial as that used in (b), imaged in an IVIS Lumina optical imaging system detecting m-Cherry fluorescence and measured as radiant efficiency with units of [(p/sec/cm2/sr)/(μW/cm2)]. m-Cherry readouts indicate the presence of cells in both cavities. “NDG” indicates NDG-labeled cells; “UL” indicates unlabeled cells.
Figure 5
Figure 5
7 T MR images of a SCID-beige mouse bearing a NDG-labeled xenograft and an unlabeled xenograft of MDA-MB-231 m-Cherry cells (n = 5, representative mouse shown). Images are shown 2, 14, and 26 days after engraftment. NDG tumor is on the right flank (left in page, red arrows); unlabeled tumor is on the left flank (right in page, white arrows). (a) T1-weighted images, where the NDG tumor is clearly visualized as a dark mass on the right flank, and the unlabeled tumor, showing a similar signal as compared to the surrounding muscle. As the NDG tumor enlarges, there is a progressive increase in signal brightness as Gd(III) dilutes within the tumor to limit the T2-shortening effect. (b) T2-weighted images, where the NDG appears dark and the unlabeled tumor appears bright relative to the surrounding tissue. This sequence of images validates the positions of the tumors in the T1-weighted sequence, particularly of the unlabeled tumor in the left flank. (c) A quantitative heat map of T1 relaxation times in the NDG tumor, unlabeled tumor and muscle is overlaid on the T2-weighted anatomical image of the mouse at day 26. Shorter T1 times in the NDG tumor likely indicate high levels of Gd(III) within the tumor core, while longer T1 times at the tumor edge likely indicate edema. The saturation-recovery plots of longitudinal relaxation (right panel) demonstrate the T2 shortening of T1 in the NDG tumor while showing longer relaxation time of the unlabeled tumor compared with those of the surrounding muscle.
Figure 6
Figure 6
(a) Gd(III) content of tumors harvested at the 26 day end point (n = 3). The NDG tumors have high Gd(III) content of approximately 1 mg per g of tissue, while unlabeled tumors and muscle has negligible quantities of Gd(III). (b) Gd(III) content in NDG tumors was compared between the inoculation time point and the 26 day end point, and on average, 95% of the Gd(III) remained within the tumor. (c) Hematoxylin and eosin (H&E) section of unlabeled tumor (40× magnification) showing uniform, invasive neoplastic cells along with a region of central clearing indicative of necrosis, along with showing several mitoses indicative of a high proliferative rate. (d) H&E section of NDG tumor (60× magnification) showing a similar morphology to the unlabeled tumor but containing visible NDG aggregates within neoplastic cells and in the interstitial space (black arrows). The number of mitoses visible is comparable to the unlabeled tumor. An enlarged image is shown in Figure S13 for greater detail. (e) Spatial distribution of Gd(III) in a cross-section of the NDG tumor, quantified using laser ablation ICP-MS. Gd(III) is distributed throughout the section, with highest concentrations in the center.

References

    1. Banerjee SR, Ngen EJ, Rotz MW, Kakkad S, Lisok A, Pracitto R, Pullambhatla M, Chen Z, Shah T, Artemov D, Meade TJ, Bhujwalla ZM, Pomper MG. Angew Chem, Int Ed. 2015;54(37):10778–82. - PMC - PubMed
    1. Heffern MC, Matosziuk LM, Meade TJ. Chem Rev. 2014;114(8):4496–539. - PMC - PubMed
    1. Manus LM, Strauch RC, Hung AH, Eckermann AL, Meade TJ. Anal Chem. 2012;84(15):6278–87. - PMC - PubMed
    1. Haris M, Yadav SK, Rizwan A, Singh A, Wang E, Hariharan H, Reddy R, Marincola FM. J Transl Med. 2015;13:313. - PMC - PubMed
    1. Nandwana V, De M, Chu S, Jaiswal M, Rotz M, Meade TJ, Dravid VP. Cancer Treat Res. 2015;166:51–83. - PMC - PubMed

Publication types

LinkOut - more resources