

Hyperbranched polyglycerol is superior to glucose for long-term preservation of peritoneal membrane in a rat model of chronic peritoneal dialysis
- PMID: 27964722
- PMCID: PMC5153908
- DOI: 10.1186/s12967-016-1098-z
Hyperbranched polyglycerol is superior to glucose for long-term preservation of peritoneal membrane in a rat model of chronic peritoneal dialysis
Abstract
Background: Replacing glucose with a better biocompatible osmotic agent in peritoneal dialysis (PD) solutions is needed in PD clinic. We previously demonstrated the potential of hyperbranched polyglycerol (HPG) as a replacement for glucose. This study further investigated the long-term effects of chronic exposure to HPG as compared to a glucose-based conventional PD solution on peritoneal membrane (PM) structure and function in rats.
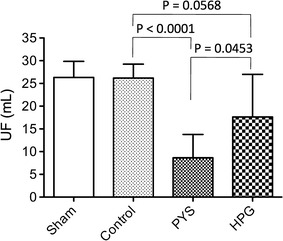
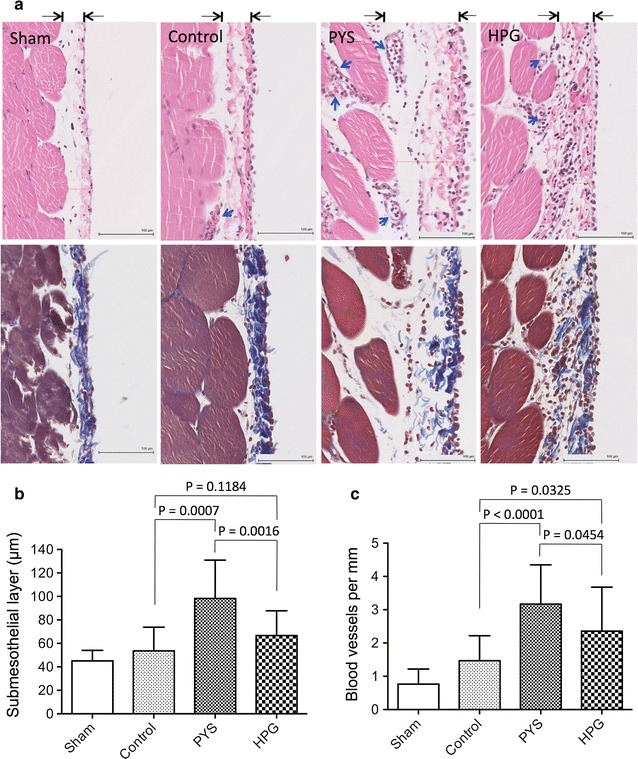
Methods: Adult male Wistar rats received once-daily intraperitoneal injection of 10 mL of HPG solution (1 kDa, HPG 6%) compared to Physioneal™ 40 (PYS, glucose 2.27%) or electrolyte solution (Control) for 3 months. The overall health conditions were determined by blood chemistry analysis. The PM function was determined by ultrafiltration, and its injury by histological and transcriptome-based pathway analyses.
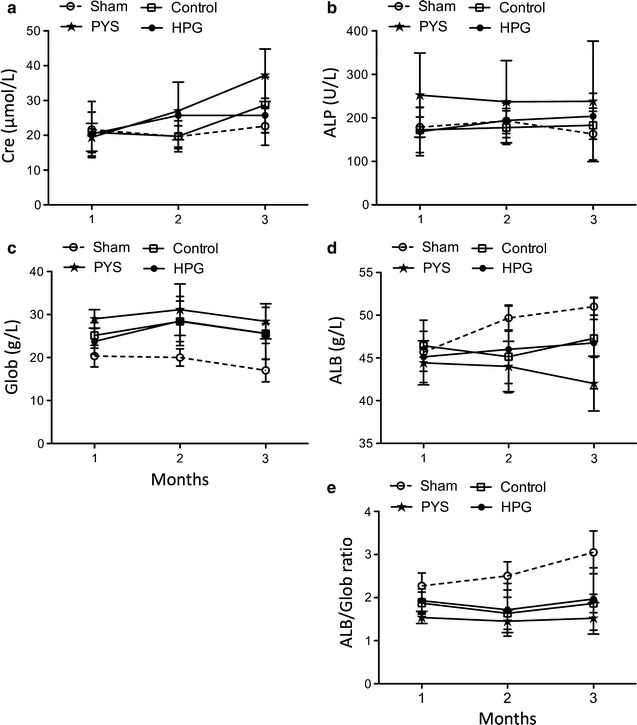
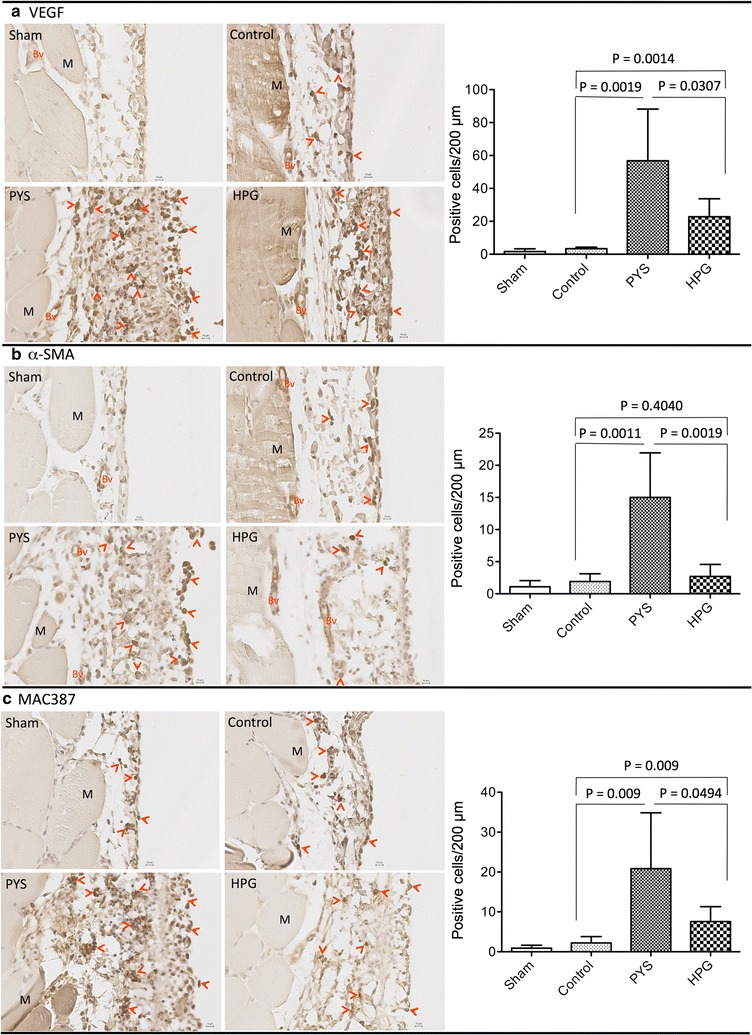
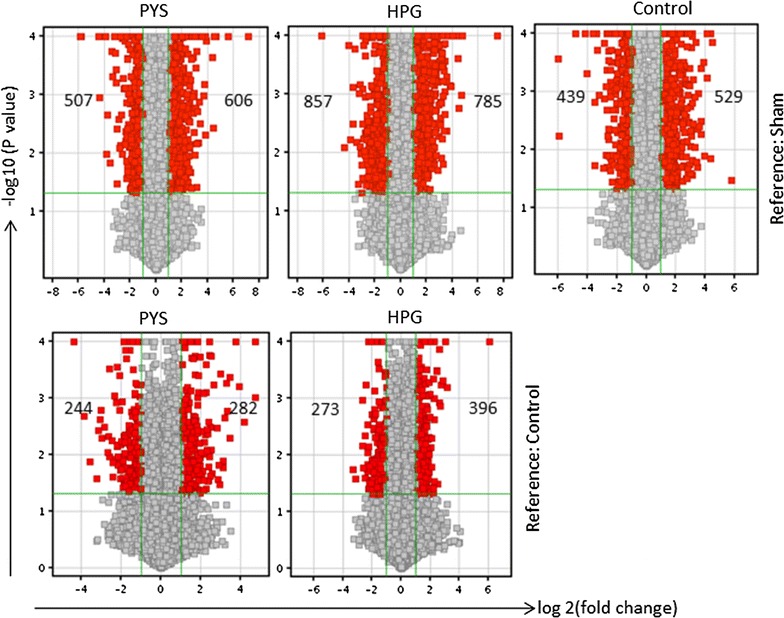
Results: Here, we showed that there was no difference in the blood chemistry between rats receiving the HPG and the Control, while PYS increased serum alkaline phosphatase, globulin and creatinine and decreased serum albumin. Unlike PYS, HPG did not significantly attenuate PM function, which was associated with smaller change in both the structure and the angiogenesis of the PM and less cells expressing vascular endothelial growth factor, α-smooth muscle actin and MAC387 (macrophage marker). The pathway analysis revealed that there were more inflammatory signaling pathways functioning in the PM of PYS group than those of HPG or Control, which included the signaling for cytokine production in both macrophages and T cells, interleukin (IL)-6, IL-10, Toll-like receptors, triggering receptor expressed on myeloid cells 1 and high mobility group box 1.
Conclusions: The results from this experimental study indicate the superiority of HPG to glucose in the preservation of the peritoneum function and structure during the long-term PD treatment, suggesting the potential of HPG as a novel osmotic agent for PD.
Keywords: Biocompatibility; Hyperbranched polyglycerol; Long-term PD; PD solution; Peritoneal membrane.
Figures
Similar articles
-
Peritoneal and Systemic Responses of Obese Type II Diabetic Rats to Chronic Exposure to a Hyperbranched Polyglycerol-Based Dialysis Solution.Basic Clin Pharmacol Toxicol. 2018 Oct;123(4):494-503. doi: 10.1111/bcpt.13038. Epub 2018 Jun 21. Basic Clin Pharmacol Toxicol. 2018. PMID: 29753311
-
The size-dependent efficacy and biocompatibility of hyperbranched polyglycerol in peritoneal dialysis.Biomaterials. 2014 Feb;35(5):1378-89. doi: 10.1016/j.biomaterials.2013.10.076. Epub 2013 Nov 15. Biomaterials. 2014. PMID: 24246641
-
Hyperbranched polyglycerol is an efficacious and biocompatible novel osmotic agent in a rodent model of peritoneal dialysis.Perit Dial Int. 2013 Jan-Feb;33(1):15-27. doi: 10.3747/pdi.2012.00148. Perit Dial Int. 2013. PMID: 23349194 Free PMC article.
-
Biocompatible peritoneal dialysis solutions: do we have one?Clin J Am Soc Nephrol. 2010 Apr;5(4):723-32. doi: 10.2215/CJN.05720809. Epub 2010 Jan 21. Clin J Am Soc Nephrol. 2010. PMID: 20093342 Review.
-
Inflammation, neoangiogenesis and fibrosis in peritoneal dialysis.Clin Chim Acta. 2013 Jun 5;421:46-50. doi: 10.1016/j.cca.2013.02.027. Epub 2013 Mar 4. Clin Chim Acta. 2013. PMID: 23466603 Review.
Cited by
-
Transcriptome analysis of signaling pathways of human peritoneal mesothelial cells in response to different osmotic agents in a peritoneal dialysis solution.BMC Nephrol. 2019 May 21;20(1):181. doi: 10.1186/s12882-019-1376-0. BMC Nephrol. 2019. PMID: 31113397 Free PMC article.
-
Biocompatible Peritoneal Dialysis: The Target Is Still Way Off.Front Physiol. 2019 Jan 7;9:1853. doi: 10.3389/fphys.2018.01853. eCollection 2018. Front Physiol. 2019. PMID: 30700974 Free PMC article. Review.
-
Protection of the Peritoneal Membrane by Peritoneal Dialysis Effluent-Derived Mesenchymal Stromal Cells in a Rat Model of Chronic Peritoneal Dialysis.Stem Cells Int. 2019 Sep 16;2019:8793640. doi: 10.1155/2019/8793640. eCollection 2019. Stem Cells Int. 2019. PMID: 31636678 Free PMC article.
-
Comparison of mesenchymal stromal cells from peritoneal dialysis effluent with those from umbilical cords: characteristics and therapeutic effects on chronic peritoneal dialysis in uremic rats.Stem Cell Res Ther. 2021 Jul 13;12(1):398. doi: 10.1186/s13287-021-02473-9. Stem Cell Res Ther. 2021. PMID: 34256856 Free PMC article.
-
Identification of Genes Associated with Decreasing Abundance of Monocytes in Long-Term Peritoneal Dialysis Patients.Int J Gen Med. 2023 Nov 3;16:5017-5030. doi: 10.2147/IJGM.S435041. eCollection 2023. Int J Gen Med. 2023. PMID: 37942472 Free PMC article.
References
-
- Purnell TS, Auguste P, Crews DC, Lamprea-Montealegre J, Olufade T, Greer R, et al. Comparison of life participation activities among adults treated by hemodialysis, peritoneal dialysis, and kidney transplantation: a systematic review. Am J Kidney Dis. 2013;62:953–973. doi: 10.1053/j.ajkd.2013.03.022. - DOI - PMC - PubMed
-
- Tse KC, Lui SL, Lo WK. Comparison of long-term survival (beyond 12 years) in patients on peritoneal dialysis and on hemodialysis. Perit Dial Int. 2003;23(Suppl 2):S104–S108. - PubMed
Publication types
MeSH terms
Substances
Grants and funding
LinkOut - more resources
Full Text Sources
Other Literature Sources
