

Movement-related beta oscillations show high intra-individual reliability
- PMID: 27965146
- PMCID: PMC5315054
- DOI: 10.1016/j.neuroimage.2016.12.025
Movement-related beta oscillations show high intra-individual reliability
Abstract
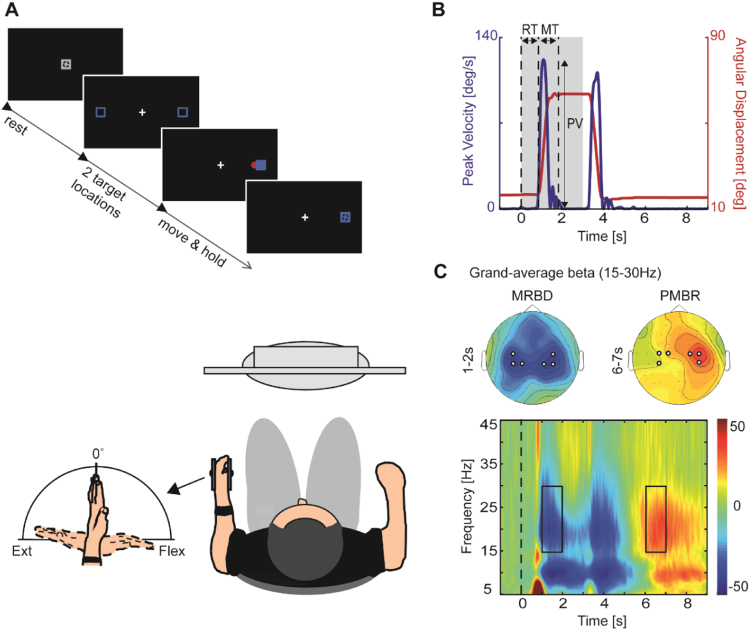
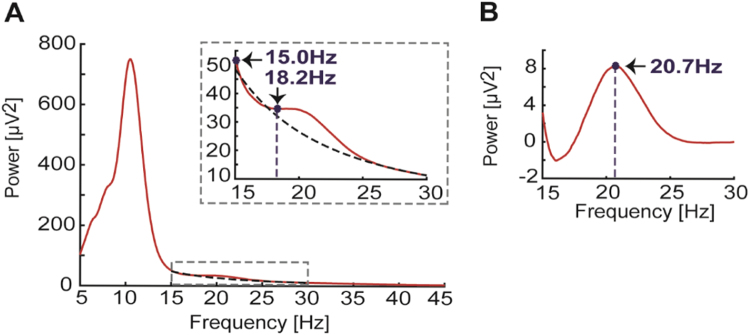
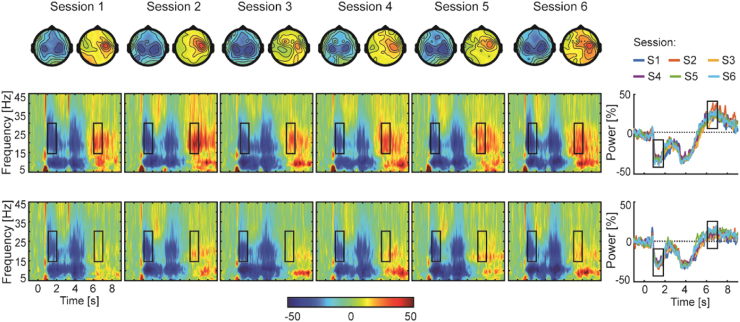
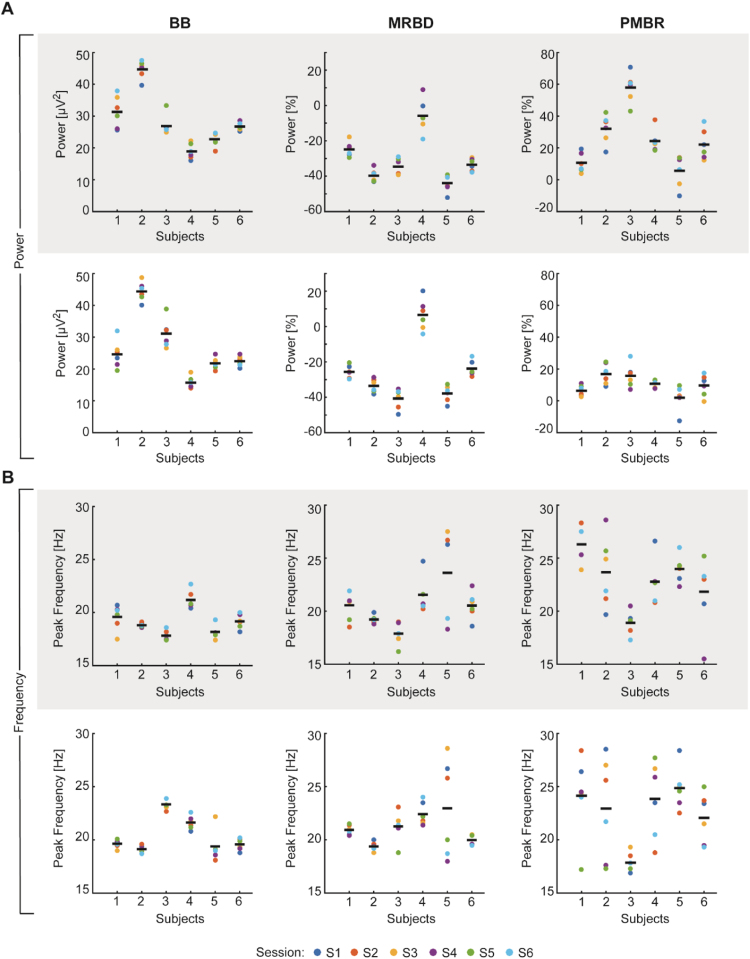
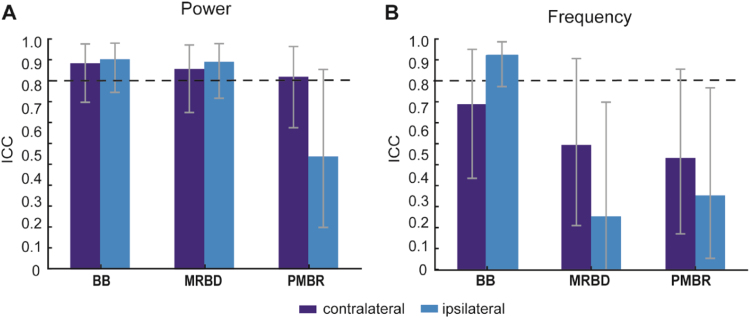
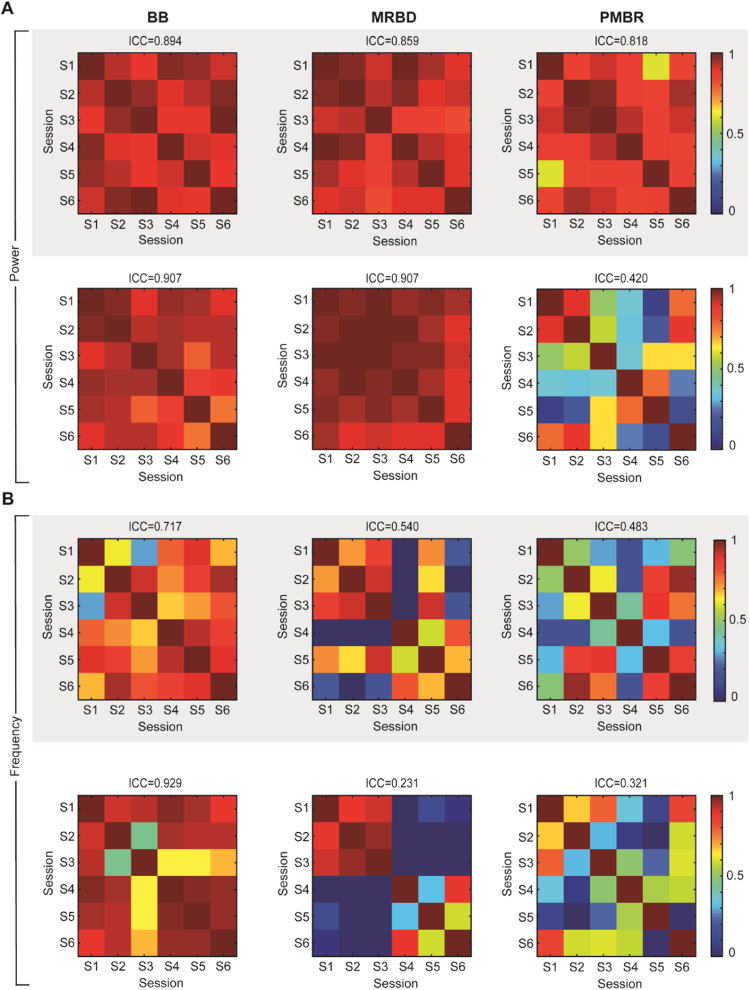
Oscillatory activity in the beta frequency range (15-30Hz) recorded from human sensorimotor cortex is of increasing interest as a putative biomarker of motor system function and dysfunction. Despite its increasing use in basic and clinical research, surprisingly little is known about the test-retest reliability of spectral power and peak frequency measures of beta oscillatory signals from sensorimotor cortex. Establishing that these beta measures are stable over time in healthy populations is a necessary precursor to their use in the clinic. Here, we used scalp electroencephalography (EEG) to evaluate intra-individual reliability of beta-band oscillations over six sessions, focusing on changes in beta activity during movement (Movement-Related Beta Desynchronization, MRBD) and after movement termination (Post-Movement Beta Rebound, PMBR). Subjects performed visually-cued unimanual wrist flexion and extension. We assessed Intraclass Correlation Coefficients (ICC) and between-session correlations for spectral power and peak frequency measures of movement-related and resting beta activity. Movement-related and resting beta power from both sensorimotor cortices was highly reliable across sessions. Resting beta power yielded highest reliability (average ICC=0.903), followed by MRBD (average ICC=0.886) and PMBR (average ICC=0.663). Notably, peak frequency measures yielded lower ICC values compared to the assessment of spectral power, particularly for movement-related beta activity (ICC=0.386-0.402). Our data highlight that power measures of movement-related beta oscillations are highly reliable, while corresponding peak frequency measures show greater intra-individual variability across sessions. Importantly, our finding that beta power estimates show high intra-individual reliability over time serves to validate the notion that these measures reflect meaningful individual differences that can be utilised in basic research and clinical studies.
Keywords: Beta oscillations; EEG; Intraclass correlation coefficient; Sensorimotor cortex; Test-retest reliability.
Copyright © 2016 The Authors. Published by Elsevier Inc. All rights reserved.
Figures
Similar articles
-
Modulation of post-movement beta rebound by contraction force and rate of force development.Hum Brain Mapp. 2016 Jul;37(7):2493-511. doi: 10.1002/hbm.23189. Epub 2016 Apr 8. Hum Brain Mapp. 2016. PMID: 27061243 Free PMC article.
-
Reproducibility of Rolandic beta rhythm modulation in MEG and EEG.J Neurophysiol. 2022 Feb 1;127(2):559-570. doi: 10.1152/jn.00267.2021. Epub 2022 Jan 19. J Neurophysiol. 2022. PMID: 35044809 Free PMC article.
-
Frequency-specific modulation of connectivity in the ipsilateral sensorimotor cortex by different forms of movement initiation.Neuroimage. 2017 Oct 1;159:248-260. doi: 10.1016/j.neuroimage.2017.07.054. Epub 2017 Jul 26. Neuroimage. 2017. PMID: 28756240
-
Sensorimotor and cognitive involvement of the beta-gamma oscillation in the frontal N30 component of somatosensory evoked potentials.Neuropsychologia. 2015 Dec;79(Pt B):215-22. doi: 10.1016/j.neuropsychologia.2015.04.033. Epub 2015 May 19. Neuropsychologia. 2015. PMID: 26002756 Review.
-
The ups and downs of β oscillations in sensorimotor cortex.Exp Neurol. 2013 Jul;245:15-26. doi: 10.1016/j.expneurol.2012.09.014. Epub 2012 Sep 27. Exp Neurol. 2013. PMID: 23022918 Review.
Cited by
-
Frequency-dependent modulation of neural oscillations across the gait cycle.Hum Brain Mapp. 2022 Aug 1;43(11):3404-3415. doi: 10.1002/hbm.25856. Epub 2022 Apr 6. Hum Brain Mapp. 2022. PMID: 35384123 Free PMC article.
-
Cognitive and White-Matter Compartment Models Reveal Selective Relations between Corticospinal Tract Microstructure and Simple Reaction Time.J Neurosci. 2019 Jul 24;39(30):5910-5921. doi: 10.1523/JNEUROSCI.2954-18.2019. Epub 2019 May 23. J Neurosci. 2019. PMID: 31123103 Free PMC article.
-
Enhanced human sensorimotor integration via self-modulation of the somatosensory activity.iScience. 2025 Mar 3;28(4):112145. doi: 10.1016/j.isci.2025.112145. eCollection 2025 Apr 18. iScience. 2025. PMID: 40151645 Free PMC article.
-
The neuromechanical of Beta-band corticomuscular coupling within the human motor system.Front Neurosci. 2024 Aug 15;18:1441002. doi: 10.3389/fnins.2024.1441002. eCollection 2024. Front Neurosci. 2024. PMID: 39211436 Free PMC article. Review.
-
Behavioral Induction of a High Beta State in Sensorimotor Cortex Leads to Movement Slowing.J Cogn Neurosci. 2021 Jun 1;33(7):1311-1328. doi: 10.1162/jocn_a_01717. J Cogn Neurosci. 2021. PMID: 34496400 Free PMC article.
References
-
- Alegre M., Labarga A., Gurtubay I.G., Iriarte J., Malanda A., Artieda J. Beta electroencephalograph changes during passive movements: sensory afferences contribute to beta event-related desynchronization in humans. Neurosci. Lett. 2002;331:29–32. - PubMed
-
- Babiloni C., Babiloni F., Carducci F., Cincotti F., Cocozza G., Del Percio C., Moretti D.V., Rossini P.M. Human cortical electroencephalography (EEG) rhythms during the observation of simple aimless movements: a high-resolution EEG study. Neuroimage. 2002;17:559–572. - PubMed
-
- Baker S.N., Kilner J.M., Pinches R.N., Lemon E.M. The role of synchrony and oscillations in the motor output. Exp. Brain Res. 1999;128:109–117. - PubMed
-
- Brown P. Abnormal oscillatory synchronisation in the motor system leads to impaired movement. Curr. Opin. Neurobiol. 2007;17:656–664. - PubMed
-
- Burgess A., Gruzelier J. Individual reliability of amplitude distribution in topographical mapping of EEG. Electroencephalogr. Clin. Neurophysiol. 1993;86:219–223. - PubMed
Publication types
MeSH terms
Grants and funding
LinkOut - more resources
Full Text Sources
Other Literature Sources
