. 2017 Jan;27(1):1-14.
doi: 10.1101/gr.202945.115. Epub 2016 Dec 13.

Reconstructing genetic history of Siberian and Northeastern European populations

Affiliations

Reconstructing genetic history of Siberian and Northeastern European populations

Emily H M Wong et al. Genome Res. 2017 Jan.

Abstract

Siberia and Northwestern Russia are home to over 40 culturally and linguistically diverse indigenous ethnic groups, yet genetic variation and histories of peoples from this region are largely uncharacterized. We present deep whole-genome sequencing data (∼38×) from 28 individuals belonging to 14 distinct indigenous populations from that region. We combined these data sets with additional 32 modern-day and 46 ancient human genomes to reconstruct genetic histories of several indigenous Northern Eurasian populations. We found that Siberian and East Asian populations shared 38% of their ancestry with a 45,000-yr-old Ust'-Ishim individual who was previously believed to have no modern-day descendants. Western Siberians trace 57% of their ancestry to ancient North Eurasians, represented by the 24,000-yr-old Siberian Mal'ta boy MA-1. Eastern Siberian populations formed a distinct sublineage that separated from other East Asian populations ∼10,000 yr ago. In addition, we uncovered admixtures between Siberians and Eastern European hunter-gatherers from Samara, Karelia, Hungary, and Sweden (from 8000-6600 yr ago); Yamnaya people (5300-4700 yr ago); and modern-day Northeastern Europeans. Our results provide new insights into genetic histories of Siberian and Northeastern European populations and evidence of ancient gene flow from Siberia into Europe.


Figures

Figure 1.
Figure 1.
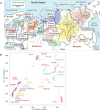
Geographic and genetic affinities of European and Siberian populations. (A) Map of Siberia, Western Russia, and Eastern Europe shows geographic locations of individuals sequenced as part of this work. Colored areas of the map show geographical areas traditionally occupied by corresponding populations (Peoples of Russia 1994). The Ural Mountain range, a natural boundary between Europe and Siberia, is shown as blue peaks. Western Siberian ethnic groups that include Mansi, Khanty, and Nenets people inhabit the vast regions of taiga stretching from the Ural Mountains in Western Siberia to the Yenisei River in the Siberian East. Northeastern European populations, including Komi, Karelians, and Veps, occupy areas to the west of Ural Mountains. The Eastern Siberian populations, including Altayans, Yakuts, Buryats, Evens, and Evenks, occupy the Siberian taiga region between the Yenisei River in the west and Sea of Okhotsk in the east. Kalmyks migrated in the 17th century to the lower Volga region from a region in northwestern China. (B) Principal component analysis (PCA) of 892 modern-day humans from 27 populations mainly from Siberia and Europe. PCA was performed using a common set of 137,637 SNPs. Sequenced samples are shown using an asterisk. Samples genotyped using DNA microarrays are shown with dots.
Figure 2.
Figure 2.
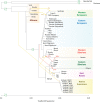
Genetic relationships of modern-day Siberian, Asian, Native American, European, and African populations. Autosomal TreeMix admixture graph based on whole-genome sequencing data from 44 individuals primarily from Africa, Europe, Siberia, and America. The x-axis represents genetic drift, which is proportional to the effective population size Ne. Admixture events are shown with arrows, with admixture intensities indicated by percentages. Residuals are shown in Supplemental Figure S5.
Figure 3.
Figure 3.
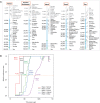
MSMC analysis of population separation times. (A) Separation times were calculated for each of the five reference individuals (French, Andreapol Russian, Mansi, Evenk, and Han). Reference populations are shown at the top (inside the orange rounded rectangles). Each reference population column shows MSMC separation time estimates between the reference population and other populations of interest. Populations of interest were sorted according to their separation time from diverging most recently (top) to the oldest (bottom). Separation times are shown on the left side of each graph. Populations with similar times were grouped together. (And) Andreapol; (Ust) Ustyuzhna; (Ob) Objachevo. MSMC separation times under 10,000 yr may be noisy, and therefore, such separation times and corresponding populations are shown in a gray-colored font. (B) MSMC cross-coalescence plots corresponding to divergence between Mansi and five other populations (Nenets, Evenks, French, Andean Highlanders, Dinka). The median separation value (y = 0.5; orange line) was used as a proxy for the population divergence time.
Figure 4.
Figure 4.
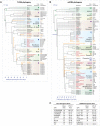
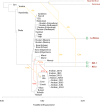
Y-Chromosome and mtDNA phylogeny and haplogroup divergence times. (A) Y-Chromosome tree topology was calculated using maximum likelihood approach implemented in MEGA tool (Tamura et al. 2011) using 12,394 polymorphic sites within high-confidence regions defined by Poznik et al. (2013). The x-axis represents divergence time of haplogroups and is expressed in units of thousands of years ago (1 kya = 1000 yr ago). The tree was constructed using the data from 54 modern-day humans from 30 populations. Split times were calculated according to the number of derived alleles assigned to each branch (Methods), and splits were placed along the x-axis to reflect haplotype divergence time. Terminal branches end at X = 0 for modern-day individuals. Seven ancient individuals were placed on the haplotype tree according to the SNP-sharing patterns with high-confidence–derived allele SNVs assigned to each branch. Branches of ancient individuals (orange lines) terminate at times when each ancient individual lived. Haplogroups were assigned based on ISOGG Y-Chromosome SNP index and shown along the right side of the tree (International Society of Genetic Genealogy 2014). Individuals sequenced as part of this work are shown in red. (B) mtDNA phylogeny was constructed using MEGA tool in a similar fashion to the Y-Chromosome tree. The tree includes data from 70 individuals and 34 populations, as well as eight ancient genomes. (C) Divergence times of haplogroups from Y-Chromosome phylogeny (left) and mtDNA phylogeny (right). Diverging clades are shown on the left sides (“Split” columns). Confidence intervals were calculated using Poisson model.
Figure 5.
Figure 5.
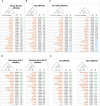
Analysis of admixtures using D-statistics. Genetic affinities were determined using D-statistics test D(P1, P2, P3, O) as defined previously (Durand et al. 2011). (A) Mezen Russian affinities; (B) Veps affinities; (C) Ust’-Ishim affinities; (D) Mal'ta boy (MA-1) and Afontova Gora (AG-2) affinities; (E) Ire8 and Ajv52 affinities. The affinities of a variable population X (orange color) relative to other populations were calculated using ADMIXTOOLS (Patterson et al. 2012) and shown under the D column. Statistical significance of admixture was expressed as a z-score and shown under the Z column. A green font was used to highlight significant admixtures between P1 and P3 (Z > 3). A blue font was used to highlight significant admixture between P2 and P3 (Z < −3). African San was used as an outgroup in all tests. (And) Andreapol; (Ust) Ustyuzhna; (Ob) Objachevo. D-Statistics results using different outgroups (Chimp, Mandenka, Mbuti) are shown in Supplemental Figures S13 and S17.
Figure 6.
Figure 6.
Genetic relationships of Ust’-Ishim and modern-day humans. TreeMix model with seven admixture events incorporates ancient Siberian Ust’-Ishim. Blue circles indicate branching events that were investigated using 100 bootstraps, and percentages of trees supporting the branch point are shown. Residuals are shown in Supplemental Figure S14.
Figure 7.
Figure 7.
Genetic relationships with ancient North Eurasians MA-1 and AG-2. Autosomal TreeMix admixture graph that includes ancient 7000-yr old La Brana (Spain) and low-coverage genomes of ancient Siberians MA-1 and AG-2. Residual plot for this graph is shown in Supplemental Figure S16. TreeMix model indicated multiple admixture events: 41% admixture (95% CI: 36%–45%) from the ANE clade represented by MA-1 and AG-2 individuals into Native Americans represented by Andean Highlanders, 43% admixture (95% CI: 38%–47%) between population related to Evenk and a common ancestor of Western Siberians (Mansi and Nenets), and 26% (95% CI: 16%–37%) admixture between population related to Even and modern-day Nenets. Additionally, Western Siberians and ANE are grouped together, indicating their shared genetic history.
Figure 8.
Figure 8.
Geographical dispersion model. The approximate model of gene flows reflecting divergence of primary clades in Europe, East Asia, and Siberia with approximate divergence times based on Chromosome Y, MSMC, TreeMix, and D-statistics analyses. Percentages represent proportions of ancestry contributed to each lineage from other lineages. The common ancestors of Mansi, Khanty, and Nenets had derived 57% of their ancestry from an ANE population, related to MA-1, AG-2, and Native Americans and 43% from the admixture with a population related to Evens and Evenks. Native Americans trace 42% of their ancestry to ANE and 58% to a common ancestor of Eastern Siberians and East Asians. In the figure, 45 kya represents the split between Y-Chromosome clades QR and NO; 33 kya represents the split between Y-Chromosome Q and R clades and mtDNA N2 and W clades; 17 kya represents Mansi-Andean separation time; 44 kya represents the split of Ust’-Ishim's haplogroup from NO clade; 19 kya represents Han-Andean separation time; 10 kya represents Han-Eastern Siberian separation time; and 5.3–9.9 kya represents Evenk-Mansi MSMC separation time (6.8–9.9 kya) and expansion of N1c1 Y-haplogroup (5.3–7.1 kya). In this figure, Europeans represent a collective term for the following populations from this study: Komi, Veps, Karelians, Russians, and Belarussians.

Similar articles

Cited by

References

    1. The 1000 Genomes Project Consortium. 2012. An integrated map of genetic variation from 1,092 human genomes. Nature 491: 56–65. - PMC - PubMed
    1. Allentoft ME, Sikora M, Sjögren KG, Rasmussen S, Rasmussen M, Stenderup J, Damgaard PB, Schroeder H, Ahlström T, Vinner L, et al. 2015. Population genomics of Bronze Age Eurasia. Nature 522: 167–172. - PubMed
    1. Bunak VV. 1956. Human races and ways of their formation. Sov Ethnogr 1: 86–105 (in Russian).
    1. Bunak VV. 1965. Problems of the genesis of races. In The origin and ethnic history of Russian people (ed. Bunak VV), pp. 174–190. Nauka, Moscow (in Russian).
    1. Cheboksarov NN, Trofimova TA. 1941. Anthropological survey of Mansi. Short Reports of Institute of History of Material Culture 9: 28–36.

Substances