. 2017 Mar;31(3):1067-1084.
doi: 10.1096/fj.201600918R. Epub 2016 Dec 13.

Superficial cells are self-renewing chondrocyte progenitors, which form the articular cartilage in juvenile mice

Affiliations

Superficial cells are self-renewing chondrocyte progenitors, which form the articular cartilage in juvenile mice

Lei Li et al. FASEB J. 2017 Mar.

Abstract

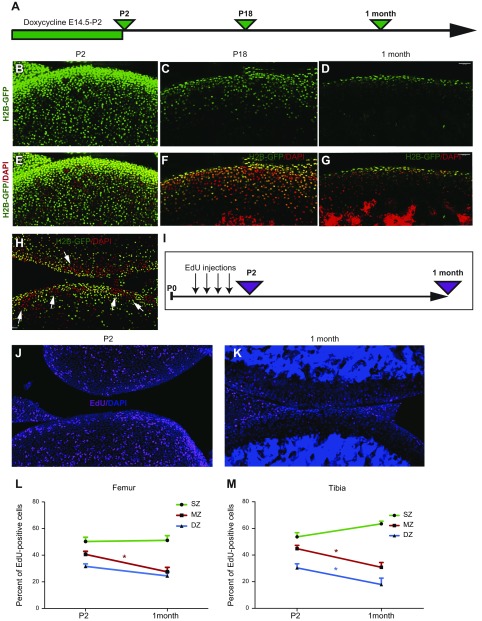
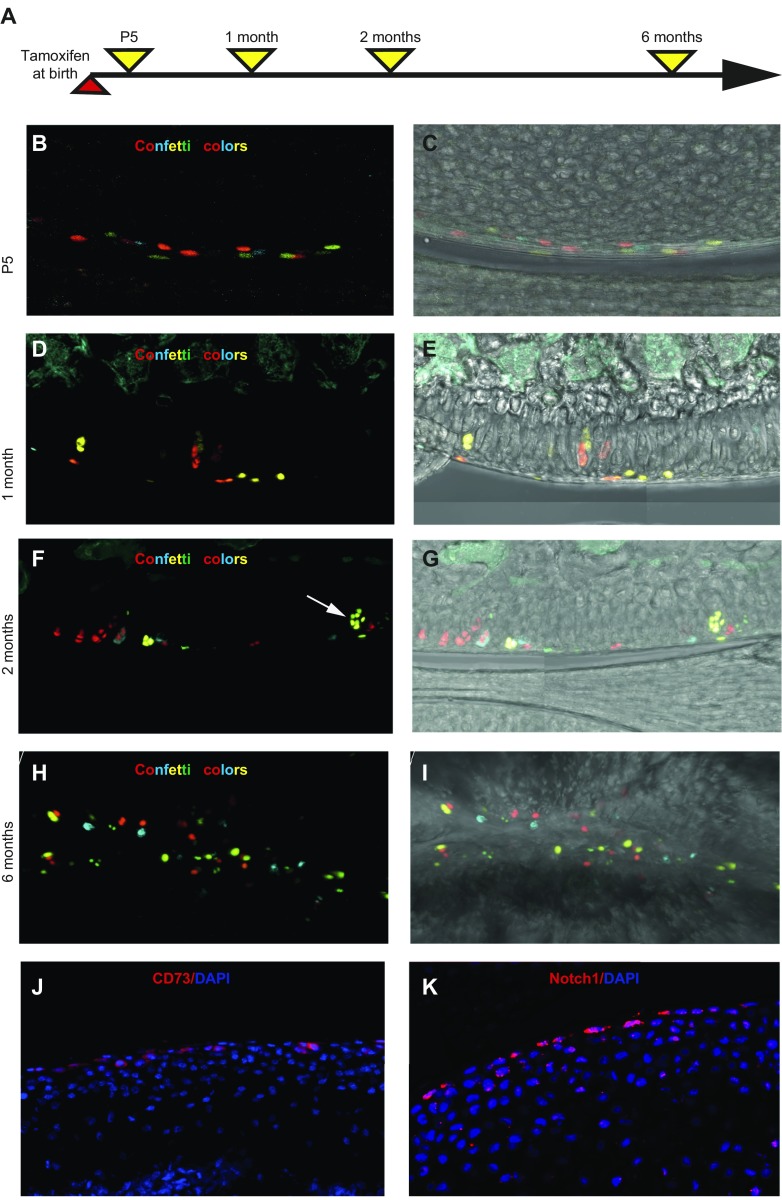
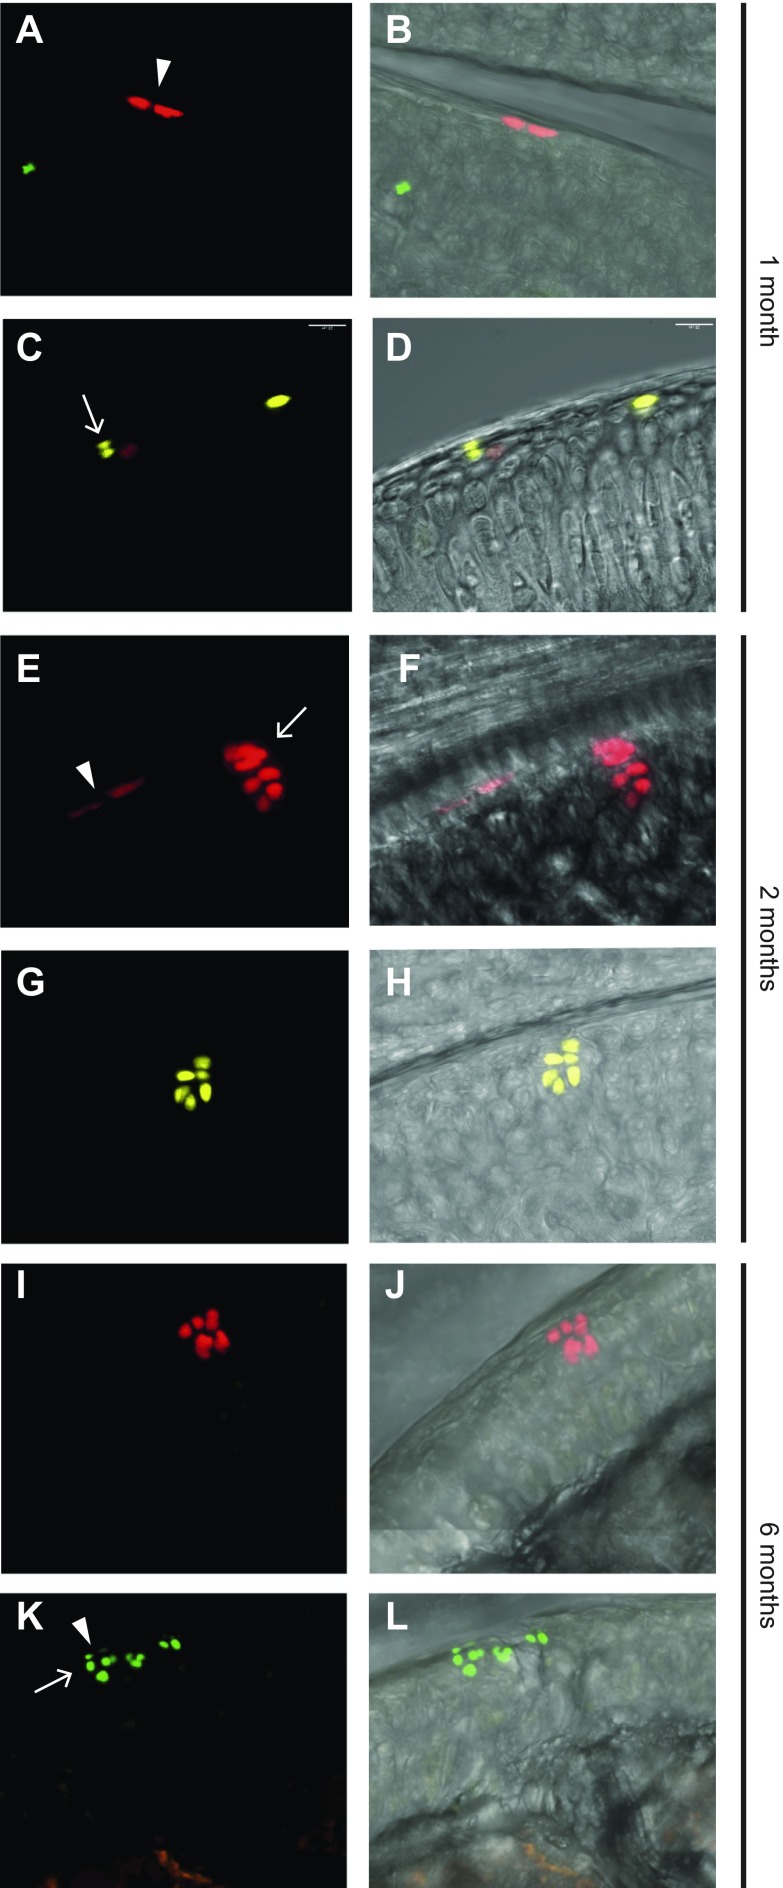
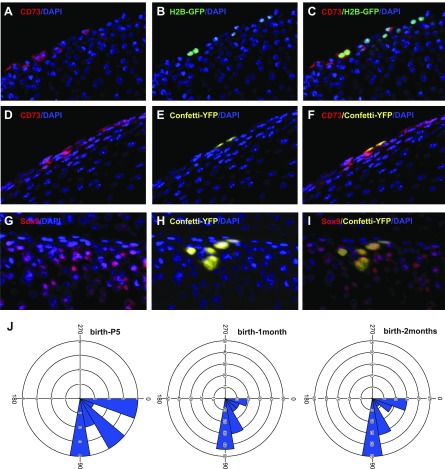
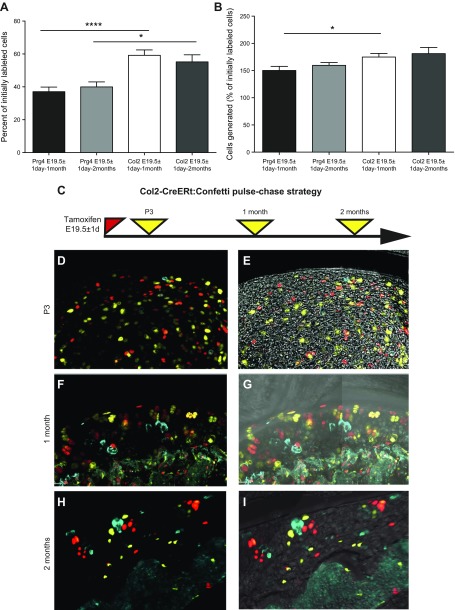
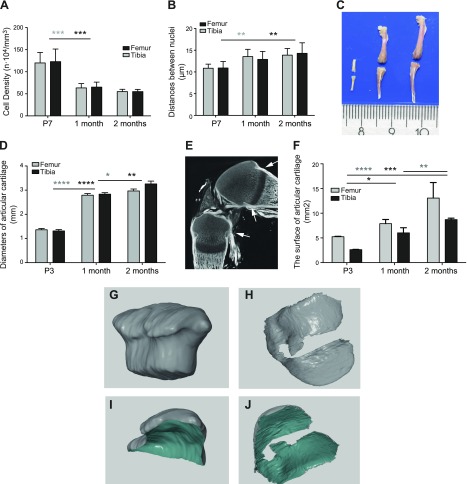
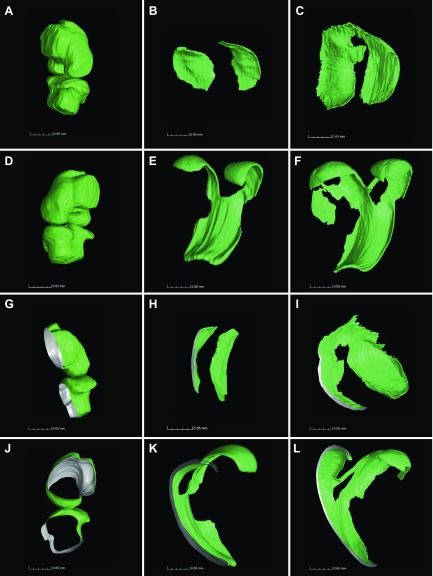
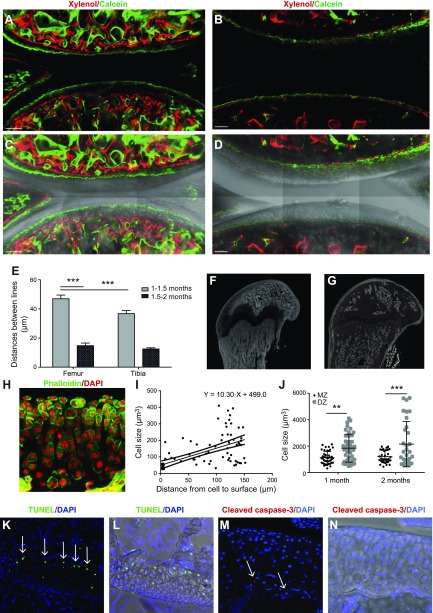
Articular cartilage has little regenerative capacity. Recently, genetic lineage tracing experiments have revealed chondrocyte progenitors at the articular surface. We further characterized these progenitors by using in vivo genetic approaches. Histone H2B-green fluorescent protein retention revealed that superficial cells divide more slowly than underlying articular chondrocytes. Clonal genetic tracing combined with immunohistochemistry revealed that superficial cells renew their number by symmetric division, express mesenchymal stem cell markers, and generate chondrocytes via both asymmetric and symmetric differentiation. Quantitative analysis of cellular kinetics, in combination with phosphotungstic acid-enhanced micro-computed tomography, showed that superficial cells generate chondrocytes and contribute to the growth and reshaping of articular cartilage. Furthermore, we found that cartilage renewal occurs as the progeny of superficial cells fully replace fetal chondrocytes during early postnatal life. Thus, superficial cells are self-renewing progenitors that are capable of maintaining their own population and fulfilling criteria of unipotent adult stem cells. Furthermore, the progeny of these cells reconstitute adult articular cartilage de novo, entirely substituting fetal chondrocytes.-Li, L., Newton, P. T., Bouderlique, T., Sejnohova, M., Zikmund, T., Kozhemyakina, E., Xie, M., Krivanek, J., Kaiser, J., Qian, H., Dyachuk, V., Lassar, A. B., Warman, M. L., Barenius, B., Adameyko, I., Chagin, A. S. Superficial cells are self-renewing chondrocyte progenitors, which form the articular cartilage in juvenile mice.

Keywords: adult stem cells; bone; osteoarthritis; regeneration; superficial zone.


Figures

Figure 1.
Figure 1.
Superficial cells are slow-dividing cells. A) H2B-GFP mice were exposed to doxycycline from E14.5 to P2 and were harvested at P2, P18, and age 1 mo. BG) The majority of cells were GFP-labeled after exposure to doxycycline (green cells; B, E). The number of labeled cells was reduced markedly after 16 d of chasing (C, F) and only superficial cells still expressed GFP after 1 mo of chasing (D, G). Images in panels EG correspond to those in panels BD, but with DAPI (red) channel added. Sample preparation, DAPI staining, laser power, and settings used for confocal scans were similar in BG. H) To visualize residual GFP, laser power was increased twice compared with that in panel F. Clusters of high (red, arrows) and low (green) proliferative activity could be observed in P18 H2B-GFP mice. I) Between P0 and P2, mice were injected 4 times with EdU, and their bones were collected either on P2 or at age 1 mo. J, K) On P2, many cells throughout the entire articular cartilage were labeled with EdU (J; pink; nuclei were stained with DAPI, blue), whereas only a few cells retained EdU 1 mo later (K). L, M) Quantitative analysis revealed that superficial cells in both the femur (L) and tibia (M) retain EdU, whereas underlying chondrocytes lose this signal. DZ, deep zone; MZ, middle zone; SZ, superficial zone. Values are presented as means ± sem; n = 9. *P < 0.05.
Figure 2.
Figure 2.
Superficial cells are chondrocyte progenitors. A) PrgCreER(T2):Confetti mice were injected with tamoxifen at birth and analyzed at different timepoints. BI) At P5, labeled confetti cells (red, yellow, cyan, and, occasionally, green) were observed in the superficial zone of articular cartilage (B, C), whereas labeled chondrocytes were seen clearly 1 (D, E), 2 (F, G), and 6 mo (H, I) after labeling. Large clonal clusters of labeled chondrocytes (arrow in panel F) could occasionally be observed. Images in panels C, E, G, I correspond to those in panels B, D, F, H but with the white light channel added. J, K) Expression of mesenchymal stem cell marker CD73 (J) and Notch1 (K) was observed in superficial chondrocytes. Samples are from 1-mo-old (J) and 5-d-old (K) mice, respectively.
Figure 3.
Figure 3.
Cell division in the superficial zone has different orientation. Prg4-traced cells either divided parallel to and then remained at the superficial surface (A, E, K, arrowheads) or divided perpendicularly to this surface (C, E, K, arrows). Clusters of chondrocytes generated from superficial cells can be seen at the cartilage surface together with (E, K) or separated from (G, I) progenitor cells. 3D confocal scans of 150-μm–thick sections were performed to examine the spatial relationship between clusters and the superficial cells above. Images in panels B, D, F, H, J, and L correspond to those in panels A, C, E, G, I, and K but with the white light channel added. Samples for panels AD were collected at age 1 mo, those for panels EH were collected at age 2 mo, and those for panels IL were collected at age 6 mo.
Figure 4.
Figure 4.
Superficial cells divide symmetrically and asymmetrically. AC) H2B-GFP–retained cells (labeled as depicted in Fig. 1A and analyzed at age 1 mo) divided parallel to the cartilage surface and expressed CD73 stem cells marker. DF) Confetti clone divided parallel to the cartilage surface and expressed CD73 stem cell marker. GI) Confetti clone divided perpendicular to the cartilage surface and acquired expression of chondrogenic marker Sox9. Double-colored arrowheads in panels C, F, and I showed double-labeled cells and yellow arrowheads in panels G, H, and I show confetti-labeled cell without Sox9 expression. Ab-detected signal, red; signal from a single confetti channel, yellow; H2B-GFP signal, green; DAPI, blue. J) Spatially separated doublets of the same color revealed the orientation of cell division was predominantly perpendicular to the cartilage surface. A straight line was drawn through every separated doublet of one color, and angle of cell division parallel to the surface was designated as 0° and perpendicular as 90°, whereas angles between 90° and 180° were equalized to the corresponding angles between 0° and 90°. A low dose of tamoxifen was administrated to achieve rare recombination events that were spatially separated, and 3D confocal scans of 150-μm–thick sections were analyzed with Imaris software; 253, 133, and 29 doublets were analyzed for mice age 2 and 1 mo and 5 d, respectively; 10 mice were analyzed for every timepoint.
Figure 5.
Figure 5.
Assessment of proliferative activity of chondrocytes and superficial cells by clonal tracing. Every single-labeled cell after tracing period indicated was considered as quiescent, and every spatially separated clone that contained cells of the same color counted as initially labeled single progenitor. Thus, the sum of these two gives the number of cells labeled initially. A) The proportion of cells that had proliferated in Prg4-CreER(T2):Confetti mice and Col2-CreERt:Confetti animals traced for 1 or 2 mo was calculated by dividing the number of clones by the number of cells labeled initially. B) Overall increase in cell number was calculated as the total number of labeled cells divided by the number of cells labeled initially. A low degree of recombination (to avoid clonal overlap) was achieved by injecting a smaller amount of tamoxifen. 3D confocal scans of 150-μm–thick sections were analyzed. C) Strategy for labeling Col2-CreER(T):Confetti mice. DI) Col2-CreER(T)–labeled chondrocytes throughout the articular cartilage, with occasional labeling of superficial cells (D, E). Representative images showing chondrocytes labeled around birth and analyzed 3 d (D, E), 1 mo (F, G), or 2 mo later (H, I; maximum intensity projection shown). On P3, single-labeled cells and clonal doublets were only observed, whereas at 1- and 2-mo timepoints, triplets and quadruplets could be observed. Values are presented as means ± sem; n = 9 mice for every point (A, B). *P < 0.05; ***P < 0.001.
Figure 6.
Figure 6.
Growth and reshaping of mouse articular cartilage. A, B) 3D confocal analysis of nuclear density (A) and of the distance between adjusted nuclei (B) was performed on 150-μm sections stained with DAPI by using Imaris software. C, D) Representative images of the femur and tibia at age 3 d and 1 and 2 mo (C) and the corresponding epiphyseal diameters measured (D). E) Micro-CT with phosphotungstic acid contrasting allowed visualization of soft tissues, such as cartilage, tendon, and all connective tissues, as shown for the 3-d-old knee joint. Arrows show the Ranvier grove delineating the cartilage surface for determination of the surface area at age 3 d. F) Manual segmentation of these scans allowed quantitative analysis of the area of the cartilage surface. GJ) Segmented cartilage was measured employing GOM Inspect 8.0 software as exemplified for 3-d-old knee cartilage (G, I) and 1-mo-old (H, J) tibial cartilage. The gray color depicts the outer and green the inner surface of articular cartilage. Values are presented as means ± sd; n = 9 (A, B, D, F) *P < 0.05; **P < 0.01; ***P < 0.001; ****P < 0.0001, as analyzed by one-way ANOVA.
Figure 7.
Figure 7.
Visualization of cartilage shape revealed substantial flattening and reshaping in ontogenesis. Cartilage was reconstructed employing VG Studio Max 2.2 software for 3-d-old mouse knee cartilage (A, D, G, J), 1-mo-old tibia (B, H), and 1-mo-old femur (E, K), as well as 2-mo-old tibia (C, I) and femur (F, L). Panels A and D represent different projections of the same joint, GL cross-sections of CT scans (gray color, section plan), J shows middle sagittal slice of 3-d-old knee, and AF are the same magnitudes, as well as GL.
Figure 8.
Figure 8.
The contribution of articular cartilage to the growth of underlying bone. AD) Growth of epiphyseal bone, which underlies articular cartilage, was measured by double calcein–xylenol labeling at time periods of age 1–1.5 mo (A, C) and 1.5–2 mo (B, D). Images in panels C and D correspond to those in A and B, but with the white light channel added. E) Quantification of the average distance between green (calcein)- and red (xylenol)-labeled lines depicted in A and B. F, G) Micro-CT scans revealed expansion of epiphyseal bones from age 1–2 mo. HJ) 150-μm-thick sections were stained with phalloidin (green) and DAPI (red), and chondrocyte volume (I, J) was analyzed in 3D confocal scans using Imaris software. Volume of chondrocytes increased with their distance from the superficial zone (I), with extensive variation/clustering in the volume of cells in the deep zone (J). K, M) Cells stained positively for TUNEL (K, arrows) and cleaved caspase-3 (M, arrows) were observed at the chondro-osseous junction between articular cartilage and the underlying epiphyseal bone. Images in panels L and N correspond to those of K and M, respectively, but with the white light channel added. Values are presented as means ± sem; n = 9 (E, I, J). **P < 0.01; ***P < 0.001.
Figure 9.
Figure 9.
Fetal chondrocytes did not remain in postnatal articular cartilage. Fetal chondrocytes of Col2-CreERt:Confetti mice were labeled by tamoxifen injection at E14.5. A, B) Tracing to P4 revealed abundant labeled cells distributed throughout the epiphyseal cartilage (A), including cartilage surface areas (B). C, E) Almost no labeled cells remained in articular cartilage when tracing was prolonged until P19 (images represent the only 2 clones found; pink arrows). D, F) Labeled chondrocytes persisted within the growth plate. GJ) Col2-CreERt:Confetti–labeled cells within epiphyseal bone. Bone and mineralized matrix were visualized by calcein labeling 24 h before sacrifice (G, H). Tracing was done from P6 to P40 (G, H) or from P0 to P30 (I, J). Pink arrowheads point toward chondrocytes at chondro-osseous junction. White arrowheads point toward cells lining bone surface or inside bone. Notice labeled cells in bone area in panels C and D where tracing was from E14.5 to P19. Maximum intensity projections are shown in panels AH and single-plan scans in I and J. Panels E, F, H, and J correspond to C, D, G, and I, but with the white light channel added.

References

    1. Madry H., Luyten F. P., Facchini A. (2012) Biological aspects of early osteoarthritis. Knee Surg. Sports Traumatol. Arthrosc. 20, 407–422 - PubMed
    1. Hall B. K. (2015) Bones and Cartilage: Developmental and Evolutionary Skeletal Biology, 2nd ed., Elsevier, New York
    1. Murray C. J., Vos T., Lozano R., Naghavi M., Flaxman A. D., Michaud C., Ezzati M., Shibuya K., Salomon J. A., Abdalla S., Aboyans V., Abraham J., Ackerman I., Aggarwal R., Ahn S. Y., Ali M. K., Alvarado M., Anderson H. R., Anderson L. M., Andrews K. G., Atkinson C., Baddour L. M., Bahalim A. N., Barker-Collo S., Barrero L. H., Bartels D. H., Basáñez M. G., Baxter A., Bell M. L., Benjamin E. J., Bennett D., Bernabé E., Bhalla K., Bhandari B., Bikbov B., Bin Abdulhak A., Birbeck G., Black J. A., Blencowe H., Blore J. D., Blyth F., Bolliger I., Bonaventure A., Boufous S., Bourne R., Boussinesq M., Braithwaite T., Brayne C., Bridgett L., Brooker S., Brooks P., Brugha T. S., Bryan-Hancock C., Bucello C., Buchbinder R., Buckle G., Budke C. M., Burch M., Burney P., Burstein R., Calabria B., Campbell B., Canter C. E., Carabin H., Carapetis J., Carmona L., Cella C., Charlson F., Chen H., Cheng A. T., Chou D., Chugh S. S., Coffeng L. E., Colan S. D., Colquhoun S., Colson K. E., Condon J., Connor M. D., Cooper L. T., Corriere M., Cortinovis M., de Vaccaro K. C., Couser W., Cowie B. C., Criqui M. H., Cross M., Dabhadkar K. C., Dahiya M., Dahodwala N., Damsere-Derry J., Danaei G., Davis A., De Leo D., Degenhardt L., Dellavalle R., Delossantos A., Denenberg J., Derrett S., Des Jarlais D. C., Dharmaratne S. D., Dherani M., Diaz-Torne C., Dolk H., Dorsey E. R., Driscoll T., Duber H., Ebel B., Edmond K., Elbaz A., Ali S. E., Erskine H., Erwin P. J., Espindola P., Ewoigbokhan S. E., Farzadfar F., Feigin V., Felson D. T., Ferrari A., Ferri C. P., Fèvre E. M., Finucane M. M., Flaxman S., Flood L., Foreman K., Forouzanfar M. H., Fowkes F. G., Fransen M., Freeman M. K., Gabbe B. J., Gabriel S. E., Gakidou E., Ganatra H. A., Garcia B., Gaspari F., Gillum R. F., Gmel G., Gonzalez-Medina D., Gosselin R., Grainger R., Grant B., Groeger J., Guillemin F., Gunnell D., Gupta R., Haagsma J., Hagan H., Halasa Y. A., Hall W., Haring D., Haro J. M., Harrison J. E., Havmoeller R., Hay R. J., Higashi H., Hill C., Hoen B., Hoffman H., Hotez P. J., Hoy D., Huang J. J., Ibeanusi S. E., Jacobsen K. H., James S. L., Jarvis D., Jasrasaria R., Jayaraman S., Johns N., Jonas J. B., Karthikeyan G., Kassebaum N., Kawakami N., Keren A., Khoo J. P., King C. H., Knowlton L. M., Kobusingye O., Koranteng A., Krishnamurthi R., Laden F., Lalloo R., Laslett L. L., Lathlean T., Leasher J. L., Lee Y. Y., Leigh J., Levinson D., Lim S. S., Limb E., Lin J. K., Lipnick M., Lipshultz S. E., Liu W., Loane M., Ohno S. L., Lyons R., Mabweijano J., MacIntyre M. F., Malekzadeh R., Mallinger L., Manivannan S., Marcenes W., March L., Margolis D. J., Marks G. B., Marks R., Matsumori A., Matzopoulos R., Mayosi B. M., McAnulty J. H., McDermott M. M., McGill N., McGrath J., Medina-Mora M. E., Meltzer M., Mensah G. A., Merriman T. R., Meyer A. C., Miglioli V., Miller M., Miller T. R., Mitchell P. B., Mock C., Mocumbi A. O., Moffitt T. E., Mokdad A. A., Monasta L., Montico M., Moradi-Lakeh M., Moran A., Morawska L., Mori R., Murdoch M. E., Mwaniki M. K., Naidoo K., Nair M. N., Naldi L., Narayan K. M., Nelson P. K., Nelson R. G., Nevitt M. C., Newton C. R., Nolte S., Norman P., Norman R., O’Donnell M., O’Hanlon S., Olives C., Omer S. B., Ortblad K., Osborne R., Ozgediz D., Page A., Pahari B., Pandian J. D., Rivero A. P., Patten S. B., Pearce N., Padilla R. P., Perez-Ruiz F., Perico N., Pesudovs K., Phillips D., Phillips M. R., Pierce K., Pion S., Polanczyk G. V., Polinder S., Pope C. A. III, Popova S., Porrini E., Pourmalek F., Prince M., Pullan R. L., Ramaiah K. D., Ranganathan D., Razavi H., Regan M., Rehm J. T., Rein D. B., Remuzzi G., Richardson K., Rivara F. P., Roberts T., Robinson C., De Leòn F. R., Ronfani L., Room R., Rosenfeld L. C., Rushton L., Sacco R. L., Saha S., Sampson U., Sanchez-Riera L., Sanman E., Schwebel D. C., Scott J. G., Segui-Gomez M., Shahraz S., Shepard D. S., Shin H., Shivakoti R., Singh D., Singh G. M., Singh J. A., Singleton J., Sleet D. A., Sliwa K., Smith E., Smith J. L., Stapelberg N. J., Steer A., Steiner T., Stolk W. A., Stovner L. J., Sudfeld C., Syed S., Tamburlini G., Tavakkoli M., Taylor H. R., Taylor J. A., Taylor W. J., Thomas B., Thomson W. M., Thurston G. D., Tleyjeh I. M., Tonelli M., Towbin J. A., Truelsen T., Tsilimbaris M. K., Ubeda C., Undurraga E. A., van der Werf M. J., van Os J., Vavilala M. S., Venketasubramanian N., Wang M., Wang W., Watt K., Weatherall D. J., Weinstock M. A., Weintraub R., Weisskopf M. G., Weissman M. M., White R. A., Whiteford H., Wiebe N., Wiersma S. T., Wilkinson J. D., Williams H. C., Williams S. R., Witt E., Wolfe F., Woolf A. D., Wulf S., Yeh P. H., Zaidi A. K., Zheng Z. J., Zonies D., Lopez A. D., AlMazroa M. A., Memish Z. A. (2012) Disability-adjusted life years (DALYs) for 291 diseases and injuries in 21 regions, 1990-2010: a systematic analysis for the Global Burden of Disease Study 2010. Lancet 380, 2197–2223 - PubMed
    1. Lotz M., Loeser R. F. (2012) Effects of aging on articular cartilage homeostasis. Bone 51, 241–248 - PMC - PubMed
    1. Goldring M. B. (2012) Chondrogenesis, chondrocyte differentiation, and articular cartilage metabolism in health and osteoarthritis. Ther. Adv. Musculoskelet. Dis. 4, 269–285 - PMC - PubMed

Publication types

LinkOut - more resources