. 2017 Feb 3;292(5):1749-1761.
doi: 10.1074/jbc.M116.766790. Epub 2016 Dec 13.

Structure of the Lipid Nanodisc-reconstituted Vacuolar ATPase Proton Channel: DEFINITION OF THE INTERACTION OF ROTOR AND STATOR AND IMPLICATIONS FOR ENZYME REGULATION BY REVERSIBLE DISSOCIATION

Affiliations

Structure of the Lipid Nanodisc-reconstituted Vacuolar ATPase Proton Channel: DEFINITION OF THE INTERACTION OF ROTOR AND STATOR AND IMPLICATIONS FOR ENZYME REGULATION BY REVERSIBLE DISSOCIATION

Nicholas J Stam et al. J Biol Chem. .

Abstract

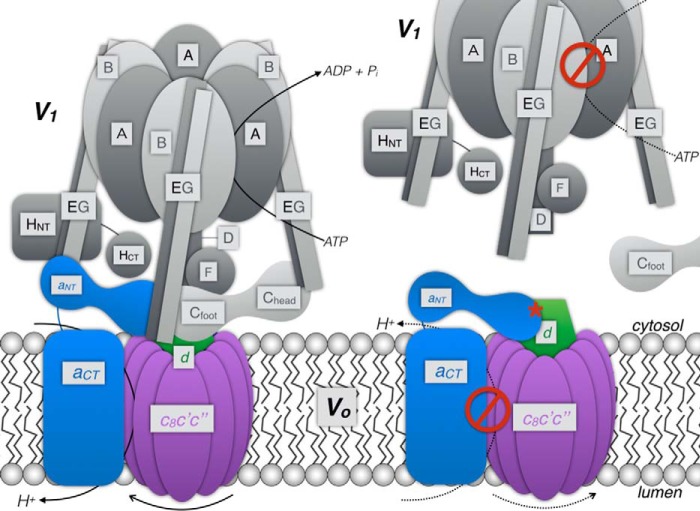
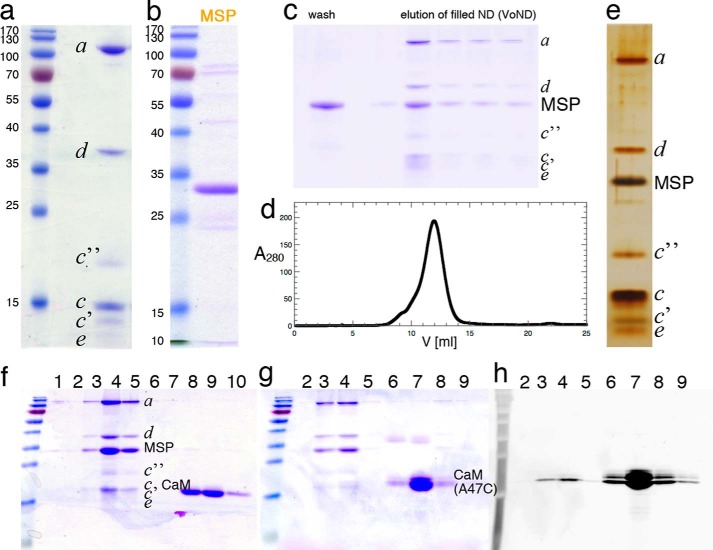
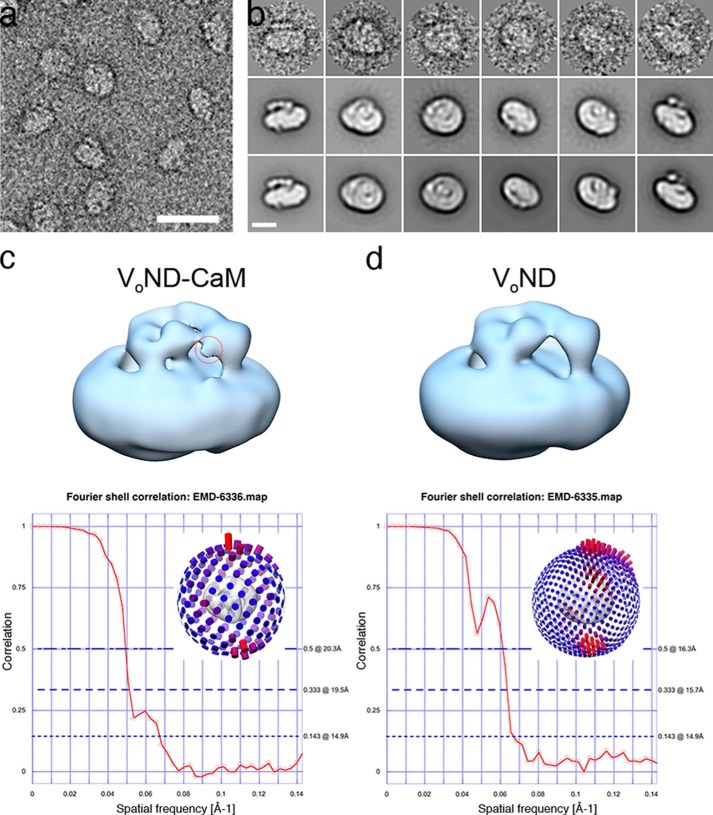
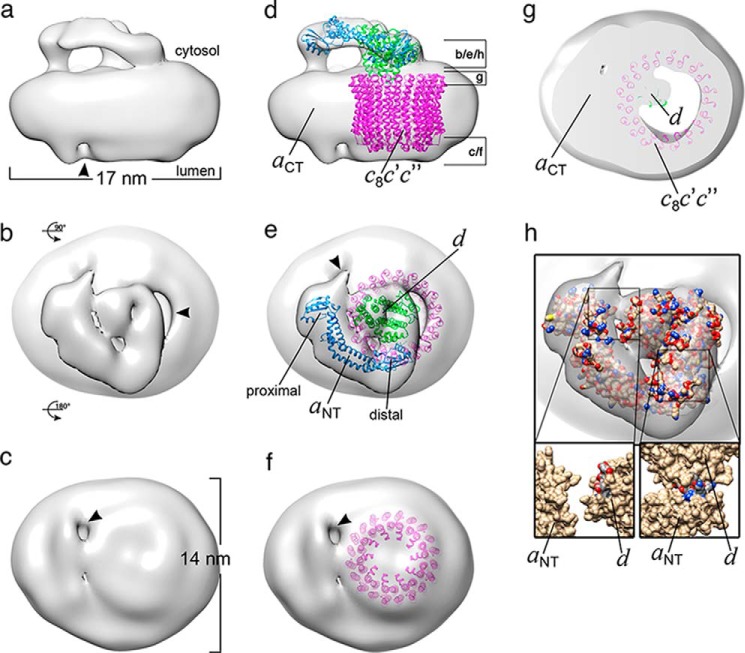
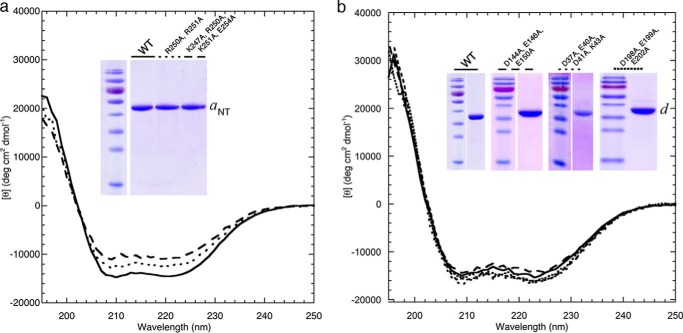
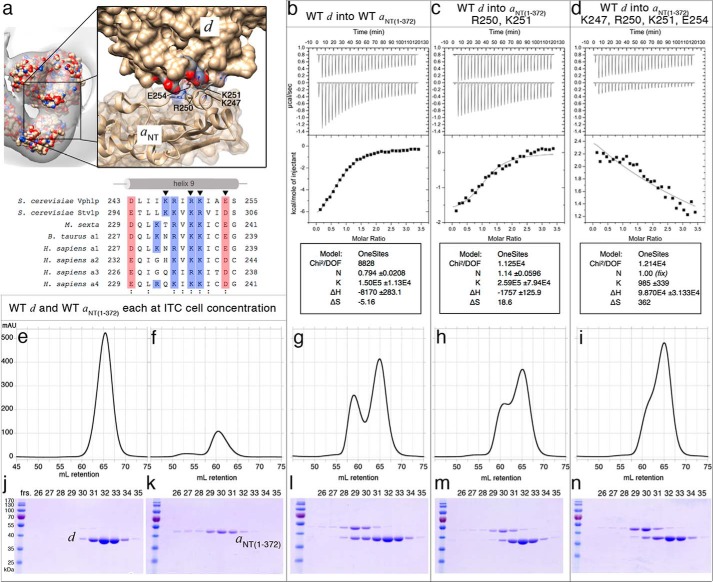
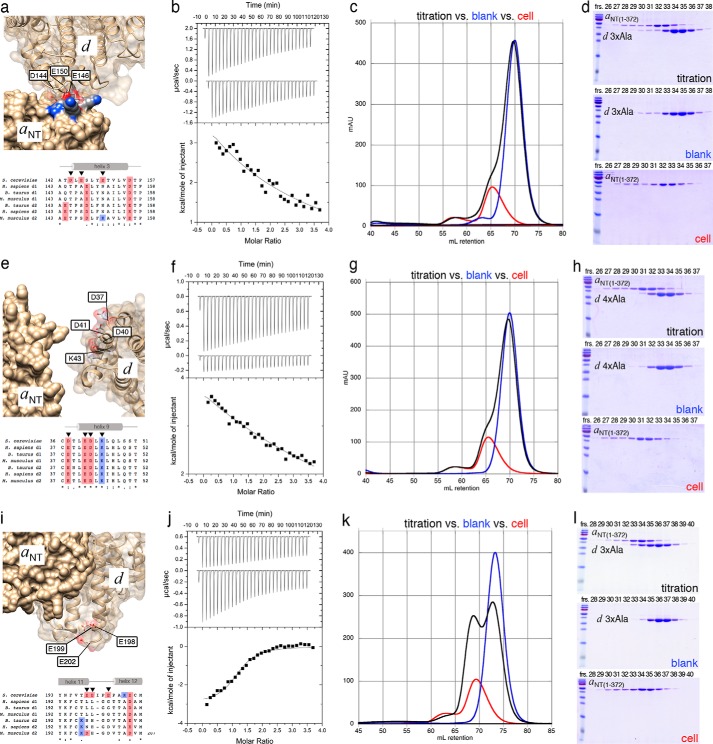
Eukaryotic vacuolar H+-ATPase (V-ATPase) is a multisubunit enzyme complex that acidifies subcellular organelles and the extracellular space. V-ATPase consists of soluble V1-ATPase and membrane-integral Vo proton channel sectors. To investigate the mechanism of V-ATPase regulation by reversible disassembly, we recently determined a cryo-EM reconstruction of yeast Vo The structure indicated that, when V1 is released from Vo, the N-terminal cytoplasmic domain of subunit a (aNT) changes conformation to bind rotor subunit d However, insufficient resolution precluded a precise definition of the aNT-d interface. Here we reconstituted Vo into lipid nanodiscs for single-particle EM. 3D reconstructions calculated at ∼15-Å resolution revealed two sites of contact between aNT and d that are mediated by highly conserved charged residues. Alanine mutagenesis of some of these residues disrupted the aNT-d interaction, as shown by isothermal titration calorimetry and gel filtration of recombinant subunits. A recent cryo-EM study of holo V-ATPase revealed three major conformations corresponding to three rotational states of the central rotor of the enzyme. Comparison of the three V-ATPase conformations with the structure of nanodisc-bound Vo revealed that Vo is halted in rotational state 3. Combined with our prior work that showed autoinhibited V1-ATPase to be arrested in state 2, we propose a model in which the conformational mismatch between free V1 and Vo functions to prevent unintended reassembly of holo V-ATPase when activity is not needed.

Keywords: EM; Vo proton channel; isothermal titration calorimetry (ITC); lipid nanodisc; protein structure; proton transport; vacuolar ATPase.


Conflict of interest statement

The authors declare that they have no conflicts of interest with the contents of this article

Figures

FIGURE 1.
FIGURE 1.
Schematic of V-ATPase architecture and the mechanism of regulation by reversible disassembly. V1 is represented by subunits shaded in gray. Subunits of Vo are shown in blue (a), purple (c-ring composed of c8c'c″), and green (d). ATP hydrolysis in V1 drives rotation of the c-ring, resulting in proton translocation across the interface of the c-ring and aCT. Upon reversible disassembly, subunit C is released into the cytoplasm, and the interactions between subunits of V1 (DF and EG1–3) and Vo (aNT, d) are broken. Disassembly of the enzyme results in a V1 that does not hydrolyze MgATP and a Vo that does not support passive proton translocation. Note that, upon release of V1 from the membrane, aNT changes conformation to bind the central rotor subunit d (red asterisk) as reported previously (38).
FIGURE 2.
FIGURE 2.
Purification of Vo and reconstitution into lipid nanodiscs. a, SDS-PAGE of yeast Vo affinity-purified from solubilized yeast microsomal membranes via a calmodulin binding peptide fused to the C terminus of subunit a. b, SDS-PAGE of the membrane scaffold protein MSP1E3D1, purified by affinity chromatography via an N-terminal His6 tag. c, SDS-PAGE of flow-through and elution fractions from the calmodulin column after nanodisc reconstitution to remove unfilled discs. Reconstitution of the Vo into lipid nanodiscs is accomplished by mixing Vo, MSP, and lipid. Upon removal of detergent, Vo self-assembles into a nanodisc bilayer patch. d, size exclusion chromatography of VoND after removal of unfilled discs. e, SDS-PAGE of the final preparation after gel filtration. f, glycerol gradient of VoND-CaM. VoND was mixed with a 5-fold excess of calmodulin, and the mixture was applied to a discontinuous 15–35% glycerol gradient and centrifuged at 200,000 × g for 16 h at 4 °C. Fractions were collected from the bottom of the gradient and analyzed by SDS-PAGE. Peak fractions (4, 5) were pooled and used for negative stain electron microscopy. g and h, to verify binding of calmodulin to VoND, calmodulin (A47C) was labeled with fluorescein maleimide and the mixture of VoND, and labeled calmodulin was subjected to glycerol density centrifugation as in f. h, the fluorescence scan of the gel shown in g indicates co-migration of labeled calmodulin with VoND. The gels in a–c, f, and g were stained with Coomassie blue; the gel in e was stained with silver.
FIGURE 3.
FIGURE 3.
Negative stain transmission electron microscopy of VoND-CaM. a, the representative micrograph reveals a monodisperse sample of ∼12-nm particles. b, class averages obtained by reference-free alignment of a dataset of ∼40,000 VoND-CaM projections (center row) with corresponding raw particle images (top row) and reprojections of the final VoND-CaM reconstruction (bottom row). c and d, final 3D reconstructions of VoND-CaM (c) and VoND (d) with corresponding gold standard FSC graphs shown below the models. The red circle on the VoND-CaM reconstruction indicates the density for calmodulin bound to the C terminus of subunit a. Insets in the FSC graphs illustrate the angular distributions of the particle orientations of the two datasets. Scale bars = 20 nm (a) and 10 nm (b).
FIGURE 4.
FIGURE 4.
3D reconstruction of VoND-CaM. a–c, side (a), top (b), and bottom (b) views of the 3D model of VoND-CaM. The membrane sector is ∼17 × 14 nm (a and c) with density on the cytosolic side above the membrane (aNT and subunit d) and a cleft on the lumenal side (arrowhead in a). d–f, fit of homology models of Vo subunits into the EM density: aNT (threaded into the crystal structure of M. ruber INT, PDB code 3RRK) in cyan, subunit d (threaded into the crystal structure of T. thermophilus C, PDB code 1V9M) in green, and E. hirae K10 (PDB code 2BL2) in magenta. g, cross-section as indicated in d, showing that the density representing the N-terminal α helix of subunit d contacts only one side of the c-ring as seen in state 3 of holo V1Vo (22). h, top view of VoND-CaM fitted with atomic models to indicate the sites of contact between aNT and subunit d. Note that, because of its pseudo-3-fold symmetry, the homology model of subunit d could be placed into the EM density in three orientations corresponding to the orientations as described for states 1–3 (22), with orientations 2 and 3 resulting in much better model-map correlations compared with orientation 1. The model (Phyre model of yeast “d”) to map (VoND-CaM; EMD-6336) correlations for the three orientations were 0.081 for state 3, 0.085 for state 2, and 0.076 for state 1, with 404, 296, and 323 amino acids outside of the model at a contour level of 0.022 for states 1–3, respectively.
FIGURE 5.
FIGURE 5.
Purification and circular dichroism spectroscopy of recombinant wild-type and mutant aNT(1–372) and subunit d. a, Coomassie-stained SDS-PAGE and CD spectroscopy of the wild type and mutant aNT(1–372) constructs expressed and purified as described under “Experimental Procedures.” b, SDS-PAGE and CD spectra of the wild type and mutant subunit d. The two minima at ∼208 and 222 nm in the CD spectra of both the wild type and mutant aNT(1–372) and subunit d constructs indicate α-helical secondary structure. CD wavelength scans were collected from 250–195 nm in 25 mm sodium phosphate (pH 7) at 10 °C (0.1 mm TCEP was included in the buffer for the subunit d scans). SDS-PAGE gels were loaded with ∼3 μg of the wild type or mutant subunits.
FIGURE 6.
FIGURE 6.
Isothermal titration calorimetry of the interaction between subunit d and wild-type and mutant aNT(1–372). a, top panel, detailed view of the aNT/d contact as shown in Fig. 4h, bottom right, indicating that the distal lobe of aNT appears to be participating in an interaction with subunit d via a short charged α helix in aNT to a largely acidic face of subunit d. a, bottom panel, the four residues of the short α helix facing subunit d are Lys-247, Arg-250, Lys-251, and Glu-254, which belong to a patch of charged residues mostly conserved through higher eukaryotes, as shown by the sequence alignment of helix 9 of subunit a. b–d, isothermal titration calorimetry of subunit d and aNT(1–372) constructs (representative titrations of two repeats). Titration of subunit d into wild-type aNT(1–372) (b), aNT(1–372) (R250A,K251A) (c), and aNT(1–372) (K247A,R250A,K251A,E254A) (d). e–i, subunit d and aNT(1–372) alone as well as the cell contents of the completed titrations were subjected to size exclusion chromatography on Superdex 200 (16 × 500 mm) with the corresponding SDS-PAGE gels shown in j–n. For details, see text.
FIGURE 7.
FIGURE 7.
Isothermal titration calorimetry of the interaction between wild-type aNT(1–372) and mutant subunit d. a and e, close-up of the contact between d and the aNT distal (a) and proximal (e) lobe. b–d, ITC (b), gel filtration (c), and SDS-PAGE (d) of the d triple mutant (D144A,E146A,E150A) with aNT(1–372). f–h, ITC (f), gel filtration (g), and SDS-PAGE (h) of the d quadruple mutant (D37A,E40A,D41A,K43A) with aNT(1–372). i–l, as a negative control, a subunit d mutant with acidic residues (Glu-198, Glu-199, and Glu-202) outside of the predicted interface with aNT changed to alanines was titrated with wild-type aNT(1–372). Fitting the data revealed a Ka of ∼4 ×10⁵ ± 8 × 10⁴ M (Kd ∼ 2.5 μm; N ∼ 1.2; ΔH = −12.4 ± 0.49 kJ/mol; ΔS ∼ 63 J·(mol·K)−1). Shown are representative ITC titrations of at least two repeats for each mutant. Note that the gel filtration column was repacked after the experiments in Fig. 6, resulting in a slightly different elution volume for the recombinant subunits for the two sets of titrations shown in Figs. 6 and 7.

Similar articles

Cited by

References

    1. Forgac M. (2007) Vacuolar ATPases: rotary proton pumps in physiology and pathophysiology. Nat. Rev. Mol. Cell Biol. 8, 917–929 - PubMed
    1. Kane P. M. (2006) The where, when, and how of organelle acidification by the yeast vacuolar H+-ATPase. Microbiol. Mol. Biol. Rev. 70, 177–191 - PMC - PubMed
    1. Marshansky V., and Futai M. (2008) The V-type H+-ATPase in vesicular trafficking: targeting, regulation and function. Curr. Opin. Cell Biol. 20, 415–426 - PMC - PubMed
    1. Graham L. A., Flannery A. R., and Stevens T. H. (2003) Structure and assembly of the yeast V-ATPase. J. Bioenerg. Biomembr. 35, 301–312 - PubMed
    1. Zoncu R., Bar-Peled L., Efeyan A., Wang S., Sancak Y., and Sabatini D. M. (2011) mTORC1 senses lysosomal amino acids through an inside-out mechanism that requires the vacuolar H+-ATPase. Science 334, 678–683 - PMC - PubMed

MeSH terms

Substances