

Signal transducer and activator of transcription 3 (Stat3) regulates host defense and protects mice against herpes simplex virus-1 (HSV-1) infection
- PMID: 27965384
- PMCID: PMC5346178
- DOI: 10.1189/jlb.4A1016-199RR
Signal transducer and activator of transcription 3 (Stat3) regulates host defense and protects mice against herpes simplex virus-1 (HSV-1) infection
Abstract
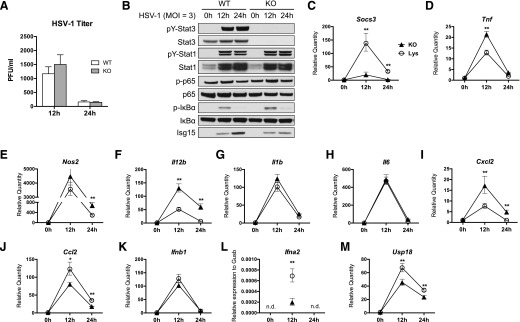
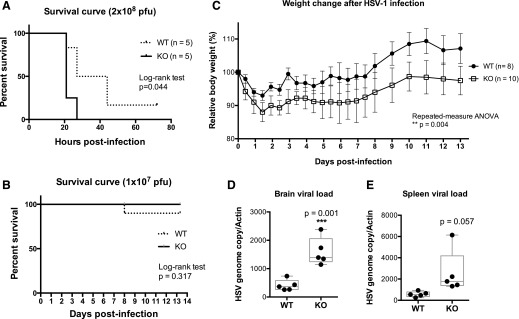
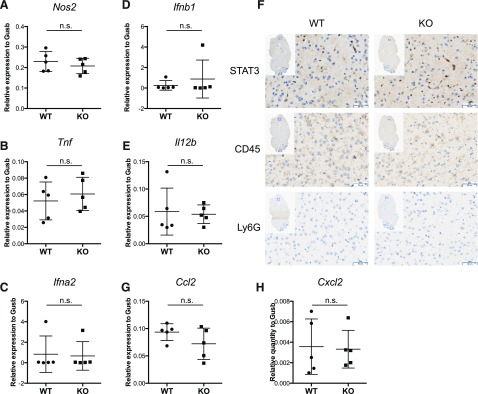
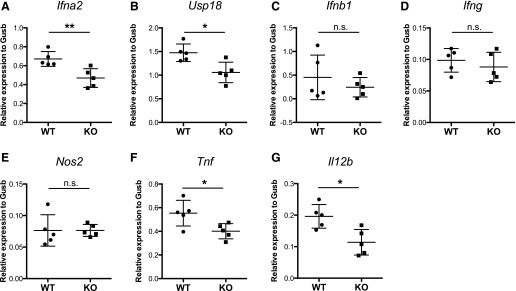
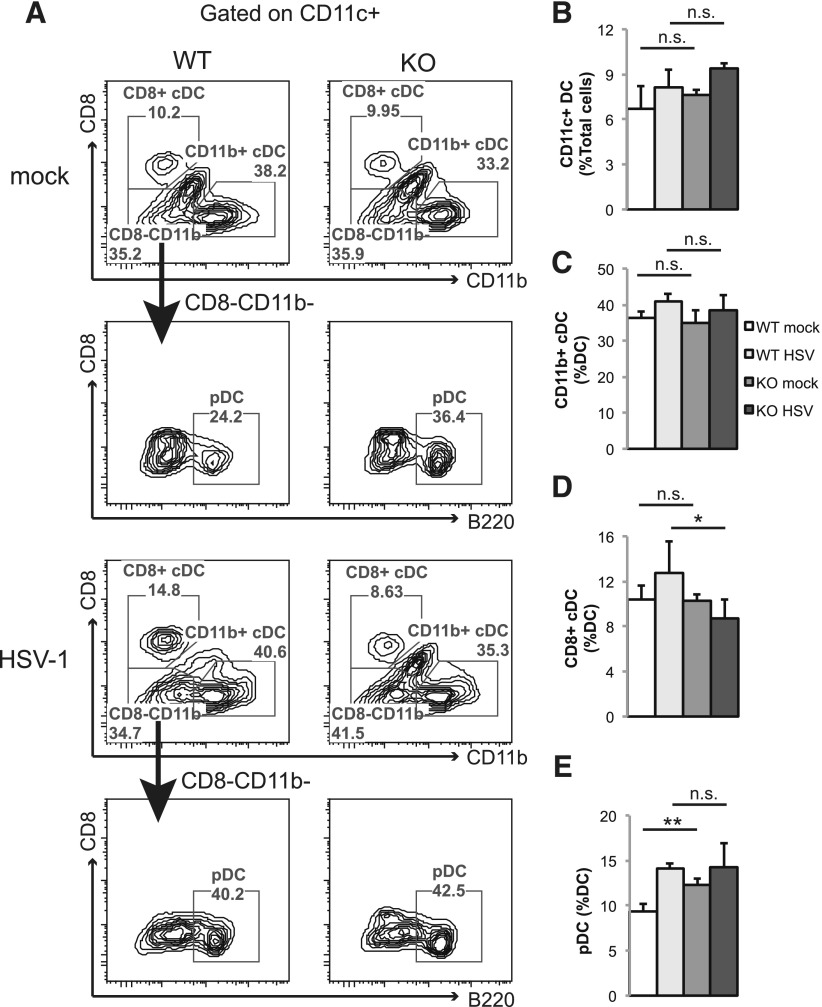
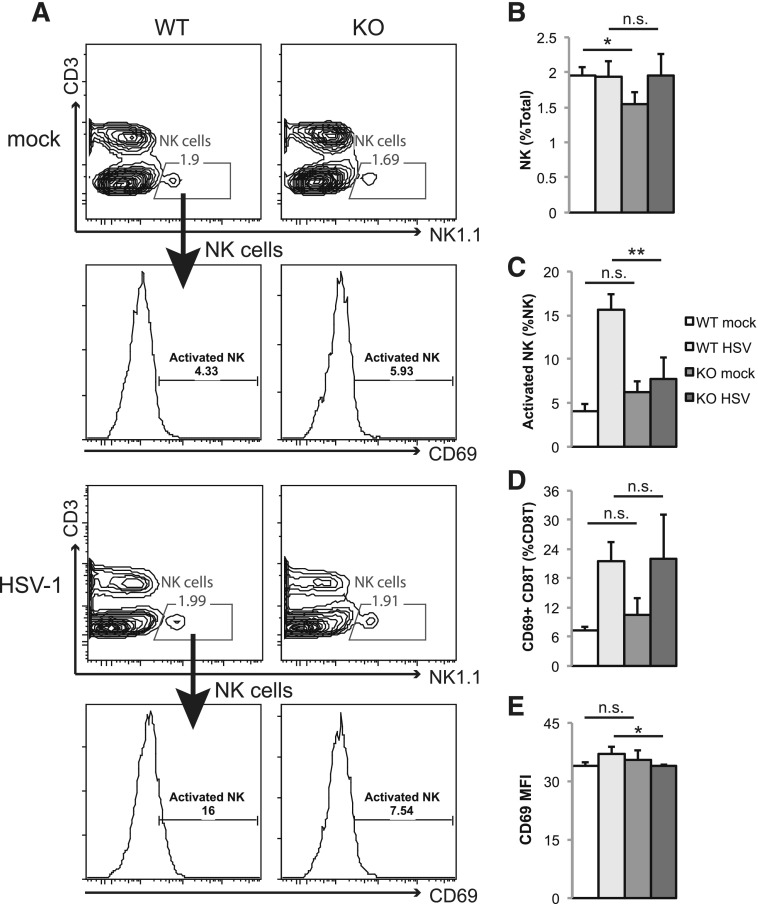
Signal transducer and activator of transcription 3 (STAT3) mediates cellular responses to multiple cytokines, governs gene expression, and regulates the development and activation of immune cells. STAT3 also modulates reactivation of latent herpes simplex virus-1 (HSV-1) in ganglia. However, it is unclear how STAT3 regulates the innate immune response during the early phase of HSV-1 lytic infection. Many cell types critical for the innate immunity are derived from the myeloid lineage. Therefore, in this study, we used myeloid-specific Stat3 knockout mice to investigate the role of STAT3 in the innate immune response against HSV-1. Our results demonstrate that Stat3 knockout bone marrow-derived macrophages (BMMs) expressed decreased levels of interferon-α (IFN-α) and interferon-stimulated genes (ISGs) upon HSV-1 infection. In vivo, knockout mice were more susceptible to HSV-1, as marked by higher viral loads and more significant weight loss. Splenic expression of IFN-α and ISGs was reduced in the absence of STAT3, indicating that STAT3 is required for optimal type I interferon response to HSV-1. Expression of TNF-α and IL-12, cytokines that have been shown to limit HSV-1 replication and pathogenesis, was also significantly lower in knockout mice. Interestingly, Stat3 knockout mice failed to expand the CD8+ conventional DC (cDC) population upon HSV-1 infection, and this was accompanied by impaired NK and CD8 T cell activation. Collectively, our data demonstrate that myeloid-specific Stat3 deletion causes defects in multiple aspects of the immune system and that STAT3 has a protective role at the early stage of systemic HSV-1 infection.
Keywords: dendritic cells; innate immunity; natural killer cells; type I interferons; viral infection.
© Society for Leukocyte Biology.
Figures
Similar articles
-
Immune- and Nonimmune-Compartment-Specific Interferon Responses Are Critical Determinants of Herpes Simplex Virus-Induced Generalized Infections and Acute Liver Failure.J Virol. 2016 Nov 14;90(23):10789-10799. doi: 10.1128/JVI.01473-16. Print 2016 Dec 1. J Virol. 2016. PMID: 27681121 Free PMC article.
-
Interleukin-12- and gamma interferon-dependent innate immunity are essential and sufficient for long-term survival of passively immunized mice infected with herpes simplex virus type 1.J Virol. 2001 Oct;75(20):9596-600. doi: 10.1128/JVI.75.20.9596-9600.2001. J Virol. 2001. PMID: 11559791 Free PMC article.
-
The virion host shutoff protein of herpes simplex virus 1 blocks the replication-independent activation of NF-κB in dendritic cells in the absence of type I interferon signaling.J Virol. 2011 Dec;85(23):12662-72. doi: 10.1128/JVI.05557-11. Epub 2011 Sep 21. J Virol. 2011. PMID: 21937652 Free PMC article.
-
Herpes Simplex Virus Type 1 Interactions with the Interferon System.Int J Mol Sci. 2020 Jul 21;21(14):5150. doi: 10.3390/ijms21145150. Int J Mol Sci. 2020. PMID: 32708188 Free PMC article. Review.
-
Evasion of host antiviral innate immunity by HSV-1, an update.Virol J. 2016 Mar 8;13:38. doi: 10.1186/s12985-016-0495-5. Virol J. 2016. PMID: 26952111 Free PMC article. Review.
Cited by
-
STAT3 roles in viral infection: antiviral or proviral?Future Virol. 2018 Aug;13(8):557-574. doi: 10.2217/fvl-2018-0033. Epub 2018 Jul 2. Future Virol. 2018. PMID: 32201498 Free PMC article. Review.
-
Antagonism of STAT3 signalling by Ebola virus.PLoS Pathog. 2021 Jun 24;17(6):e1009636. doi: 10.1371/journal.ppat.1009636. eCollection 2021 Jun. PLoS Pathog. 2021. PMID: 34166464 Free PMC article.
-
Identifying transcription factors associated with Fusarium graminearum virus 2 accumulation in Fusarium graminearum by phenome-based investigation.Virus Res. 2023 Mar;326:199061. doi: 10.1016/j.virusres.2023.199061. Epub 2023 Feb 8. Virus Res. 2023. PMID: 36738934 Free PMC article.
-
Interplay between Janus Kinase/Signal Transducer and Activator of Transcription Signaling Activated by Type I Interferons and Viral Antagonism.Front Immunol. 2017 Dec 11;8:1758. doi: 10.3389/fimmu.2017.01758. eCollection 2017. Front Immunol. 2017. PMID: 29312301 Free PMC article. Review.
-
STAT3 Increases CVB3 Replication and Acute Pancreatitis and Myocarditis Pathology via Impeding Nuclear Translocation of STAT1 and Interferon-Stimulated Gene Expression.Int J Mol Sci. 2024 Aug 19;25(16):9007. doi: 10.3390/ijms25169007. Int J Mol Sci. 2024. PMID: 39201692 Free PMC article.
References
-
- Whitley R. J., Roizman B. (2001) Herpes simplex virus infections. Lancet 357, 1513–1518. - PubMed
-
- Zuckerman R. A. (2009) The clinical spectrum of herpes simplex viremia. Clin. Infect. Dis. 49, 1302–1304. - PubMed
-
- Youssef R., Shaker O., Sobeih S., Mashaly H., Mostafa W. Z. (2002) Detection of herpes simplex virus DNA in serum and oral secretions during acute recurrent herpes labialis. J. Dermatol. 29, 404–410. - PubMed
-
- Howie S., Norval M., Maingay J., McBride W. H. (1986) Interactions between herpes simplex virus and murine bone marrow macrophages. Arch. Virol. 87, 229–239. - PubMed
Publication types
MeSH terms
Substances
Grants and funding
LinkOut - more resources
Full Text Sources
Other Literature Sources
Medical
Molecular Biology Databases
Research Materials
Miscellaneous
