. 2016 Dec 27;113(52):15144-15149.
doi: 10.1073/pnas.1619159114. Epub 2016 Dec 13.

PMS1T, producing phased small-interfering RNAs, regulates photoperiod-sensitive male sterility in rice

Affiliations

PMS1T, producing phased small-interfering RNAs, regulates photoperiod-sensitive male sterility in rice

Yourong Fan et al. Proc Natl Acad Sci U S A. .

Abstract

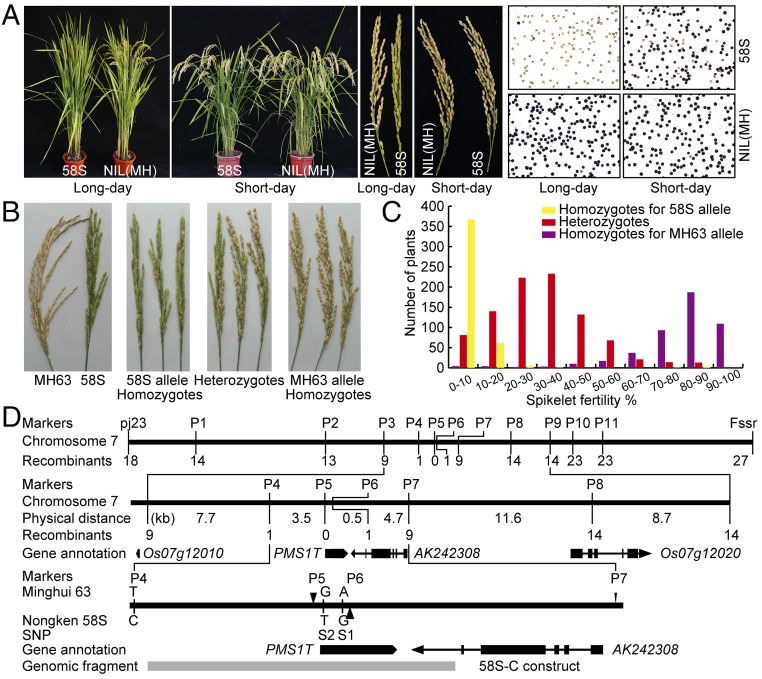
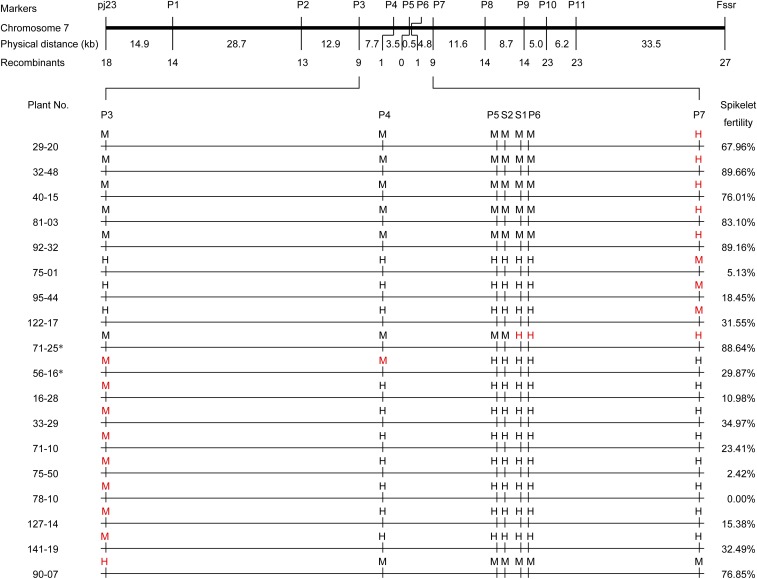
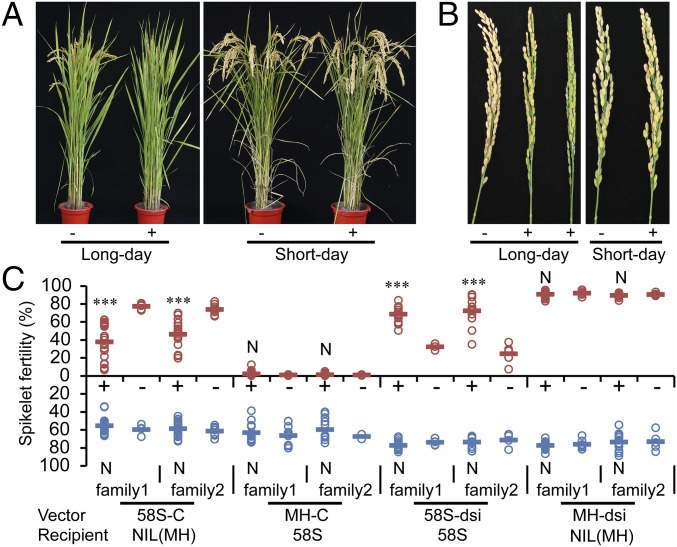
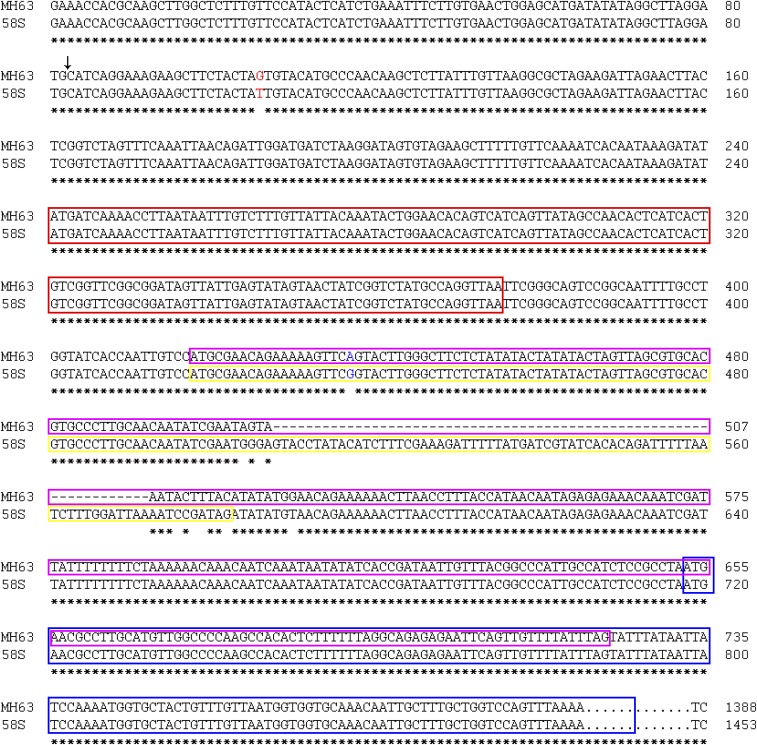
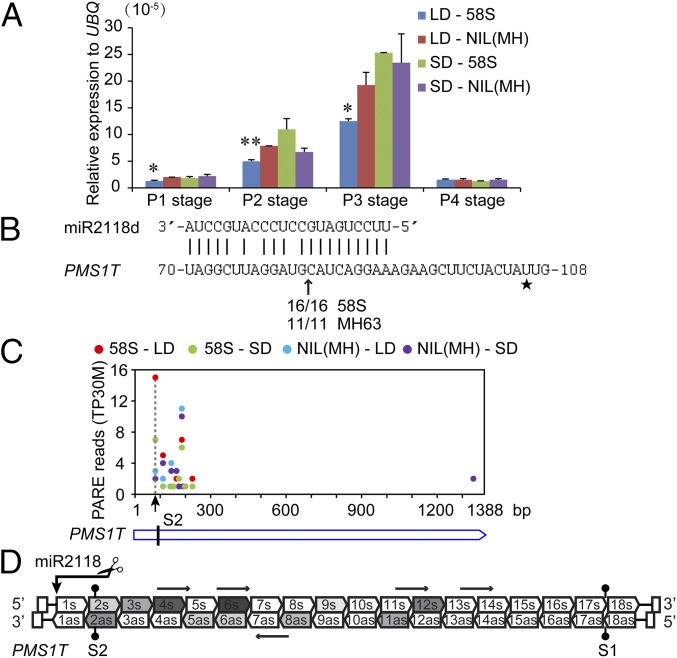
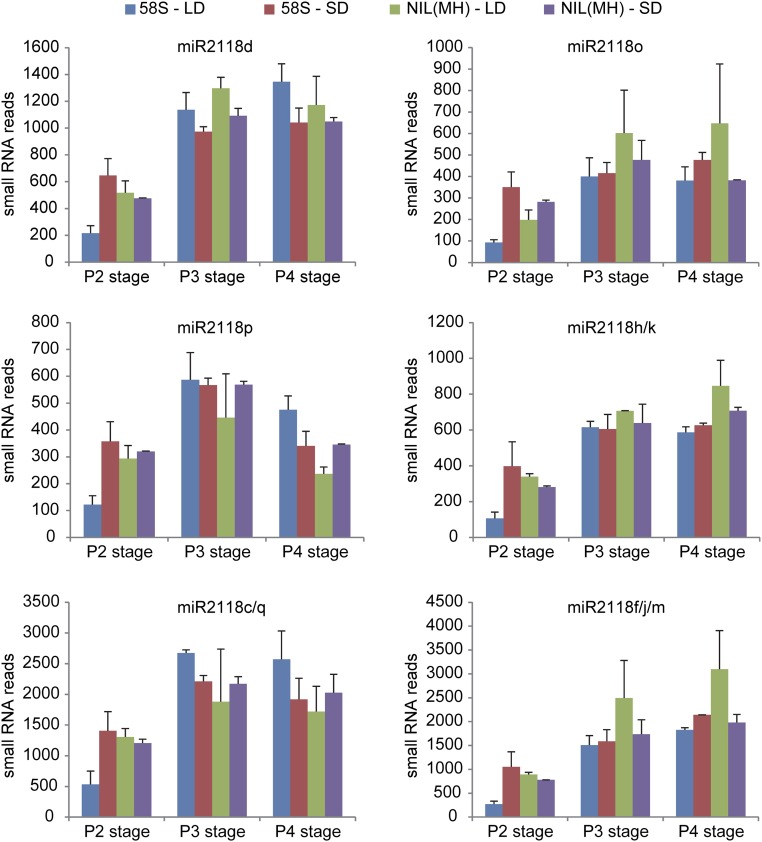
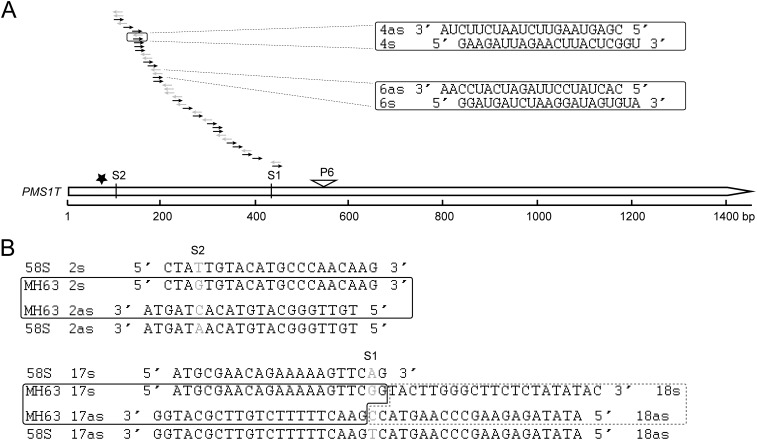
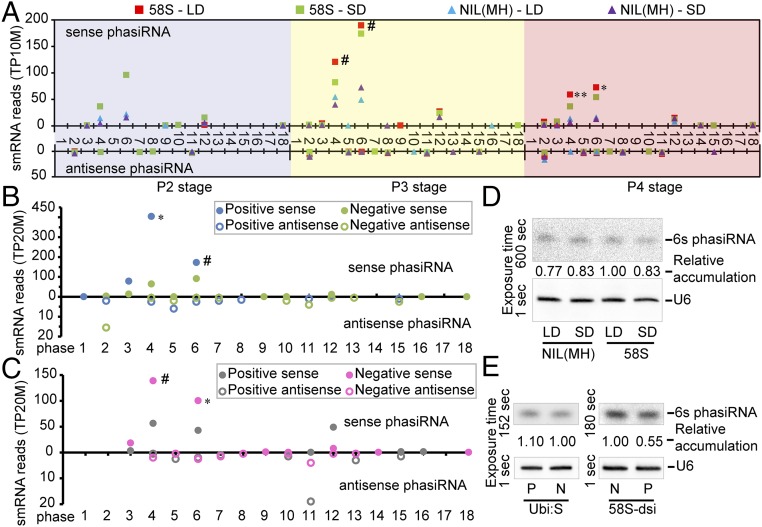
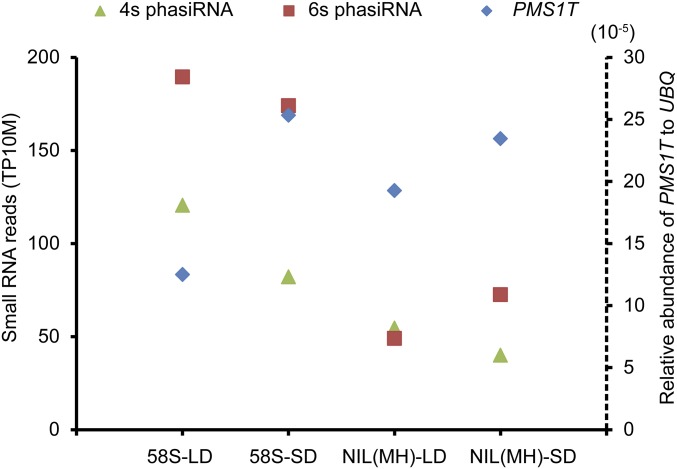
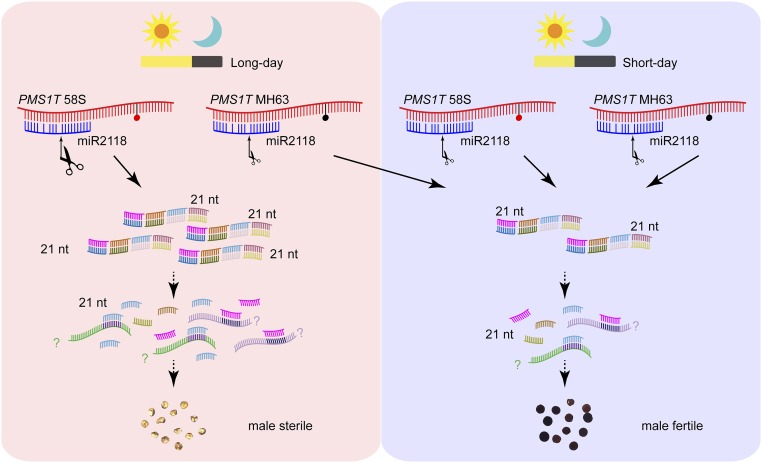
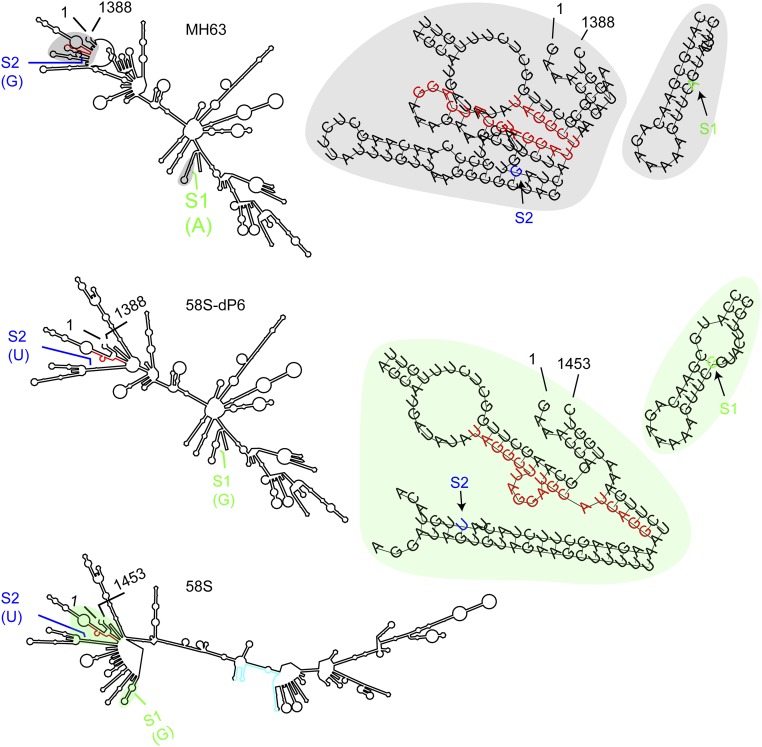
Phased small-interfering RNAs (phasiRNAs) are a special class of small RNAs, which are generated in 21- or 24-nt intervals from transcripts of precursor RNAs. Although phasiRNAs have been found in a range of organisms, their biological functions in plants have yet to be uncovered. Here we show that phasiRNAs generated by the photopheriod-sensetive genic male sterility 1 (Pms1) locus were associated with photoperiod-sensitive male sterility (PSMS) in rice, a germplasm that started the two-line hybrid rice breeding. The Pms1 locus encodes a long-noncoding RNA PMS1T that was preferentially expressed in young panicles. PMS1T was targeted by miR2118 to produce 21-nt phasiRNAs that preferentially accumulated in the PSMS line under long-day conditions. A single nucleotide polymorphism in PMS1T nearby the miR2118 recognition site was critical for fertility change, likely leading to differential accumulation of the phasiRNAs. This result suggested possible roles of phasiRNAs in reproductive development of rice, demonstrating the potential importance of this RNA class as regulators in biological processes.

Keywords: long-noncoding RNA; phasiRNA; photoperiod-sensitive male sterility.


Conflict of interest statement

The authors declare no conflict of interest.

Figures

Fig. 1.
Fig. 1.
Genetic mapping of Pms1. (A) Fertility phenotypes of 58S and NIL(MH) under long- and short-day conditions. Whole plants are shown (Left), panicles (Center), and pollen (Right). (B and C) Spikelet fertility of plants (B) and their frequency distribution (C) in the F2 population from a cross between 58S and NIL(MH) under long-day conditions. The plants were genotyped using marker Fssr. (D) Mapping of Pms1 to a 4.0-kb region on chromosome 7 according to the MH63 genome sequence. The black blocks in the middle represent exons, and the lines between them represent introns, arrows indicate the directions of genes. Sequence polymorphisms between two parents MH63 and 58S are shown below, where vertical lines represent the single nucleotide polymorphisms, and triangles for insertions. The gray block at the bottom indicates the fragment amplified from 58S for preparing the construct 58S-C.
Fig. S1.
Fig. S1.
Genotypes and fertility of the recombinants between markers P3 and P7. H, heterozygote; M, homozygous for MH63 genotype; red color indicates the recombination sites. Plant No. is the identification number for recombinants in the population; their spikelet fertility is shown on the right. An asterisk represents the most interesting recombinants.
Fig. 2.
Fig. 2.
Fertility of T1 transgenic plants under long- and short-day conditions. (A) Whole plants of transgenic segregants from the T1 family of 58S-C under long and short days. (B) Panicles of transgenic plants of 58S-C. +, positive plants; −, negative plants. (C) Spikelet fertility of T1 transgenic plants from various vectors under long- and short-day conditions. The bars indicate the means. ***P < 0.001 significant difference by t test between the positive and negative plants in each family; N indicates nonsignificant difference (P > 0.05).
Fig. S2.
Fig. S2.
Comparison of the genomic sequences of MH63 and 58S that encode PMS1T. SNP S2 is in red and SNP S1 in blue. Vertical arrow indicates the cleavage site of miR2118. Predicted ORFs are boxed with colored lines: ORF1 is in red box, ORF2 in MH63 is in pink box, ORF2 in 58S is in yellow box, and ORF3 is in blue box overlapping with ORF2 in MH63. Sequences after 800 bp in MH63 are omitted. An asterisk indicates identical nucleotides between 58S and MH63.
Fig. S4.
Fig. S4.
Schematic representation of constructs used for transformation. Constructs used for gene silencing by RNAi are in the green-shaded box, those for complementation tests are in the yellow-shaded box, and ones for overexpression are in the blue-shaded box. Short vertical lines represent the SNP: red, T; black, G; green, A. Triangle marks the 65-bp deletion at P6 marker in MH63. Dotted lines indicate omitted genome sequences. Arrow with asterisk indicates the cleavage site of miR2118.
Fig. S3.
Fig. S3.
Phenotypes of T1 transgenic plants under long-day and short-day conditions. (A) T1 transgenic plants of 58S-dsi under long- and short-day conditions. +, positive plants; −, negative plants. (BE) T1 transgenic plants of 58S-ORF1+G (B), 58S-ORF2+G (C), 58S-ORF3+G (D), and 58S-C-dP6 (E) under long-day conditions.
Fig. 3.
Fig. 3.
Targeting of PMS1T by miR2118 and production of phasiRNAs. (A) Relative abundance of PMS1T in 58S and NIL(MH) under long- and short-day conditions at the early stages of panicle development. The descriptions about different stages are as in the legend of Fig. S5. The expression levels are relative to the UBQ mRNA. Data are means ± SEM (n = 3). Statistically significant difference between LD-58S and LD-NIL(MH) by t tests at *P < 0.05 and **P < 0.01. (B) Validation by 5′ RLM-RACE that PMS1T is targeted by miR2118 using miR2118d as an example. The arrowhead indicates the cleavage site and sequence frequencies are shown below. Star marks the position of SNP S2. (C) PARE results from RNA degradome of PMS1T in 58S and NIL(MH) at P3 stage under long- and short-day conditions. Arrow indicates the cleavage sites directed by miR2118. The values of reads in each library are normalized to transcripts per 30 million (TP30M). (D) Schematic diagram of the 21-nt phasiRNAs generated from the PMS1T transcript in 58S at P3 stage under long-day conditions. The vertical arrow indicates the cleavage site directed by miR2118. Arrow-headed boxes show small RNAs in phase and horizontal arrows indicate ones that are not in phase. Intensity of gray color displays the abundance of 21-nt phasiRNA. as, phasiRNAs from antisense strand; s, phasiRNAs from sense strand.
Fig. S5.
Fig. S5.
Expression profiles of PMS1T. RT-PCR results of PMS1T in different tissues from 58S (A) and NIL(MH) (B) under long-day conditions, and 58S (C) and NIL(MH) (D) under short-day conditions. In each panel, the Upper row is the result from PMS1T, with 35 cycles of PCR amplification, and the Lower row is the reference gene Ubiquitin (LOC_Os03g13170) with 25 cycles. Tissues: 1, leaf at tillering stage; 2, leaf at young panicle stage (0.5–1.0 cm); 3, penultimate internode at young panicle stage (0.5–1.0 cm); 4, leaf sheath at young panicle stage (0.5–1.0 cm); 5, flag leaf; 6, penultimate internode at P7 stage (see description below); 7, sheath of flag leaf; 8, young panicle at secondary branch primordium differentiation stage (less than 0.5 cm, P1); 9, young panicle at pistil/stamen primordium differentiation stage (0.5–1.0 cm, P2); 10, young panicle at pollen mother cell formation stage (∼2.0 cm, P3); 11, floret at microsporocyte meiosis stage (3.0–4.0 mm in length, P4); 12, floret at tetrad stage of pollen mother cell meiosis (4.0–4.5 mm, P5); 13, floret at microspore stage (4.5–5.0 mm, P6); 14, floret at late microspore stage (5.0–6.0 mm, P7); 15, floret at bicellular pollen stage (6.0–7.0 mm, P8); 16, stamen at mature pollen stage.
Fig. S6.
Fig. S6.
Abundance of miR2118 in panicles at three stages of young panicle development. Values are means of two biological replicates, and error bars represent SEM. Abundance of small RNAs in each library was normalized to TP10M based on the total count of genome-matched reads in that library. LD, long-day conditions; SD, short-day conditions.
Fig. S7.
Fig. S7.
The locations of 21-nt phasiRNAs generated from the PMS1T region. (A) Locations of 21-nt small RNAs produced from PMS1T. The data are generated from small RNA libraries of young panicles at P2, P3, and P4 stages from 58S and NIL(MH) grown under long- and short-day conditions. Examples of duplexes with 2-nt 3′ overhang formed between 21-nt sense and antisense phased small RNAs are illustrated in the boxes. (B) The location of SNP S2 and S1 at 21-nt phasiRNAs. Gray characters indicate the SNP S2 and S1.
Fig. 4.
Fig. 4.
Expression levels of PMS1T-phasiRNAs in various genotypes. (A) Abundance of 21-nt PMS1T-phasiRNAs from young panicles of 58S and NIL(MH) at P2, P3, and P4 stages under long- and short-day conditions. The smRNA reads are normalized to the whole library with transcripts per 10 million (TP10M) and presented as the mean from two biological replicates. Differences were detected between 58S-LD and NIL(MH)-LD by t test at **P < 0.01, *P < 0.05, or #P < 0.1. (B and C) Abundance of 21-nt phasiRNAs from young panicles of transgenic T1 plants from Ubi:S (B) and 58S-dsi (C) under long-day conditions at P3 stage. Differences were detected by t test at *P < 0.05 or #P < 0.1, respectively. The smRNA data collecting and handing were as in A. (D and E) RNA blot analysis of 21-nt 6s phasiRNA in transgenic plants. Ten-microgram small RNAs per sample from young panicles at P3 stage were loaded on the gel. The samples in E are collected under long-day conditions. The blots were stripped off and rehybridized with U6 probe. The exposure time of the membranes are listed on the left. LD, long days; N, negative plants; P, positive plants; SD, short days.
Fig. S8.
Fig. S8.
Comparison of the relative abundance of PMS1T-phasiRNAs and PMS1T in panicles at P3 stage under long- and short-day conditions. The small RNA reads and the relative abundance of PMS1T are collected from the data in Figs. 3A and 4A. The small RNA reads of 4s and 6s phasiRNAs are the average of two biological repeats, and the relative abundance of PMS1T are the average of qPCR results from three biological repeats.
Fig. S9.
Fig. S9.
A hypothetic mechanistic model for Pms1–regulated PSMS in rice. The PMS1T transcript is targeted by miR2118, and more 21-nt phasiRNAs are produced in 58S than MH63 under long-day conditions because of the SNP S2 (red dot as base T, black dot as base G). The accumulation of phasiRNAs eventually causes male sterility in rice. The SNP S2 may influence the cleavage efficiency mediated by miR2118, resulting in more PMS1T-phasiRNAs in 58S under long days. On the other hand, PMS1T-phasiRNAs may function as secondary small RNA to target some unknown transcripts, which should play important roles in male sterility in rice.
Fig. S10.
Fig. S10.
Prediction of RNA secondary structure of PMS1T. The sequence of the miR2118 target is indicated in red, and the 65-bp region in cyan color. The positions and bases of SNP S2 and S1 are marked in blue and green colors, respectively. Magnification of the structures of the regions nearby the SNPs from MH63 and 58S are presented under the gray and green background, respectively.

References

    1. Komiya R, et al. Rice germline-specific Argonaute MEL1 protein binds to phasiRNAs generated from more than 700 lincRNAs. Plant J. 2014;78(3):385–397. - PubMed
    1. Johnson C, et al. Clusters and superclusters of phased small RNAs in the developing inflorescence of rice. Genome Res. 2009;19(8):1429–1440. - PMC - PubMed
    1. Han BW, Wang W, Li C, Weng Z, Zamore PD. Noncoding RNA. piRNA-guided transposon cleavage initiates Zucchini-dependent, phased piRNA production. Science. 2015;348(6236):817–821. - PMC - PubMed
    1. Mohn F, Handler D, Brennecke J. Noncoding RNA. piRNA-guided slicing specifies transcripts for Zucchini-dependent, phased piRNA biogenesis. Science. 2015;348(6236):812–817. - PMC - PubMed
    1. Allen E, Xie Z, Gustafson AM, Carrington JC. microRNA-directed phasing during trans-acting siRNA biogenesis in plants. Cell. 2005;121(2):207–221. - PubMed

Publication types

MeSH terms