

MicroRNA expressing profiles in A53T mutant alpha-synuclein transgenic mice and Parkinsonian
- PMID: 27965467
- PMCID: PMC5352072
- DOI: 10.18632/oncotarget.13905
MicroRNA expressing profiles in A53T mutant alpha-synuclein transgenic mice and Parkinsonian
Abstract
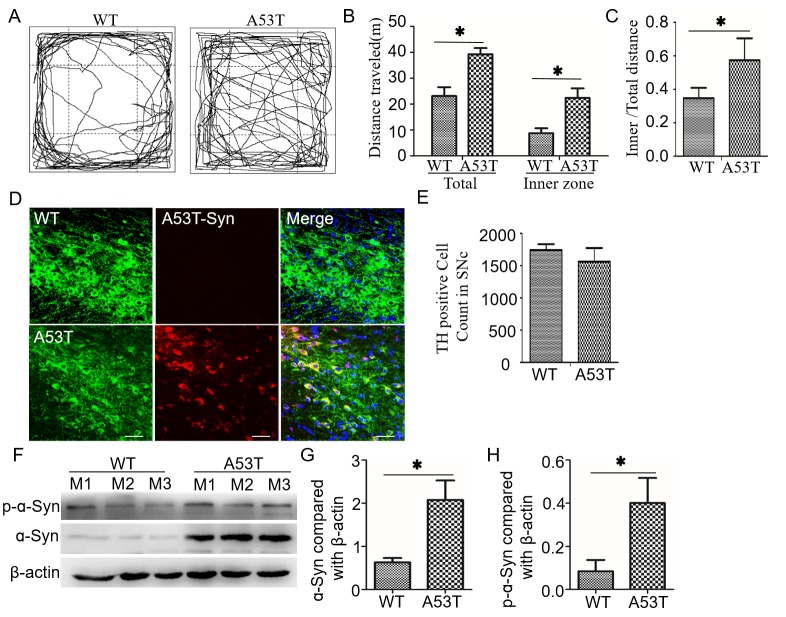
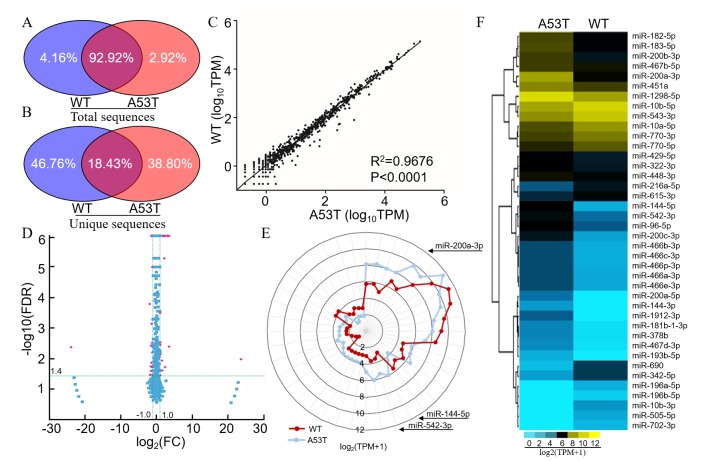
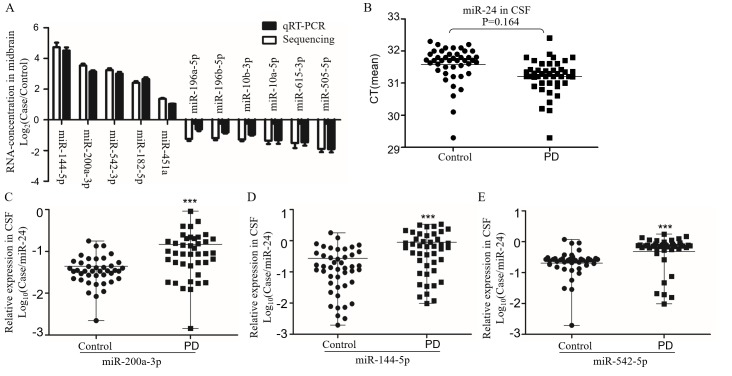
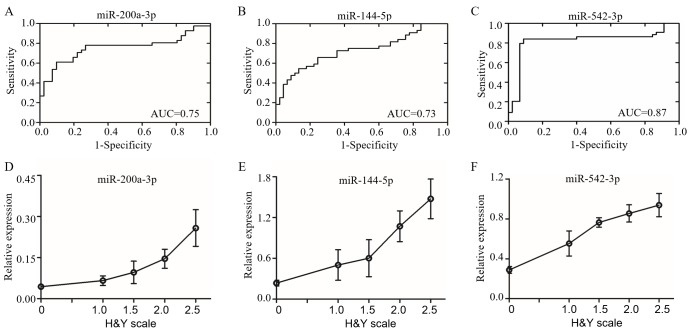
α-synuclein gene mutations can cause α-synuclein protein aggregation in the midbrain of Parkinson's disease (PD) patients. MicroRNAs (miRNAs) play a key role in the metabolism of α-synuclein but the mechanism involved in synucleinopathy remains unclear. In this study, we investigated the miRNA profiles in A53T-α-synuclein transgenic mice and analyzed the candidate miRNAs in the cerebrospinal fluid (CSF) of PD patients. The 12-month A53T-transgenic mouse displayed hyperactive movement and anxiolytic-like behaviors with α-synuclein aggregation in midbrain. A total of 317,759 total and 289,207 unique small RNA sequences in the midbrain of mice were identified by high-throughput deep sequencing. We found 644 miRNAs were significantly changed in the transgenic mice. Based on the conserved characteristic of miRNAs, we selected 11 candidates from the 40 remarkably expressed miRNAs and explored their expression in 44 CSF samples collected from PD patients. The results revealed that 11 microRNAs were differently expressed in CSF, emphatically as miR-144-5p, miR-200a-3p and miR-542-3p, which were dramatically up-regulated in both A53T-transgenic mice and PD patients, and had a helpful accuracy for the PD prediction. The ordered logistic regression analysis showed that the severity of PD has strong correlation with an up-expression of miR-144-5p, miR-200a-3p and miR-542-3p in CSF. Taken together, our data suggested that miRNAs in CSF, such as miR-144-5p, miR-200a-3p and miR-542-3p, may be useful to the PD diagnosis as potential biomarkers.
Keywords: A53T mutation; Gerotarget; Parkinson’s disease; deep sequencing; microRNAs.
Conflict of interest statement
The authors declare that no conflicts of interest exist.
Figures
Similar articles
-
High Throughput Sequencing Identifies MicroRNAs Mediating α-Synuclein Toxicity by Targeting Neuroactive-Ligand Receptor Interaction Pathway in Early Stage of Drosophila Parkinson's Disease Model.PLoS One. 2015 Sep 11;10(9):e0137432. doi: 10.1371/journal.pone.0137432. eCollection 2015. PLoS One. 2015. PMID: 26361355 Free PMC article.
-
Altered microRNA profiles in cerebrospinal fluid exosome in Parkinson disease and Alzheimer disease.Oncotarget. 2015 Nov 10;6(35):37043-53. doi: 10.18632/oncotarget.6158. Oncotarget. 2015. PMID: 26497684 Free PMC article.
-
Intracerebral Administration of a Ligand-ASO Conjugate Selectively Reduces α-Synuclein Accumulation in Monoamine Neurons of Double Mutant Human A30P*A53T*α-Synuclein Transgenic Mice.Int J Mol Sci. 2021 Mar 13;22(6):2939. doi: 10.3390/ijms22062939. Int J Mol Sci. 2021. PMID: 33805843 Free PMC article.
-
MicroRNAs in Parkinson's disease.Neurobiol Dis. 2012 May;46(2):279-84. doi: 10.1016/j.nbd.2011.12.046. Epub 2012 Jan 5. Neurobiol Dis. 2012. PMID: 22245218 Review.
-
Parkinson's disease and alpha synuclein: is Parkinson's disease a prion-like disorder?Mov Disord. 2013 Jan;28(1):31-40. doi: 10.1002/mds.25373. Mov Disord. 2013. PMID: 23390095 Review.
Cited by
-
Using Extracellular miRNA Signatures to Identify Patients with LRRK2-Related Parkinson's Disease.J Parkinsons Dis. 2024;14(5):977-991. doi: 10.3233/JPD-230408. J Parkinsons Dis. 2024. PMID: 38848197 Free PMC article.
-
Blood-based microRNAs as the potential biomarkers for Alzheimer's disease: evidence from a systematic review.Metab Brain Dis. 2024 Nov 28;40(1):44. doi: 10.1007/s11011-024-01431-7. Metab Brain Dis. 2024. PMID: 39607566
-
Association of Serum Extracellular Vesicle miRNAs with Cognitive Functioning and Quality of Life in Parkinson's Disease.Biomolecules. 2024 Aug 13;14(8):1000. doi: 10.3390/biom14081000. Biomolecules. 2024. PMID: 39199388 Free PMC article.
-
MicroRNA-409-3p Targeting at ATXN3 Reduces the Apoptosis of Dopamine Neurons Based on the Profile of miRNAs in the Cerebrospinal Fluid of Early Parkinson's Disease.Front Cell Dev Biol. 2022 Jan 10;9:755254. doi: 10.3389/fcell.2021.755254. eCollection 2021. Front Cell Dev Biol. 2022. PMID: 35111747 Free PMC article.
-
Circulating miRNAs as Diagnostic Biomarkers for Parkinson's Disease.Front Neurosci. 2018 Sep 5;12:625. doi: 10.3389/fnins.2018.00625. eCollection 2018. Front Neurosci. 2018. PMID: 30233304 Free PMC article. Review.
References
-
- Jellinger KA. Synuclein deposition and non-motor symptoms in Parkinson disease. Journal of the neurological sciences. 2011;310(1):107–111. - PubMed
MeSH terms
Substances
LinkOut - more resources
Full Text Sources
Other Literature Sources
Medical
