The Multivariate Temporal Response Function (mTRF) Toolbox: A MATLAB Toolbox for Relating Neural Signals to Continuous Stimuli
- PMID: 27965557
- PMCID: PMC5127806
- DOI: 10.3389/fnhum.2016.00604
The Multivariate Temporal Response Function (mTRF) Toolbox: A MATLAB Toolbox for Relating Neural Signals to Continuous Stimuli
Abstract
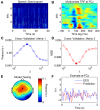
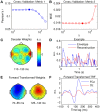
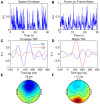
Understanding how brains process sensory signals in natural environments is one of the key goals of twenty-first century neuroscience. While brain imaging and invasive electrophysiology will play key roles in this endeavor, there is also an important role to be played by noninvasive, macroscopic techniques with high temporal resolution such as electro- and magnetoencephalography. But challenges exist in determining how best to analyze such complex, time-varying neural responses to complex, time-varying and multivariate natural sensory stimuli. There has been a long history of applying system identification techniques to relate the firing activity of neurons to complex sensory stimuli and such techniques are now seeing increased application to EEG and MEG data. One particular example involves fitting a filter-often referred to as a temporal response function-that describes a mapping between some feature(s) of a sensory stimulus and the neural response. Here, we first briefly review the history of these system identification approaches and describe a specific technique for deriving temporal response functions known as regularized linear regression. We then introduce a new open-source toolbox for performing this analysis. We describe how it can be used to derive (multivariate) temporal response functions describing a mapping between stimulus and response in both directions. We also explain the importance of regularizing the analysis and how this regularization can be optimized for a particular dataset. We then outline specifically how the toolbox implements these analyses and provide several examples of the types of results that the toolbox can produce. Finally, we consider some of the limitations of the toolbox and opportunities for future development and application.
Keywords: EEG/MEG; reverse correlation; sensory processing; stimulus reconstruction; system identification.
Figures


Similar articles
-
Unfold: an integrated toolbox for overlap correction, non-linear modeling, and regression-based EEG analysis.PeerJ. 2019 Oct 24;7:e7838. doi: 10.7717/peerj.7838. eCollection 2019. PeerJ. 2019. PMID: 31660265 Free PMC article.
-
A toolbox for the fast information analysis of multiple-site LFP, EEG and spike train recordings.BMC Neurosci. 2009 Jul 16;10:81. doi: 10.1186/1471-2202-10-81. BMC Neurosci. 2009. PMID: 19607698 Free PMC article.
-
Linear Modeling of Neurophysiological Responses to Speech and Other Continuous Stimuli: Methodological Considerations for Applied Research.Front Neurosci. 2021 Nov 22;15:705621. doi: 10.3389/fnins.2021.705621. eCollection 2021. Front Neurosci. 2021. PMID: 34880719 Free PMC article. Review.
-
Integration of EEG source imaging and fMRI during continuous viewing of natural movies.Magn Reson Imaging. 2010 Oct;28(8):1135-42. doi: 10.1016/j.mri.2010.03.042. Epub 2010 Jun 25. Magn Reson Imaging. 2010. PMID: 20579829
-
Mapping of the neuronal networks of human cortical brain functions.Adv Tech Stand Neurosurg. 2003;28:91-142. doi: 10.1007/978-3-7091-0641-9_2. Adv Tech Stand Neurosurg. 2003. PMID: 12627809 Review.
Cited by
-
The effect of gaze on EEG measures of multisensory integration in a cocktail party scenario.Front Hum Neurosci. 2023 Dec 15;17:1283206. doi: 10.3389/fnhum.2023.1283206. eCollection 2023. Front Hum Neurosci. 2023. PMID: 38162285 Free PMC article.
-
Joint, distributed and hierarchically organized encoding of linguistic features in the human auditory cortex.Nat Hum Behav. 2023 May;7(5):740-753. doi: 10.1038/s41562-023-01520-0. Epub 2023 Mar 2. Nat Hum Behav. 2023. PMID: 36864134 Free PMC article.
-
Unfold: an integrated toolbox for overlap correction, non-linear modeling, and regression-based EEG analysis.PeerJ. 2019 Oct 24;7:e7838. doi: 10.7717/peerj.7838. eCollection 2019. PeerJ. 2019. PMID: 31660265 Free PMC article.
-
Decoding Selective Attention in Normal Hearing Listeners and Bilateral Cochlear Implant Users With Concealed Ear EEG.Front Neurosci. 2019 Jul 18;13:720. doi: 10.3389/fnins.2019.00720. eCollection 2019. Front Neurosci. 2019. PMID: 31379479 Free PMC article.
-
Cortical Tracking of Sung Speech in Adults vs Infants: A Developmental Analysis.Front Neurosci. 2022 Apr 12;16:842447. doi: 10.3389/fnins.2022.842447. eCollection 2022. Front Neurosci. 2022. PMID: 35495026 Free PMC article.
References
-
- Barjatya A. (2004). Block matching algorithms for motion estimation. IEEE Transac. Evol. Comput. 8, 225–239.
LinkOut - more resources
Full Text Sources
Other Literature Sources

