

Exploring the Mechanisms of Exercise-Induced Hypoalgesia Using Somatosensory and Laser Evoked Potentials
- PMID: 27965587
- PMCID: PMC5126702
- DOI: 10.3389/fphys.2016.00581
Exploring the Mechanisms of Exercise-Induced Hypoalgesia Using Somatosensory and Laser Evoked Potentials
Abstract
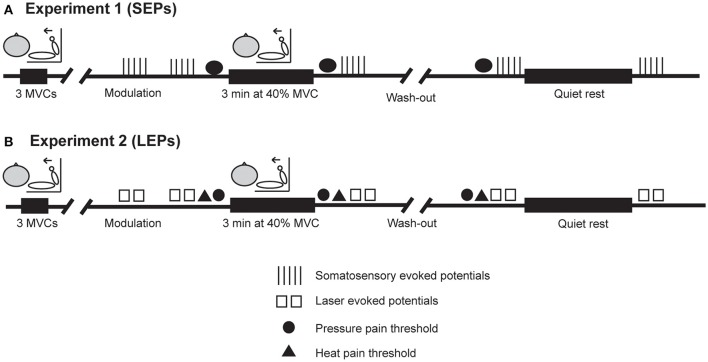
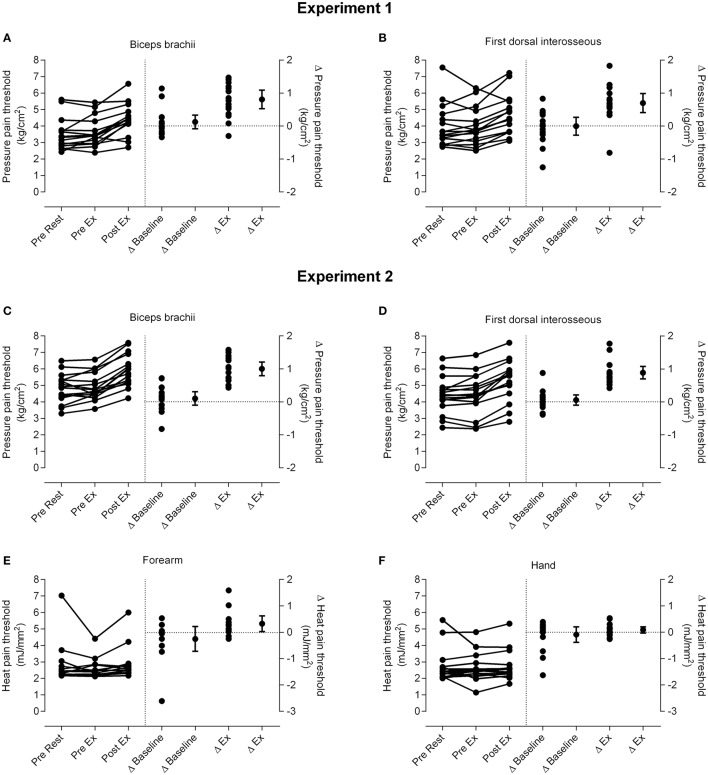
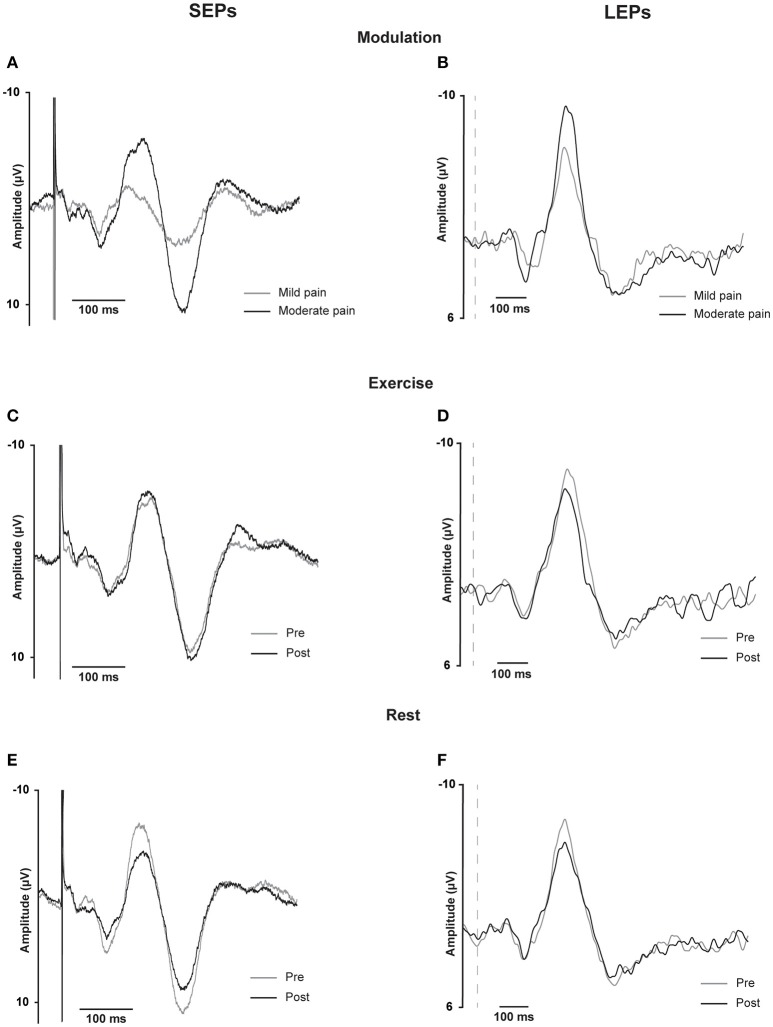
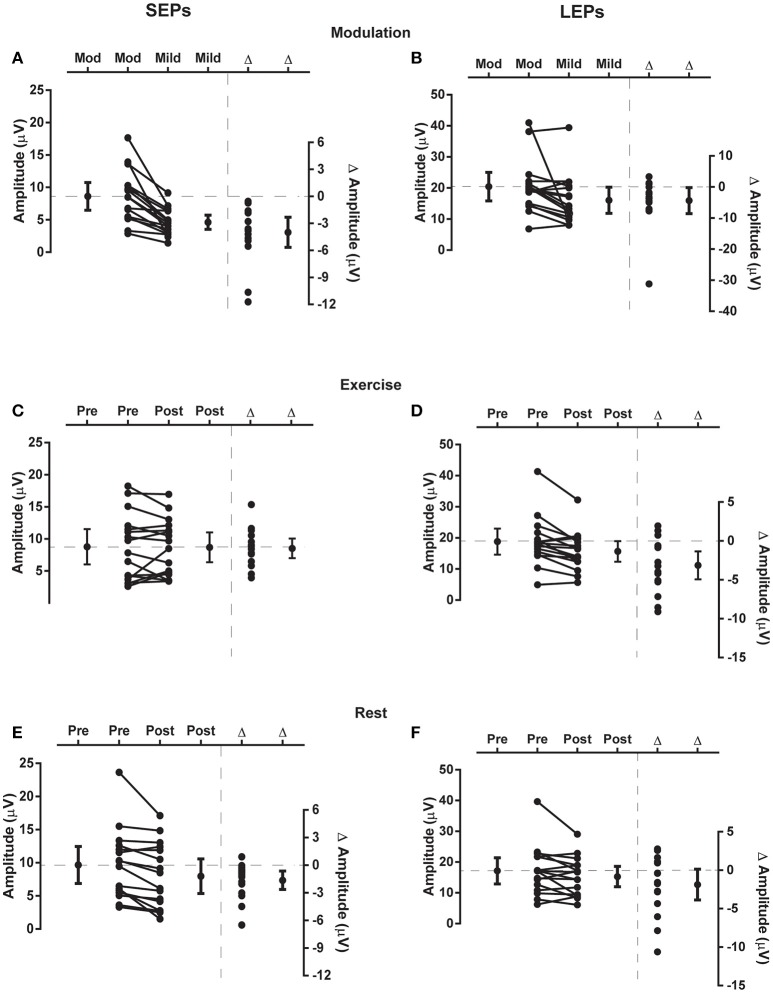
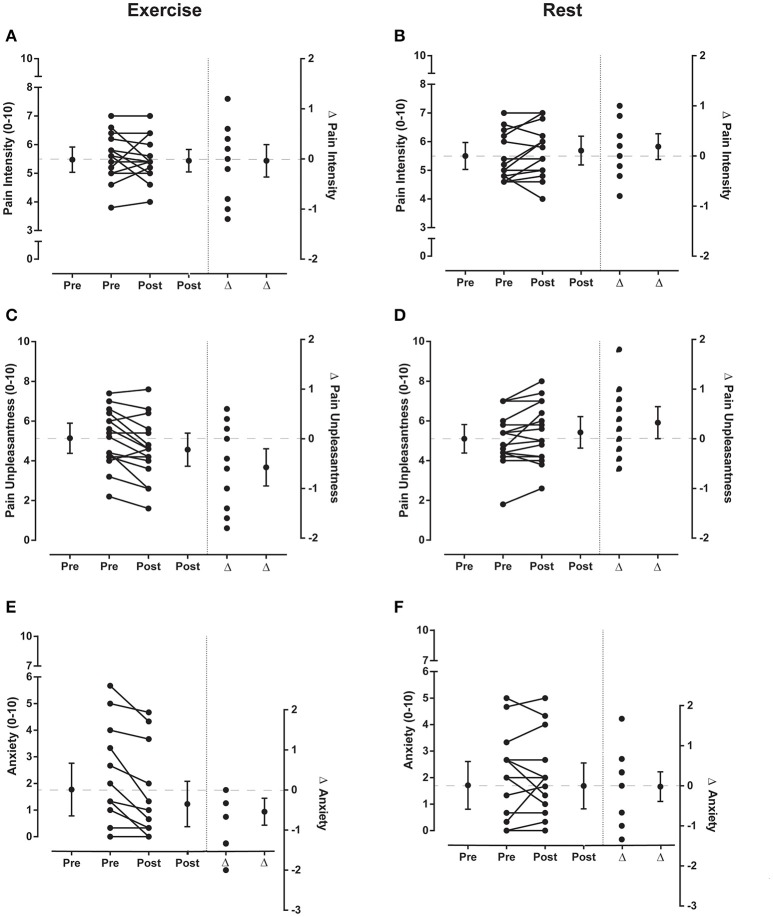
Exercise-induced hypoalgesia is well described, but the underlying mechanisms are unclear. The aim of this study was to examine the effect of exercise on somatosensory evoked potentials, laser evoked potentials, pressure pain thresholds and heat pain thresholds. These were recorded before and after 3-min of isometric elbow flexion exercise at 40% of the participant's maximal voluntary force, or an equivalent period of rest. Exercise-induced hypoalgesia was confirmed in two experiments (Experiment 1-SEPs; Experiment 2-LEPs) by increased pressure pain thresholds at biceps brachii (24.3 and 20.6% increase in Experiment 1 and 2, respectively; both d > 0.84 and p < 0.001) and first dorsal interosseous (18.8 and 21.5% increase in Experiment 1 and 2, respectively; both d > 0.57 and p < 0.001). In contrast, heat pain thresholds were not significantly different after exercise (forearm: 10.8% increase, d = 0.35, p = 0.10; hand: 3.6% increase, d = 0.06, p = 0.74). Contrasting effects of exercise on the amplitude of laser evoked potentials (14.6% decrease, d = -0.42, p = 0.004) and somatosensory evoked potentials (10.9% increase, d = -0.02, p = 1) were also observed, while an equivalent period of rest showed similar habituation (laser evoked potential: 7.3% decrease, d = -0.25, p = 0.14; somatosensory evoked potential: 20.7% decrease, d = -0.32, p = 0.006). The differential response of pressure pain thresholds and heat pain thresholds to exercise is consistent with relative insensitivity of thermal nociception to the acute hypoalgesic effects of exercise. Conflicting effects of exercise on somatosensory evoked potentials and laser evoked potentials were observed. This may reflect non-nociceptive contributions to the somatosensory evoked potential, but could also indicate that peripheral nociceptors contribute to exercise-induced hypoalgesia.
Keywords: evoked potential; exercise; healthy subjects; pain rating; pain threshold.
Figures
Similar articles
-
Aerobic Exercise Reduces Pressure More Than Heat Pain Sensitivity in Healthy Adults.Pain Med. 2019 Aug 1;20(8):1534-1546. doi: 10.1093/pm/pny289. Pain Med. 2019. PMID: 30649457
-
Sensitivity of laser-evoked potentials versus somatosensory evoked potentials in patients with multiple sclerosis.Clin Neurophysiol. 2003 Jun;114(6):992-1002. doi: 10.1016/s1388-2457(03)00069-5. Clin Neurophysiol. 2003. PMID: 12804667
-
Effects of Exercise-induced Hypoalgesia and Its Neural Mechanisms.Med Sci Sports Exerc. 2022 Feb 1;54(2):220-231. doi: 10.1249/MSS.0000000000002781. Med Sci Sports Exerc. 2022. PMID: 34468414 Clinical Trial.
-
Clinical neurophysiology of pain.Handb Clin Neurol. 2019;161:121-148. doi: 10.1016/B978-0-444-64142-7.00045-X. Handb Clin Neurol. 2019. PMID: 31307596 Review.
-
[Laser evoked potentials as a method of evaluating the function of small fibres - application technique and clinical implications].Neurol Neurochir Pol. 2009 Jul-Aug;43(4):368-81. Neurol Neurochir Pol. 2009. PMID: 19742396 Review. Polish.
Cited by
-
Reliability of Pain Thresholds and Exercise-Induced Hypoalgesia Following 45-Degree Roman Chair Exercise.Int J Sports Phys Ther. 2025 Apr 1;20(4):542-552. doi: 10.26603/001c.132173. eCollection 2025. Int J Sports Phys Ther. 2025. PMID: 40182904 Free PMC article.
-
Aerobic Exercise Attenuates Pain Sensitivity: An Event-Related Potential Study.Front Neurosci. 2021 Sep 21;15:735470. doi: 10.3389/fnins.2021.735470. eCollection 2021. Front Neurosci. 2021. PMID: 34630022 Free PMC article.
-
Exercise-induced pain threshold modulation in healthy subjects: a systematic review and meta-analysis.Princ Pract Clin Res. 2020 Sep 7;6(3):11-28. doi: 10.21801/ppcrj.2020.63.2. Epub 2020 Sep 16. Princ Pract Clin Res. 2020. PMID: 33409362 Free PMC article.
-
Obesity and Systemic Inflammation Disrupt the Compensatory Role of Physical Activity in Chronic Pain Conditions.Biomedicines. 2025 May 2;13(5):1111. doi: 10.3390/biomedicines13051111. Biomedicines. 2025. PMID: 40426937 Free PMC article.
-
The effect of resistance exercise on multimodal pain thresholds in local and systemic muscle sites.Physiol Rep. 2024 Jun;12(12):e16123. doi: 10.14814/phy2.16123. Physiol Rep. 2024. PMID: 38890005 Free PMC article.
References
-
- Arguissain F. G., Biurrun Manresa J. A., Morch C. D., Andersen O. K. (2015). On the use of information theory for the analysis of synchronous nociceptive withdrawal reflexes and somatosensory evoked potentials elicited by graded electrical stimulation. J. Neurosci. Methods 240, 1–12. 10.1016/j.jneumeth.2014.10.011 - DOI - PubMed
-
- Bobinski F., Alarcon Ferreira T. A., Cordova M. M., Dombrowski P. A., da Cunha C., Santo C. C., et al. . (2015). Role of brainstem serotonin in analgesia produced by low-intensity exercise on neuropathic pain following sciatic nerve injury in mice. Pain 156, 2595–2606. 10.1097/j.pain.0000000000000372 - DOI - PMC - PubMed
LinkOut - more resources
Full Text Sources
Other Literature Sources