

Dynamic Changes in Spectral and Spatial Signatures of High Frequency Oscillations in Rat Hippocampi during Epileptogenesis in Acute and Chronic Stages
- PMID: 27965619
- PMCID: PMC5124575
- DOI: 10.3389/fneur.2016.00204
Dynamic Changes in Spectral and Spatial Signatures of High Frequency Oscillations in Rat Hippocampi during Epileptogenesis in Acute and Chronic Stages
Abstract
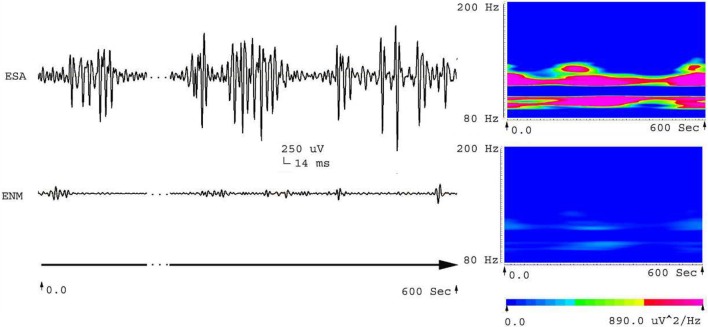
Objective: To analyze spectral and spatial signatures of high frequency oscillations (HFOs), which include ripples and fast ripples (FRs, >200 Hz) by quantitatively assessing average and peak spectral power in a rat model of different stages of epileptogenesis.
Methods: The lithium-pilocarpine model of temporal lobe epilepsy was used. The acute phase of epilepsy was assessed by recording intracranial electroencephalography (EEG) activity for 1 day after status epilepticus (SE). The chronic phase of epilepsy, including spontaneous recurrent seizures (SRSs), was assessed by recording EEG activity for 28 days after SE. Average and peak spectral power of five frequency bands of EEG signals in CA1, CA3, and DG regions of the hippocampus were analyzed with wavelet and digital filter.
Results: FRs occurred in the hippocampus in the animal model. Significant dynamic changes in the spectral power of FRS were identified in CA1 and CA3. The average spectral power of ripples increased at 20 min before SE (p < 0.05), peaked at 10 min before diazepam injection. It decreased at 10 min after diazepam (p < 0.05) and returned to baseline after 1 h. The average spectral power of FRs increased at 30 min before SE (p < 0.05) and peaked at 10 min before diazepam. It decreased at 10 min after diazepam (p < 0.05) and returned to baseline at 2 h after injection. The dynamic changes were similar between average and peak spectral power of FRs. Average and peak spectral power of both ripples and FRs in the chronic phase showed a gradual downward trend compared with normal rats 14 days after SE.
Significance: The spectral power of HFOs may be utilized to distinguish between normal and pathologic HFOs. Ictal average and peak spectral power of FRs were two parameters for predicting acute epileptic seizures, which could be used as a new quantitative biomarker and early warning marker of seizure. Changes in interictal HFOs power in the hippocampus at the chronic stage may be not related to seizure occurrence.
Keywords: epileptogenesis; high frequency oscillations; qualitative analysis; quantitative analysis; spectral power.
Figures


Similar articles
-
Anticonvulsant Effect of Carbenoxolone on Chronic Epileptic Rats and Its Mechanism Related to Connexin and High-Frequency Oscillations.Front Mol Neurosci. 2022 May 9;15:870947. doi: 10.3389/fnmol.2022.870947. eCollection 2022. Front Mol Neurosci. 2022. PMID: 35615064 Free PMC article.
-
High-frequency (80-500 Hz) oscillations and epileptogenesis in temporal lobe epilepsy.Neurobiol Dis. 2011 Jun;42(3):231-41. doi: 10.1016/j.nbd.2011.01.007. Epub 2011 Jan 14. Neurobiol Dis. 2011. PMID: 21238589 Free PMC article.
-
Effects of gap junctions blockers on fast ripples and connexin in rat hippocampi after status epilepticus.Epilepsy Res. 2018 Oct;146:28-35. doi: 10.1016/j.eplepsyres.2018.07.010. Epub 2018 Jul 20. Epilepsy Res. 2018. PMID: 30056318
-
High-frequency oscillations and mesial temporal lobe epilepsy.Neurosci Lett. 2018 Feb 22;667:66-74. doi: 10.1016/j.neulet.2017.01.047. Epub 2017 Jan 20. Neurosci Lett. 2018. PMID: 28115239 Review.
-
High-frequency oscillations and focal seizures in epileptic rodents.Neurobiol Dis. 2019 Apr;124:396-407. doi: 10.1016/j.nbd.2018.12.016. Epub 2018 Dec 24. Neurobiol Dis. 2019. PMID: 30590178 Review.
Cited by
-
Catalpol Exerts an Anti-Epilepticus Effect, Possibly by Regulating the Nrf2-Keap1-ARE Signaling Pathway.Med Sci Monit. 2018 Dec 28;24:9436-9441. doi: 10.12659/MSM.911902. Med Sci Monit. 2018. PMID: 30592708 Free PMC article.
-
A new comorbidity model and the common pathological mechanisms of migraine and epilepsy.Am J Transl Res. 2017 May 15;9(5):2286-2295. eCollection 2017. Am J Transl Res. 2017. PMID: 28559979 Free PMC article.
-
Effect of gap junction blockers on hippocampal ripple energy expression in rats with status epilepticus.Zhongguo Dang Dai Er Ke Za Zhi. 2021 Aug 15;23(8):848-853. doi: 10.7499/j.issn.1008-8830.2103162. Zhongguo Dang Dai Er Ke Za Zhi. 2021. PMID: 34511176 Free PMC article. Chinese, English.
-
Complexity-based graph convolutional neural network for epilepsy diagnosis in normal, acute, and chronic stages.Front Comput Neurosci. 2023 Sep 29;17:1211096. doi: 10.3389/fncom.2023.1211096. eCollection 2023. Front Comput Neurosci. 2023. PMID: 37841676 Free PMC article.
-
Dynamic effects of miR-20a-5p on hippocampal ripple energy after status epilepticus in rats.Exp Brain Res. 2023 Aug;241(8):2097-2106. doi: 10.1007/s00221-023-06663-0. Epub 2023 Jul 18. Exp Brain Res. 2023. PMID: 37464223
References
LinkOut - more resources
Full Text Sources
Other Literature Sources
Medical
Miscellaneous