. 2016 Nov 29:7:210.
doi: 10.3389/fgene.2016.00210. eCollection 2016.

Efficient Breeding by Genomic Mating

Affiliations

Efficient Breeding by Genomic Mating

Deniz Akdemir et al. Front Genet. .

Abstract

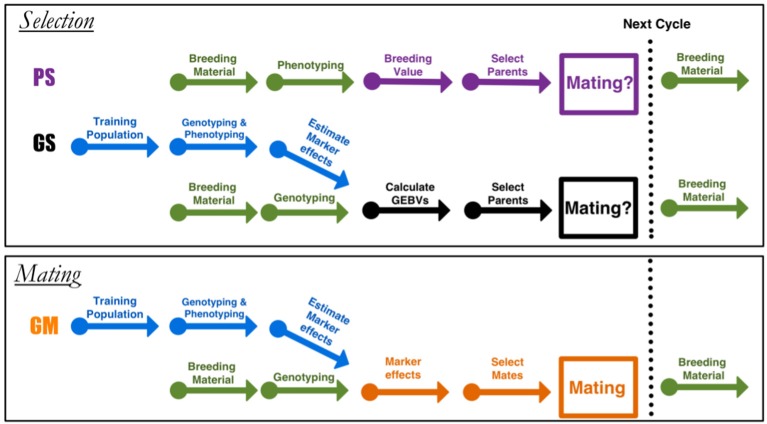
Selection in breeding programs can be done by using phenotypes (phenotypic selection), pedigree relationship (breeding value selection) or molecular markers (marker assisted selection or genomic selection). All these methods are based on truncation selection, focusing on the best performance of parents before mating. In this article we proposed an approach to breeding, named genomic mating, which focuses on mating instead of truncation selection. Genomic mating uses information in a similar fashion to genomic selection but includes information on complementation of parents to be mated. Following the efficiency frontier surface, genomic mating uses concepts of estimated breeding values, risk (usefulness) and coefficient of ancestry to optimize mating between parents. We used a genetic algorithm to find solutions to this optimization problem and the results from our simulations comparing genomic selection, phenotypic selection and the mating approach indicate that current approach for breeding complex traits is more favorable than phenotypic and genomic selection. Genomic mating is similar to genomic selection in terms of estimating marker effects, but in genomic mating the genetic information and the estimated marker effects are used to decide which genotypes should be crossed to obtain the next breeding population.

Keywords: breeding; complex traits; genome-wide markers; genomic selection; phenotypic selection.


Figures

Figure 1
Figure 1
Diagram for the different breeding approaches. Phenotypic selection (PS) and genomic selection (GS) are truncation selection methods, and genomic mating (GM) is the mating approach. Arrows indicate the different stages in a breeding cycle. In PS, starting with a set of parents as breeding material, selection is performed based on phenotypes.
Figure 2
Figure 2
Additive genetic variance and gains by selection after random mating compared to gains by selection after random mating optimal mating. The parents and progeny for the random mating populations have the same allele frequencies and therefore the same additive genetic variance. If parents are mated with optimal mating the result is an increase in the additive genetic variance. This is pronounced as larger gains and maintains additive genetic variability for as the breeding progresses.
Figure 3
Figure 3
Frontier surface for a simulated population. A marker data was created for 50 genotypes by randomly generating 1000 markers for each genotype. By introducing independent and identically normally distributed marker effects at 500 of randomly selected the loci we have defined a trait. Three surfaces are given in the figure. The blue surface represents the optimal values of the objective function in Equation (2). Points below this surface correspond to sub-optimal regions and points above this surface are unattainable. The points along the surfaces are the optimal points balancing gain, risk and inbreeding. The green surface is the expected average genetic value of the progeny and the orange surface is the value of the cross-variance term, these two surfaces add up to the blue surface. Although, it is not possible to determine a best value for the parameters λ1 and λ2, a reasonable region for this particular experiment is marked by a red ellipse, this is the region in which the rate of increase in inbreeding per unit gain increases sharply and obtaining additional cross variance after this point requires a large decline in gain.
Figure 4
Figure 4
Optimal solutions for a simulated population. Optimal solutions to the mating problem at a few selected values of λ1 and λ2 are in (A–D). The list of mates and the number of crosses for each mate is given along the figures. The first two coordinates are used to display the genetic relationships of the lines using the first two principal components, the third coordinate displays the BV's of the parents. Each parent is represented by a vertical bar. The lines between the vertical bars represent the matings and the size of the points on the bars are proportional to the number of crosses between that parent and any other. Since the mating algorithm is discrete and the number of genotypes contributing to the next generation increase starting from one as we increase the λ2, we can identify a point to operate on this surface by slowly increasing the λ2 until a desired minimum number of genotypes are included in the solution.
Figure 5
Figure 5
The long term behavior of PS, GS, Efficient GS and GM. Starting from 2 founders we have formed a population of 150 (A) and 300 (B) genotypes with 1000 SNPs at 3 chromosomes each and carried this population through 200 generations of random mating and 100 generations of phenotypic selection based on a complex trait (300 QTL at random locations on each chromosome) with 0.5 heritability generated based on the infinitesimal model. Starting from this initial population, we have simulated 10 rounds of PS, and 20 rounds of GS and GM (assuming one cycle of PS and two cycles of GS and GM per year). For GS and GM, the marker effects were estimated from data once per year. The results of 10 replication of this simulation with selection intensity 10% (PS1, GS1) and 20% (PS2, GS2) for PS and GS; Efficient GS (GSeff); and GM with λ1 = 0, 5, 10 (GM1, GM2, GM3). Each thin line represents the genetic gains over cycles by different methods over a replication of the experiment. The thick lines show the mean improvement for each of the methods over 10 replications. In these simulation studies there is a clear advantage of using GM as a breeding method.

References

    1. Akdemir D., Godfrey O. U. (2015). EMMREML: Fitting Mixed Models with Known Covariance Structures. R package version 3.1.
    1. Akdemir D., Sanchez J. I., Jannink J.-L. (2015). Optimization of genomic selection training populations with a genetic algorithm. Genet. Select. Evol. 47:38 10.1186/s12711-015-0116-6 - DOI - PMC - PubMed
    1. Allaire F. (1980). Mate selection by selection index theory. Theor. Appl. Genet. 57, 267–272. 10.1007/BF00264953 - DOI - PubMed
    1. Berg P., Nielsen J., Sørensen M. K. (2006). Eva: realized and predicted optimal genetic contributions, in Proceedings of the 8th World Congress on Genetics Applied to Livestock Production, Belo Horizonte, Minas Gerais, Brazil, 13-18 August (Porto Alegre, RS: Instituto Prociência; ).
    1. Bernardo R., Charcosset A. (2006). Usefulness of gene information in marker-assisted recurrent selection: a simulation appraisal. Crop Sci. 46, 614–621. 10.2135/cropsci2005.05-0088 - DOI