. 2017 Aug;19(4):599-609.
doi: 10.1007/s11307-016-1032-z.

ImmunoPET Imaging of Murine CD4+ T Cells Using Anti-CD4 Cys-Diabody: Effects of Protein Dose on T Cell Function and Imaging

Affiliations

ImmunoPET Imaging of Murine CD4+ T Cells Using Anti-CD4 Cys-Diabody: Effects of Protein Dose on T Cell Function and Imaging

Amanda C Freise et al. Mol Imaging Biol. 2017 Aug.

Abstract

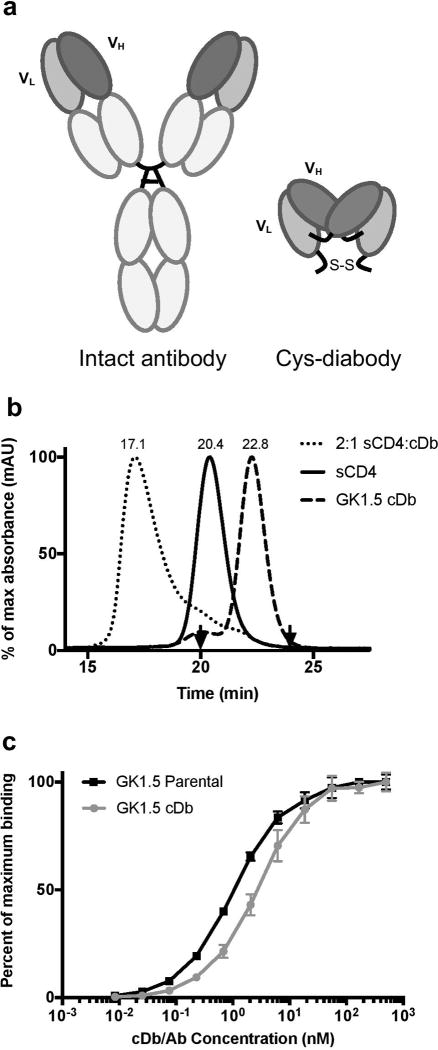
Purpose: Molecular imaging of CD4+ T cells throughout the body has implications for monitoring autoimmune disease and immunotherapy of cancer. Given the key role of these cells in regulating immunity, it is important to develop a biologically inert probe. GK1.5 cys-diabody (cDb), a previously developed anti-mouse CD4 antibody fragment, was tested at different doses to assess its effects on positron emission tomography (PET) imaging and CD4+ T cell viability, proliferation, CD4 expression, and function.

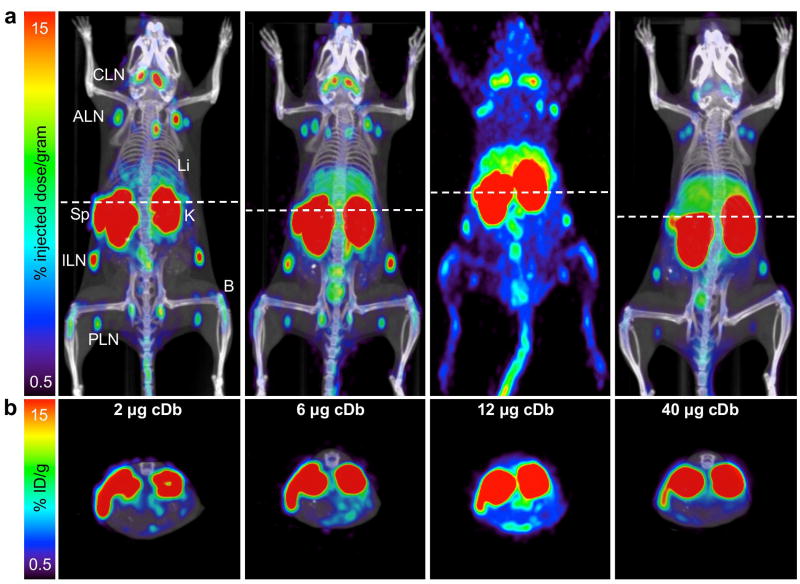
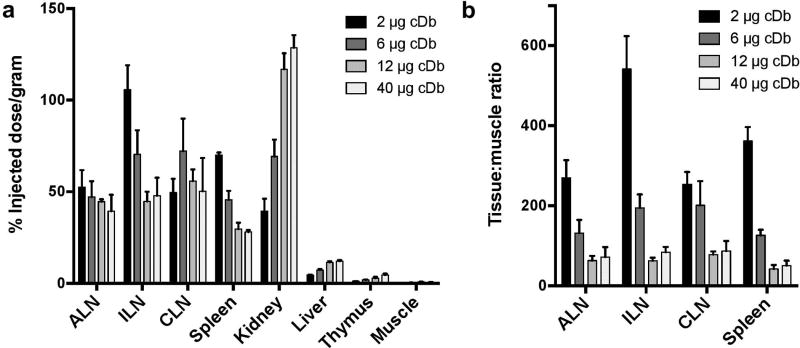
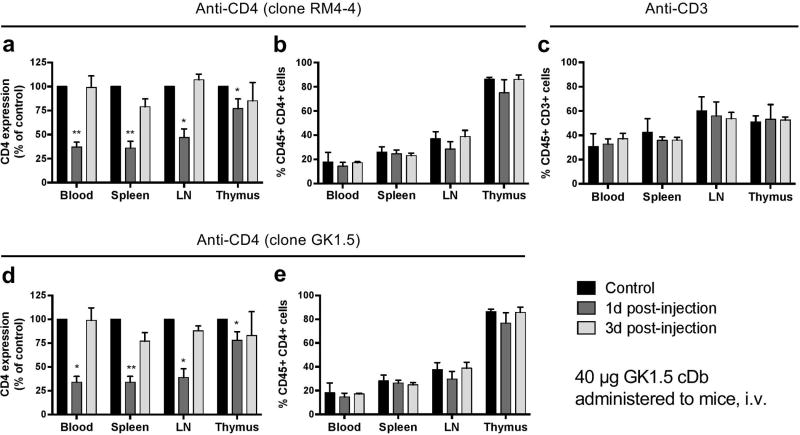
Procedures: The effect of protein dose on image contrast (lymphoid tissue-to-muscle ratio) was assessed by administering different amounts of 89Zr-labeled GK1.5 cDb to mice followed by PET imaging and ex vivo biodistribution analysis. To assess impact of GK1.5 cDb on T cell biology, GK1.5 cDb was incubated with T cells in vitro or administered intravenously to C57BL/6 mice at multiple protein doses. CD4 expression and T cell proliferation were analyzed with flow cytometry and cytokines were assayed.

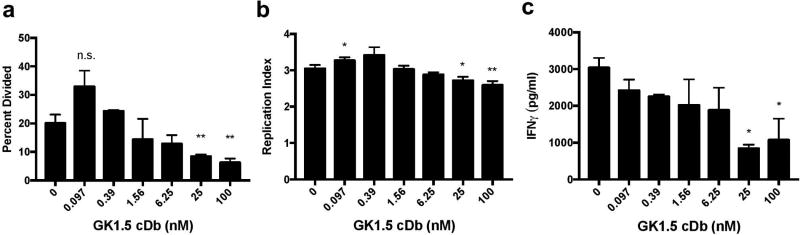
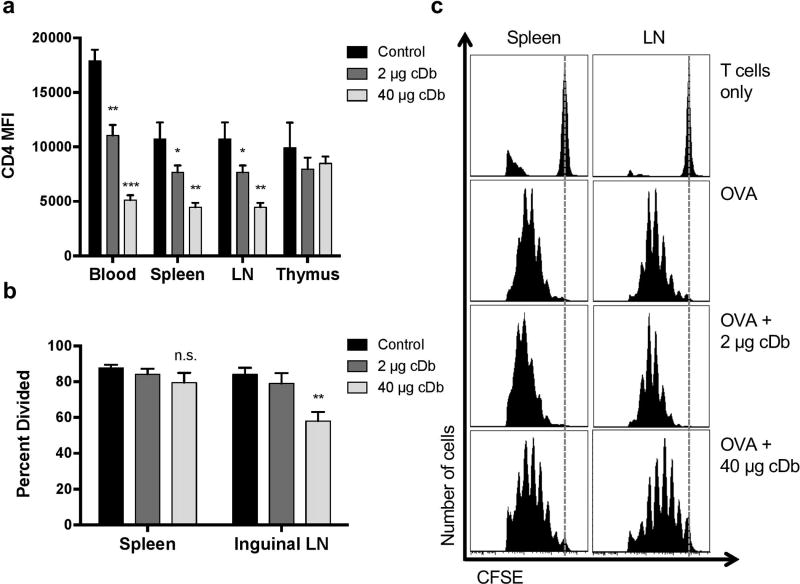
Results: For immunoPET imaging, the lowest protein dose of 2 μg of 89Zr-labeled GK1.5 cDb resulted in significantly higher % injected dose/g in inguinal lymph nodes (ILN) and spleen compared to the 12-μg protein dose. In vivo administration of GK1.5 cDb at the high dose of 40 μg caused a transient decrease in CD4 expression in spleen, blood, lymph nodes, and thymus, which recovered within 3 days postinjection; this effect was reduced, although not abrogated, when 2 μg was administered. Proliferation was inhibited in vivo in ILN but not the spleen by injection of 40 μg GK1.5 cDb. Concentrations of GK1.5 cDb in excess of 25 nM significantly inhibited CD4+ T cell proliferation and interferon-γ production in vitro. Overall, using low-dose GK1.5 cDb minimized biological effects on CD4+ T cells.

Conclusions: Low-dose GK1.5 cDb yields high-contrast immunoPET images with minimal effects on T cell biology in vitro and in vivo and may be a useful tool for investigating CD4+ T cells in the context of preclinical disease models. Future approaches to minimizing biological effects may include the creation of monovalent fragments or selecting anti-CD4 antibodies which target alternative epitopes.

Keywords: Antibody engineering; CD4; Diabody; ImmunoPET; Lymphocytes; Positron emission tomography; T cell function; T cells; Zirconium-89.


Conflict of interest statement

Conflict of Interest Statement

A. M. W. is a stockholder in and consultant to ImaginAb, Inc.

Figures

Fig 1
Fig 1. Conformation and binding capability of GK1.5 cDb
(a) Schematic depicting an intact antibody (~150 kDa) and the cys-diabody (52 kDa), including the solvent-exposed disulfide bridge which is reduced for site-specific conjugation. (b) Size exclusion chromatography of GK1.5 cDb (dashed line), soluble murine CD4 (solid line), and soluble murine CD4 in complex with GK1.5 cDb following incubation at a 2:1 molar ratio (dotted line), with elution times in minutes noted above peaks. Arrows indicate elution of markers albumin (66 kDa) at 20.0 minutes and carbonic anhydrase (29 kDa) at 24.0 minutes. (c) Affinities of intact GK1.5 Ab and GK1.5 cDb were estimated with ELISA, using immobilized soluble CD4 antigen (n=3 independent experiments; results of one representative experiment shown).
Fig 2
Fig 2. Effect of GK1.5 cDb protein dose on anti-CD4 immunoPET imaging
(a) Representative coronal and (b) transverse microPET images from 89Zr-malDFO-GK1.5 cDb dose escalation study. C57BL/6 mice were injected with 2, 6, 12, or 40 µg 89Zr-malDFO-GK1.5 cDb. Images acquired 20 hr post-injection are displayed as 25 mm (coronal) or 2 mm (transverse) maximum-intensity projections. One representative mouse from each group is shown. The 12 µg image is from a previously published study [19] and is reproduced here. Major visible lymph nodes and other organs are labeled: cervical LN (CLN), axillary LN (ALN), spleen (Sp), liver (Li), kidney (K), inguinal LN (ILN), bone (B), popliteal LN (PLN).
Fig 3
Fig 3. Ex vivo biodistribution and target:muscle ratios from 89Zr-malDFO-GK1.5 cDb dose escalation immunoPET study
(a) Following the PET scan 20 hr post-injection of probe, organs were removed, weighed, and counted to determine activity in each organ (expressed as % ID/g). Complete biodistribution data are provided in Table 1. Data for the 12 µg group are from a previously published study [19]; CT scanning was unavailable for the 12 µg group. (b) Tissue:muscle ratios for secondary lymphoid organs including spleen and axillary, inguinal, and cervical lymph nodes from biodistribution data (n=4 for 2, 6, and 40 µg protein doses; n=3 for 12 µg protein dose).
Fig 4
Fig 4. In vivo changes in cell populations and surface expression of CD4 by T cells in lymphoid organs post-administration of high-dose GK1.5 cDb
Flow cytometric analysis of T cells from mice, one or three days following intravenous administration of 40 µg GK1.5 cDb. CD4 was assayed with both PE-anti-CD4 antibody (clone RM4-4; panels a-b) and BV421-anti-CD4 antibody (clone GK1.5; panels d-e). (a, d) Change in CD4 expression by CD45+CD4+ T cells as measured by mean fluorescence intensity in mouse blood, spleen, ILN, and thymus, one or three days after GK1.5 cDb administration. (b, e) Percent of CD45+CD4+ T cells in mouse blood, spleen, ILN, and thymus, one or three days after GK1.5 cDb administration. (c) Percent of CD45+CD3+ T cells in mouse blood, spleen, ILN, and thymus, one or three days after GK1.5 cDb administration. Experimental groups were compared individually to the control untreated group (n=3–4 mice/group). * p<0.05, ** p<0.005, *** p<0.005.
Fig 5
Fig 5. In vitro effects of GK1.5 cDb on T cell proliferation and function
CFSE-labeled OT-II CD4+ T cells were cultured with OVA-pulsed splenocytes and incubated with various concentrations of GK1.5 cDb. (a) Proliferation was analyzed with flow cytometry 72 hours after addition of GK1.5 cDb, and percent divided was calculated by determining the percent of CFSE-labeled cells that divided at least once. (b) Replication index was determined by the fold-expansion of proliferative OT-II cells (n = 3 independent experiments). (c) Culture supernatant was collected at 72 hours and concentration of IFNγ was assayed (n = 2 independent experiments). All concentrations of GK1.5 cDb were compared to control well. n.s.: not significant, * p<0.05, ** p<0.005.
Fig 6
Fig 6. In vivo effects of GK1.5 cDb on T cells
(a) Change in surface CD4 expression by T cells from mice, one day following intravenous administration of 2 or 40 µg GK1.5 cDb (n=4 mice/group). Experimental groups were compared individually to control untreated group. (b) Percent OT-II cells divided in ILN and spleens of OVA-stimulated mice was assessed 72 hours after administration of GK1.5 cDb (n=3 mice/group). * p<0.05, ** p<0.005, *** p<0.0005, **** p<0.0001. Experimental groups were compared individually to control (OVA + T cells only) group. (c) Representative CFSE histograms of OVA-stimulated OT-II CD4+ T cells from spleen and ILN 72 h after administration of GK1.5 cDb. Dashed line indicates undivided cells.

Similar articles

Cited by

References

    1. Zhu J, Paul WE. CD4 T cells: fates, functions, and faults. Blood. 2008;112:1557–69. - PMC - PubMed
    1. Di Mascio M, Paik CH, Carrasquillo JA, et al. Noninvasive in vivo imaging of CD4 cells in simian-human immunodeficiency virus (SHIV)-infected nonhuman primates. Blood. 2009;114:328–37. - PMC - PubMed
    1. Byrareddy SN, Arthos J, Cicala C, et al. Sustained virologic control in SIV+ macaques after antiretroviral and α4β7 antibody therapy. Science. 2016;354:197 LP–202. - PMC - PubMed
    1. Steinhoff K, Pierer M, Siegert J, et al. Visualizing inflammation activity in rheumatoid arthritis with Tc-99 m anti-CD4-mAb fragment scintigraphy. Nucl Med Biol. 2014;41:350–4. - PubMed
    1. Becker W, Emmrich F, Horneff G, et al. Imaging rheumatoid arthritis specifically with technetium 99m CD4-specific (T-helper lymphocytes) antibodies. Eur J Nucl Med. 1990;17:156–159. - PubMed

Publication types