Tacrolimus dose requirements in paediatric renal allograft recipients are characterized by a biphasic course determined by age and bone maturation
- PMID: 27966227
- PMCID: PMC5346878
- DOI: 10.1111/bcp.13174
Tacrolimus dose requirements in paediatric renal allograft recipients are characterized by a biphasic course determined by age and bone maturation
Abstract
Aims: Despite longstanding recognition of significant age-dependent differences in drug disposition during childhood, the exact course and the underlying mechanisms are not known. Our aim was to determine the course and determinants of individual relative dose requirements, during long-term follow-up in children on tacrolimus.
Methods: This was a cohort study in a tertiary hospital with standardized annual pharmacokinetic (PK) follow-up (AUC0-12hr ) in recipients of a renal allograft (≤19 years), between 1998 and 2015. In addition, the presence of relevant pharmacogenetic variants was determined. The evolution of dose-corrected exposure was evaluated using mixed models.
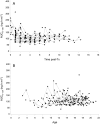
Results: A total of 184 PK visits by 43 children were included in the study (median age: 14.6). AUC0-12h corrected for dose per kg demonstrated a biphasic course: annual increase 4.4% (CI: 0.3-8.7%) until ±14 years of age, followed by 13.4% increase (CI 8.7-18.3%). Moreover, exposure corrected for dose per m2 proved stable until 14 years (+0.8% annually; CI: -3.0 to +4.8%), followed by a steep increase ≥14 years (+11%; CI: 7.0-16.0%). Analysis according to bone maturation instead of age demonstrated a similar course with a distinct divergence at TW2: 800 (P = 0.01). Genetic variation in CYP3A4, CYP3A5, and CYP3A7 was associated with altered dose requirements, independent of age.
Conclusions: Children exhibit a biphasic course in tacrolimus disposition characterized by a high and stable drug clearance until a specific phase in pubertal development (TW2: 800 at age: ±14 years), followed by an important decline in relative dose requirements thereafter. Pharmacogenetic variation demonstrated an age/puberty independent effect. We suggest a critical reappraisal of current paediatric dosing algorithms for tacrolimus and drugs with a similar disposition.
Keywords: children; drug disposition; ontogeny; pharmacokinetics; tacrolimus.
© 2016 The British Pharmacological Society.
Figures


Similar articles
-
CYP3A5 polymorphisms and their effects on tacrolimus exposure in an ethnically diverse South African renal transplant population.S Afr Med J. 2020 Jan 29;110(2):159-166. doi: 10.7196/SAMJ.2020.v110i2.13969. S Afr Med J. 2020. PMID: 32657689
-
The Effect of Weight and CYP3A5 Genotype on the Population Pharmacokinetics of Tacrolimus in Stable Paediatric Renal Transplant Recipients.Clin Pharmacokinet. 2016 Sep;55(9):1129-43. doi: 10.1007/s40262-016-0390-7. Clin Pharmacokinet. 2016. PMID: 27138785
-
Single-Nucleotide Polymorphism of CYP3A5 Impacts the Exposure to Tacrolimus in Pediatric Renal Transplant Recipients: A Pharmacogenetic Substudy of the TWIST Trial.Ther Drug Monit. 2017 Feb;39(1):21-28. doi: 10.1097/FTD.0000000000000361. Ther Drug Monit. 2017. PMID: 28030534 Clinical Trial.
-
Customizing Tacrolimus Dosing in Kidney Transplantation: Focus on Pharmacogenetics.Ther Drug Monit. 2025 Feb 1;47(1):141-151. doi: 10.1097/FTD.0000000000001289. Epub 2024 Dec 10. Ther Drug Monit. 2025. PMID: 39774592 Review.
-
Pharmacogenetic aspects of the use of tacrolimus in renal transplantation: recent developments and ethnic considerations.Expert Opin Drug Metab Toxicol. 2016 May;12(5):555-65. doi: 10.1517/17425255.2016.1170808. Epub 2016 Apr 7. Expert Opin Drug Metab Toxicol. 2016. PMID: 27010623 Review.
Cited by
-
Tacrolimus IPV Group Membership Does Not Consistently Track With Electronically Monitored or Self-reported Adherence in Adolescent and Young Adult Kidney Transplant Recipients.Transplant Direct. 2025 May 12;11(6):e1806. doi: 10.1097/TXD.0000000000001806. eCollection 2025 Jun. Transplant Direct. 2025. PMID: 40371052 Free PMC article.
-
Neonatal cytochrome P450 CYP3A7: A comprehensive review of its role in development, disease, and xenobiotic metabolism.Arch Biochem Biophys. 2019 Sep 30;673:108078. doi: 10.1016/j.abb.2019.108078. Epub 2019 Aug 22. Arch Biochem Biophys. 2019. PMID: 31445893 Free PMC article. Review.
-
Evaluating the Impact of CYP3A5 Genotype on Post-Transplant Healthcare Resource Utilization in Pediatric Renal and Heart Transplant Recipients Receiving Tacrolimus.Pharmgenomics Pers Med. 2021 Mar 12;14:319-326. doi: 10.2147/PGPM.S285444. eCollection 2021. Pharmgenomics Pers Med. 2021. PMID: 33746516 Free PMC article.
-
Investigating Tacrolimus Disposition in Paediatric Patients with a Physiologically Based Pharmacokinetic Model Incorporating CYP3A4 Ontogeny, Mechanistic Absorption and Red Blood Cell Binding.Pharmaceutics. 2023 Aug 29;15(9):2231. doi: 10.3390/pharmaceutics15092231. Pharmaceutics. 2023. PMID: 37765200 Free PMC article.
-
Clinical aspects of tacrolimus use in paediatric renal transplant recipients.Pediatr Nephrol. 2019 Jan;34(1):31-43. doi: 10.1007/s00467-018-3892-8. Epub 2018 Feb 26. Pediatr Nephrol. 2019. PMID: 29479631 Review.
References
-
- Krischock LA, van Stralen KJ, Verrina E, Tizard EJ, Bonthuis M, Reusz G, et al. Anemia in children following renal transplantation – results from the ESPN/ERA‐EDTA Registry. Pediatr Nephrol 2016; 31: 325–333. - PubMed
-
- Smith JM, Martz K, Blydt‐Hansen TD. Pediatric kidney transplant practice patterns and outcome benchmarks, 1987–2010: a report of the North American Pediatric Renal Trials and Collaborative Studies. Pediatr Transplant 2013; 17: 149–157. - PubMed
MeSH terms
Substances
LinkOut - more resources
Full Text Sources
Other Literature Sources
Medical
Molecular Biology Databases

