Multiple alleles at a single locus control seed dormancy in Swedish Arabidopsis
- PMID: 27966430
- PMCID: PMC5226650
- DOI: 10.7554/eLife.22502
Multiple alleles at a single locus control seed dormancy in Swedish Arabidopsis
Abstract
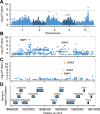
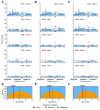
Seed dormancy is a complex life history trait that determines the timing of germination and is crucial for local adaptation. Genetic studies of dormancy are challenging, because the trait is highly plastic and strongly influenced by the maternal environment. Using a combination of statistical and experimental approaches, we show that multiple alleles at the previously identified dormancy locus DELAY OF GERMINATION1 jointly explain as much as 57% of the variation observed in Swedish Arabidopsis thaliana, but give rise to spurious associations that seriously mislead genome-wide association studies unless modeled correctly. Field experiments confirm that the major alleles affect germination as well as survival under natural conditions, and demonstrate that locally adaptive traits can sometimes be dissected genetically.
Keywords: a. thaliana; Arabidopsis; DOG1; evolutionary biology; genetic architecture; genomics; germination; life history; local adaptation; plant biology; seed dormancy.
Conflict of interest statement
MN: Reviewing editor, eLife. The other authors declare that no competing interests exist.
Figures


Similar articles
-
Early life stages contribute strongly to local adaptation in Arabidopsis thaliana.Proc Natl Acad Sci U S A. 2016 Jul 5;113(27):7590-5. doi: 10.1073/pnas.1606303113. Epub 2016 Jun 21. Proc Natl Acad Sci U S A. 2016. PMID: 27330113 Free PMC article.
-
Maternal environment affects the genetic basis of seed dormancy in Arabidopsis thaliana.Mol Ecol. 2015 Feb;24(4):785-97. doi: 10.1111/mec.13061. Epub 2015 Feb 4. Mol Ecol. 2015. PMID: 25640699
-
Genetic basis of adaptation in Arabidopsis thaliana: local adaptation at the seed dormancy QTL DOG1.Evolution. 2012 Jul;66(7):2287-302. doi: 10.1111/j.1558-5646.2012.01590.x. Epub 2012 Feb 28. Evolution. 2012. PMID: 22759302
-
Regulation of seed dormancy by histone post-translational modifications in the model plant Arabidopsis thaliana.J Exp Bot. 2024 Oct 16;75(19):6159-6166. doi: 10.1093/jxb/erae236. J Exp Bot. 2024. PMID: 38769701 Review.
-
Parental and Environmental Control of Seed Dormancy in Arabidopsis thaliana.Annu Rev Plant Biol. 2022 May 20;73:355-378. doi: 10.1146/annurev-arplant-102820-090750. Epub 2022 Feb 9. Annu Rev Plant Biol. 2022. PMID: 35138879 Review.
Cited by
-
Locally adaptive temperature response of vegetative growth in Arabidopsis thaliana.Elife. 2022 Jul 29;11:e77913. doi: 10.7554/eLife.77913. Elife. 2022. PMID: 35904422 Free PMC article.
-
Dormancy heterogeneity among Arabidopsis thaliana seeds is linked to individual seed size.Plant Commun. 2024 Feb 12;5(2):100732. doi: 10.1016/j.xplc.2023.100732. Epub 2023 Oct 12. Plant Commun. 2024. PMID: 37828740 Free PMC article.
-
Antisense transcription represses Arabidopsis seed dormancy QTL DOG1 to regulate drought tolerance.EMBO Rep. 2017 Dec;18(12):2186-2196. doi: 10.15252/embr.201744862. Epub 2017 Oct 13. EMBO Rep. 2017. PMID: 29030481 Free PMC article.
-
Natural variation at XND1 impacts root hydraulics and trade-off for stress responses in Arabidopsis.Nat Commun. 2018 Sep 24;9(1):3884. doi: 10.1038/s41467-018-06430-8. Nat Commun. 2018. PMID: 30250259 Free PMC article.
-
Aethionema arabicum: a novel model plant to study the light control of seed germination.J Exp Bot. 2019 Jun 28;70(12):3313-3328. doi: 10.1093/jxb/erz146. J Exp Bot. 2019. PMID: 30949700 Free PMC article.
References
-
- Alonso-Blanco C, Bentsink L, Hanhart CJ, Blankestijn-de Vries H, Koornneef M. Analysis of natural allelic variation at seed dormancy loci of arabidopsis thaliana. Genetics. 2003;164:711–729. http://www.ncbi.nlm.nih.gov/pubmed/12807791 - PMC - PubMed
-
- Amiguet-Vercher A, Santuari L, Gonzalez-Guzman M, Depuydt S, Rodriguez PL, Hardtke CS. The IBO germination quantitative trait locus encodes a phosphatase 2C-related variant with a nonsynonymous amino acid change that interferes with abscisic acid signaling. New Phytologist. 2015;205:1076–1082. doi: 10.1111/nph.13225. - DOI - PubMed
-
- Atwell S, Huang YS, Vilhjálmsson BJ, Willems G, Horton M, Li Y, Meng D, Platt A, Tarone AM, Hu TT, Jiang R, Muliyati NW, Zhang X, Amer MA, Baxter I, Brachi B, Chory J, Dean C, Debieu M, de Meaux J, Ecker JR, Faure N, Kniskern JM, Jones JD, Michael T, Nemri A, Roux F, Salt DE, Tang C, Todesco M, Traw MB, Weigel D, Marjoram P, Borevitz JO, Bergelson J, Nordborg M. Genome-wide association study of 107 phenotypes in arabidopsis thaliana inbred lines. Nature. 2010;465:627–631. doi: 10.1038/nature08800. - DOI - PMC - PubMed
-
- Beleza S, Johnson NA, Candille SI, Absher DM, Coram MA, Lopes J, Campos J, Araújo II, Anderson TM, Vilhjálmsson BJ, Nordborg M, Correia E Silva A, Shriver MD, Rocha J, Barsh GS, Tang H. Genetic architecture of skin and eye color in an African-European admixed population. PLoS Genetics. 2013;9:e1003372. doi: 10.1371/journal.pgen.1003372. - DOI - PMC - PubMed
Publication types
MeSH terms
Grants and funding
LinkOut - more resources
Full Text Sources
Other Literature Sources
Research Materials

