. 2016 Dec 14:7:13885.
doi: 10.1038/ncomms13885.

Osteoblasts secrete Cxcl9 to regulate angiogenesis in bone

Affiliations

Osteoblasts secrete Cxcl9 to regulate angiogenesis in bone

Bin Huang et al. Nat Commun. .

Erratum in

Abstract

Communication between osteoblasts and endothelial cells (ECs) is essential for bone turnover, but the molecular mechanisms of such communication are not well defined. Here we identify Cxcl9 as an angiostatic factor secreted by osteoblasts in the bone marrow microenvironment. We show that Cxcl9 produced by osteoblasts interacts with vascular endothelial growth factor and prevents its binding to ECs and osteoblasts, thus abrogating angiogenesis and osteogenesis both in mouse bone and in vitro. The mechanistic target of rapamycin complex 1 activates Cxcl9 expression by transcriptional upregulation of STAT1 and increases binding of STAT1 to the Cxcl9 promoter in osteoblasts. These findings reveal the essential role of osteoblast-produced Cxcl9 in angiogenesis and osteogenesis in bone, and Cxcl9 can be targeted to elevate bone angiogenesis and prevent bone loss-related diseases.


Figures

Figure 1
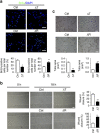
Figure 1. Alteration of mTORC1 activity in osteoblasts affects angiogenesis in mouse bone.
(a) Representative images of immunostaining of pS6 (Ser235/236) and osteocalcin (Ocn) in 12-week-old male mice bone. Scale bar, 50 μm. (b) Photograph of hindlimbs of 6-week-old male ΔTsc1 (ΔT) and ΔRaptor (ΔR) mice and their littermate controls (Ctrl). Scale bar, 1 cm. (c) Representative images of CD31+EMCN+ microvessels and quantitative analysis of type H microvessel density in femur sections of 12-week-old male mice. Scale bar, 100 μm. n=9 per group. (d) Consistent numbers of CD31+ vessels in surrounding muscle of mouse bone. Scale bar, 100 μm. Data are shown as mean±s.d. n=9 per group. Data are shown as mean±s.d. *P<0.05, **P<0.01 (Student's t-test). For all panels in this figure, data are representative for three independent experiments.
Figure 2
Figure 2. Alteration of mTORC1 activity in osteoblasts affects angiogenesis in vitro.
(a) Representative confocal images of immunostaining of BrdU (green) in HUVECs and quantitative analysis of BrdU+ cells over total cells. Scale bar, 50 μm. n=9 per group. (b) Representative photomicrographs of wounds in HUVECs at 0 h and after 18 h; dotted lines highlight the linear scratch/wound for each group of cells. The bar graph shows the mean percentage of wound closure. Scale bar, 200 μm. n=9 per group. (c) Representative photomicrographs of tube formation of HUVECs incubated with Matrigel and quantitative analysis of tube area. Scale bar, 200 μm. n=9 per group. Data are shown as mean±s.d. *P<0.05, **P<0.01 (Student's t-test). For all panels in this figure, data are representative for three independent experiments. Ctrl, control.
Figure 3
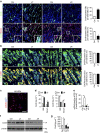
Figure 3. Regulation of VEGF in osteoblasts by mTORC1 does not explain the vascular phenotypes of mutant mouse bone.
(a) Representative images of immunostaining of VEGF and Ocn in 12-week-old male mice bone and quantitative analysis of VEGF+ osteoblasts compared with total osteoblasts. Scale bar, 50 μm. n=9 per group. (b) Representative images of immunostaining of CD31, KDR and pKDR (Y1175) in 12-week-old male mice bone, and quantitative analysis of KDR+ and pKDR+ ECs compared with total ECs in bone marrow. Scale bar, 50 μm. (c) Western blot of VEGF in primary osteoblasts. (d) Western blot of phosphorylation of KDR, PLCγ1 and ERK1/2 in HUVECs treated with CM from primary osteoblasts for 10 min. Data are shown as mean±s.d. *P<0.05, **P<0.01 (Student's t-test). Ctrl, control.
Figure 4
Figure 4. mTORC1 regulates Cxcl9 in osteoblasts.
(a) Representative images of in situ hybridization of Cxcl9 mRNA in conjunction with immunostaining of Runx2 in femur sections of 12-week-old male mice bone. Boxed area is enlarged in the bottom right corner. Cxcl9+ osteoblasts out of total osteoblasts were also quantified. Scale bar, 50 μm. n=9 per group. (b) Representative photomicrographs of immunostaining of CXCR3 in CD31+ ECs in bone marrow and quantitative analysis of CXCR3+ ECs out of total ECs in 12-week-old male mice bone. Scale bar, 50 μm. n=9 per group. (c) Representative photomicrographs of immunostaining of CXCR3 in cultured HUVECs. Scale bar, 100 μm. (d) Cxcl9 concentrations assessed by ELISA in bone marrow (BM) and serum. n=5 per group. (e) Quantitative PCR analysis of Cxcl9 mRNA in primary osteoblasts. (f) Western blot of Cxcl9 in primary osteoblasts. (g) Concentrations of Cxcl9 in CM of primary osteoblasts assessed by ELISA. n=5 per group. Data are shown as mean±s.d. *P<0.05, **P<0.01 (Student's t-test). Ctrl, control.
Figure 5
Figure 5. Cxcl9 is responsible for vascular phenotypes in mutant mouse bone.
(a) Representative confocal images of microvessels immunostained by CD31 and EMCN, and quantitative analysis of microvessel density in tibia sections of ΔTsc1 mice administered with Cxcl9 antibody (Ab) and ΔRaptor mice injected with Cxcl9 subcutaneously. Scale bar, 100 μm. n=9 per group. (b) Representative Matrigel tube formation assay images and quantitative analysis of tube area with cultures of HUVECs using CM with or without addition of Cxcl9 or Cxcl9-neutralizing antibody as indicated. Scale bar, 100 μm. n=9 per group. (c) Western blot of phosphorylation of KDR, PLCγ1 and ERK1/2 in HUVECs treated with CM from primary osteoblasts with or without addition of Cxcl9 or Cxcl9-neutralizing antibody as indicated for 10 min. Data are shown as mean±s.d. *P<0.05, **P<0.01 (Student's t-test). Ctrl, control.
Figure 6
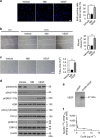
Figure 6. Cxcl9 antagonizes VEGF signalling transduction in ECs by interacting with VEGF and preventing its binding to ECs.
(a) Representative confocal images of immunostaining of BrdU (green) in HUVECs and quantitative analysis of BrdU+ cells over total cells. Scale bar, 100 μm. n=9 per group. (b) Representative photomicrographs of wounds in HUVECs at 0 h and after 18 h; dotted lines highlight the linear scratch/wound for each group of cells. The bar graph shows the mean percentage of wound closure. Scale bar, 200 μm. n=9 per group. (c) Representative photomicrographs of tube formation of HUVECs incubated with Matrigel and quantitative analysis of tube area. Scale bar, 200 μm. n=9 per group. (d) Western blot of phosphorylation of Akt (S473), Src (Y416), KDR, PLCγ1 and ERK1/2 in HUVECs treated with ΔTsc1 CM with or without addition of NBI-74330 (CXCR3 antagonist) or VEGF as indicated for 10 min. (e) Recombinant mouse Cxcl9 and VEGF164 were mixed and immunoprecipitated with anti-Cxcl9 antibody and examined by immunoblotting with an anti-VEGF antibody. (f) Binding of 125I–VEGF164 to ECs in the presence of increasing concentrations of Cxcl9. Shown is the specific binding, which was calculated by subtracting the nonspecific binding from the total binding. Data are shown as mean±s.d. **P<0.01 (Student's t-test).
Figure 7
Figure 7. Cxcl9 suppresses osteogenesis by interacting with VEGF and abrogating binding of VEGF to osteoblasts.
(a) BrdU staining of MC3T3-E1 cells and quantitative analysis of BrdU+ cells out of total cells. Scale bar, 100 μm. (b) Western blot analysis of osteoblastic marker Ocn and Runx2 expression in MC3T3-E1 cells on the seventh day of osteogenic induction. (c) Alizarin red staining of differentiated MC3T3-E1 cells on the fourteenth day. Scale bar, 1 cm. (d) Binding of 125I–VEGF164 to MC3T3-E1 cells in the presence of increasing concentrations of Cxcl9. Shown is the specific binding, which was calculated by subtracting the nonspecific binding from the total binding. Data are shown as mean±s.d. *P<0.05, **P<0.01 (Student's t-test).
Figure 8
Figure 8. mTORC1 regulates CXCL9 in osteoblasts via STAT1.
(a) Quantitative PCR (qPCR) analysis of STAT1 mRNA in primary osteoblasts. n=3 per group. Data are shown as mean±s.d. *P<0.05 (Student's t-test). (b) Western blot of total STAT1 protein and phosphorylation (Y701 and S727) of STAT1 in primary osteoblasts. (c) Representative confocal images show subcellular location of STAT1 (red) in primary osteoblasts. (d) Control and ΔTsc1 (ΔT) primary osteoblasts were treated with S6K1 siRNA and negative control (NC) for 48 h and then immunoblotting was carried out to detect STAT1 expression. (e) Cultured primary calvarial cells were immunoprecipitated with anti-mTOR antibody and the precipitated mTOR was assayed for kinase activity against recombinant glutathione S-transferase (GST)-tagged full-length STAT1. (f) Nuclear extracts from primary ΔTsc1 (T), ΔRaptor (R) and control (C) osteoblasts were analysed for binding of STAT1 to Cxcl9 promoter using EMSA. Binding of STAT1 to biotin-labelled DNA probes is shown as ‘STAT1 complex'. To compete with the binding, an unlabelled STAT1-binding-site DNA probe was added to the reaction in 200 times molar excess. Adding anti-STAT1 antibody to the reactions caused a reduction of STAT1-DNA binding and bands of supershift. (g) Control and ΔTsc1 primary osteoblasts were treated with STAT1 siRNA and NC for 48 h and then immunoblotting was carried out to detect Cxcl9 expression. Ctrl, control.
Figure 9
Figure 9. Model of Cxcl9 secreted by osteoblasts in regulating angiogenesis and osteogenesis in bone.
Cxcl9 expression is positively regulated by mTORC1 and downstream STAT1 in osteoblasts. Cxcl9 binds with VEGF, prevents VEGF from binding to its receptors, blocks VEGF signalling transduction in ECs and thus inhibits angiogenesis in bone. In addition, Cxcl9 suppresses osteogenesis by interacting with VEGF and abrogating its binding to osteoblasts. IFN-γ, interferon-gamma.

References

    1. Magne D. et al.. Cartilage formation in growth plate and arteries: from physiology to pathology. BioEssays 27, 708–716 (2005). - PubMed
    1. Mark H., Penington A., Nannmark U., Morrison W. & Messina A. Microvascular invasion during endochondral ossification in experimental fractures in rats. Bone 35, 535–542 (2004). - PubMed
    1. Zvaifler N. J. et al.. Mesenchymal precursor cells in the blood of normal individuals. Arthritis Res. 2, 477–488 (2000). - PMC - PubMed
    1. Maes C. et al.. Osteoblast precursors, but not mature osteoblasts, move into developing and fractured bones along with invading blood vessels. Dev. Cell 19, 329–344 (2010). - PMC - PubMed
    1. Sacchetti B. et al.. Self-renewing osteoprogenitors in bone marrow sinusoids can organize a hematopoietic microenvironment. Cell 131, 324–336 (2007). - PubMed

Publication types

MeSH terms