. 2016 Dec 14:7:13710.
doi: 10.1038/ncomms13710.

Targeting LOXL2 for cardiac interstitial fibrosis and heart failure treatment

Affiliations

Targeting LOXL2 for cardiac interstitial fibrosis and heart failure treatment

Jin Yang et al. Nat Commun. .

Abstract

Interstitial fibrosis plays a key role in the development and progression of heart failure. Here, we show that an enzyme that crosslinks collagen-Lysyl oxidase-like 2 (Loxl2)-is essential for interstitial fibrosis and mechanical dysfunction of pathologically stressed hearts. In mice, cardiac stress activates fibroblasts to express and secrete Loxl2 into the interstitium, triggering fibrosis, systolic and diastolic dysfunction of stressed hearts. Antibody-mediated inhibition or genetic disruption of Loxl2 greatly reduces stress-induced cardiac fibrosis and chamber dilatation, improving systolic and diastolic functions. Loxl2 stimulates cardiac fibroblasts through PI3K/AKT to produce TGF-β2, promoting fibroblast-to-myofibroblast transformation; Loxl2 also acts downstream of TGF-β2 to stimulate myofibroblast migration. In diseased human hearts, LOXL2 is upregulated in cardiac interstitium; its levels correlate with collagen crosslinking and cardiac dysfunction. LOXL2 is also elevated in the serum of heart failure (HF) patients, correlating with other HF biomarkers, suggesting a conserved LOXL2-mediated mechanism of human HF.


Conflict of interest statement

C.-P.C. consults for Gilead Sciences, Inc. The remaining authors declare no competing financial interests.

Figures

Figure 1
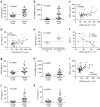
Figure 1. LOXL2 correlates with cardiac dysfunction in both mouse model and human patients.
(a) Quantification of Loxl2 mRNA expression in the heart 1–10 weeks after sham/TAC operation. n=4–5 mice per group. P value: Student's t-test. Error bar: standard error of the mean (s.e.m.). (b) Western blot analysis of Loxl2 protein in the mice heart ventricles 1–7 weeks after sham/TAC operation. P value: Student's t-test. Error bar: s.e.m. (c) Representative immunostaining of Loxl2 in the heart 1, 2 and 7 weeks after sham/TAC operation. Scale bars, 100 μm. Blue: haematoxylin. Brown: Loxl2. (d) Representative immunostaining of Col1A and α-SMA in the heart 1 week after sham/TAC operation. Scale bars, 100 μm. Blue: haematoxylin. Brown: Col1A/α-SMA. (eg) Determination of total, soluble and insoluble collagen content of left ventricles from sham- or TAC-operated mice 1, 2 and 10 weeks after the procedure (n=5 in each group). The amounts of total and soluble collagen were determined by measuring hydroxyproline content of total and pepsin-acid solubilized left ventricles, respectively. The amount of insoluble collagen was calculated by subtracting the amount of soluble collagen from total collagen. (h) Correlation of left ventricular fractional shortening (LVFS) with the insoluble collagen content of left ventricles after sham or TAC operation (n=5 per group). r: Pearson coefficient. (ik) mRNA quantification of LOX genes in ventricular tissues of healthy human donor hearts (n=8; i) or from patients with ischaemic (n=8; j) or idiopathic dilated (n=10; k) cardiomyopathy. IDCM, idiopathic dilated cardiomyopathy. P value: Student's t-test. Error bar: s.e.m. (l) Immunostaining of LOXL2 (brown) in human heart tissues obtained from control subjects and patients with ischaemic (ISCH) or idiopathic dilated cardiomyopathy (IDCM). Scale bars, 20 μm. Blue: haematoxylin. Brown: Loxl2. (m,n) Correlation of the mRNA level of LOXL2 with COL1A (m) and COL3A (n) in the ventricular tissues of patients with idiopathic dilated cardiomyopathy (IDCM). r: Pearson coefficient. Black circles: cardiomyopathy tissues (n=10). Open circles: control heart tissues (n=8).
Figure 2
Figure 2. Serum LOXL2 as a biomarker for HFrEF and HFpEF.
(a) Serum LOXL2 was measured by a customized ELISA-based assay. The red-dashed line represents a cutoff level of LOXL2 at 90 pg ml−1. The mean of each group is indicated by a horizontal line in the graph. *P<0.05 using unpaired Student's t-test. (b) Plasma NT-proBNP level was measured by Luminex. The red-dashed line represents a cutoff level of NT-proBNP at 225 pg ml−1. The mean of each group is indicated by a horizontal line in the graph. *P<0.05 using unpaired Student's t-test. (c) Correlation between serum LOXL2 and TIMP-1 measured by ELISA. The two-tailed P value for Pearson correlation was calculated using GraphPad Prism. (d) Correlation between serum LOXL2 and ST-2 measured by ELISA. The two-tailed P value for Pearson correlation was calculated using GraphPad Prism. (e) Serum LOXL2 versus post-LVAD EF ≤35% and ≥40%. LVAD: left ventricular assist device. The mean of each group is indicated by a horizontal line in the graph. *P<0.05 using unpaired Student's t-test. (f) Serum LOXL2 versus the degree of EF recovery of patients following LVAD therapy. The red-dashed line represents a cutoff level of LOXL2 at 100 pg ml−1. The two-tailed P value for Pearson correlation was calculated using GraphPad Prism. (g) Serum LOXL2 measured in HFpEF patients. The red-dashed line represents a cutoff level of LOXL2 at 90 pg ml−1. The mean of each group is indicated by a horizontal line in the graph. *P<0.05 using unpaired Student's t-test. (h) Plasma NT-proBNP level was measured by Luminex in HFpEF patients. The red-dashed line represents a cutoff level of NT-proBNP at 225 pg ml−1. The mean of each group is indicated by a horizontal line in the graph. *P<0.05 using unpaired Student's t-test. (i) Correlation between serum LOXL2 and TIMP-1 measured by ELISA. (j,k) Serum troponin I level in HFrEF (j) and HFpEF (k). The mean of each group is indicated by a horizontal line in the graph. *P<0.05 using unpaired Student's t-test.
Figure 3
Figure 3. LOXL2 correlates with collagen crosslinking and diastolic abnormalities in HFpEF.
(a,b) Immunostaining of LOXL2 (a) and COL1A (b) in heart tissues of control subjects and HfpEF patients. Scale bars, 100 μm. Blue: haematoxylin. Brown: LOXL2 (a) or COL1A (b). (ce) Correlation of crosslinked collagen with echocardiographic E/E′ ratio (c), left ventricular end-diastolic pressure (LVEDP, d) and LOXL2 (e). r: Pearson coefficient. (fh) Correlation of LOXL2 level with COL1A (f), echocardiographic E/E′ ratio (g) and left ventricular end-diastolic pressure (LVEDP, h) in human studies. r: Pearson coefficient.
Figure 4
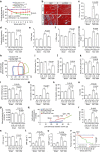
Figure 4. LOXL2 inhibition reduces interstitial fibrosis and reverses heart abnormalities.
(a) Time course of left ventricular fractional shortening changes after sham/TAC operation with IgG1 or α-LOXL2 antibody treatment. i.p.: intraperitoneal injection. P value: Student's t-test. Error bar: s.e.m. (b,c) Trichrome staining (b) and quantification (c) of cardiac interstitial fibrosis in IgG1 or α-LOXL2-treated mice 10 weeks (10W) after sham or TAC operation. Scale bars, 100 μm. Red: cardiomyocytes. Blue: fibrosis. (df) Echocardiographic measurement of left ventricular fractional shortening (d), left ventricular internal diameter at systole (LVIDs, e) and at diastole (LVIDd, f) after 10 weeks of TAC. P-value: Student's t-test. Error bar: s.e.m. (g) Ventricle–body weight ratio of hearts harvested 10 weeks after sham or TAC operation. P value: Student's t-test. Error bar: s.e.m. (h) Representative cardiac pressure–volume relationships of IgG1- or α-LOXL2-treated mice 10 weeks after sham or TAC operation. (ip) Quantification of ejection fraction (i), stroke volume (j), stroke work (k) and preload-adjusted maximal power (plPwr, l), end-systolic volume (m), end-diastolic volume (n), isovolumic relaxation time constant Tau (o) and maximal diastolic dp/dt (p) of IgG1- or α-LOXL2-treated mice 10 weeks after sham or TAC operation. P value: Student's t-test. Error bar: s.e.m. (q) Diastolic pressure–volume relationships of IgG1- or α-LOXL2-treated mice 10 weeks after sham or TAC operation. (ru) End-diastolic pressure (EDP, r), cardiac output (s), serum brain natriuretic peptide (BNP, t) and serum tissue inhibitor of metalloproteinase 1 (TIMP1, u) of IgG1- or α-LOXL2-treated mice 10 weeks after sham or TAC operation. P value: Student's t-test. Error bar: s.e.m. (v) LOXL2 antibody significantly reduces mortality in TAC-operated mice. Data were analysed with Kaplan–Meier tests.
Figure 5
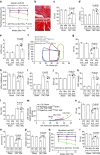
Figure 5. LOXL2 gene deletion improves cardiac function of stressed hearts in mice.
(a) Cardiac fractional shortening changes of ActinCreERT;Loxl2fl/fl KO mice over 10 weeks (10W) after TAC. Ctrl: ActinCreERT; Loxl2fl/+, Loxl2fl/fl or Loxl2fl/+. KO: ActinCreERT; Loxl2fl/fl. (b) Cardiac interstitial fibrosis detected by Masson's trichrome staining in Ctrl or Loxl2-null mice 10 weeks after sham or TAC operation. Scale bars, 100 μm. Red: cardiomyocytes. Blue: fibrosis. (blue: collagen staining). (ce) Echocardiographic measurement of left ventricular fractional shortening (c), left ventricular internal diameter at diastole (LVIDd, d) and at systole (LVIDs, e) after 10 weeks of TAC. P value: Student's t-test. Error bar: s.e.m. (f) Representative cardiac PV-Loop of Ctrl or Loxl2-null mice 10 weeks after sham or TAC operation. (gp) Quantification of ejection fraction (g), preload-adjusted maximal power (plPwr, h), end-systolic volume (i), end-diastolic volume (j), end-diastolic pressure (k), isovolumic relaxation time constant Tau (l), diastolic pressure–volume relationships (m), stroke volume (n), cardiac output (o) and stroke work (p) of Ctrl or Loxl2-null mice 10 weeks after sham or TAC operation. P value: Student's t-test. Error bar: s.e.m. (q,r) Cardiac fractional shortening changes of iTcf21CreERT; Loxl2fl/fl mutant mice over 10 weeks after TAC (q), and quantification of fractional shortening at 10 weeks after TAC (r). Ctrl: iTcf21CreERT; Loxl2fl/+, Loxlfl/fl or Loxlfl/+. Mut: iTcf21CreERT; Loxl2fl/fl. P value: Student's t-test. Error bar: s.e.m.
Figure 6
Figure 6. LOXL2 acts with TGF-β through PI3K/ATK/mTORC1 signalling to control myofibroblast transformation and migration.
(a) Western blot analysis of LOXL2, SMAD2, p-SMAD2 and GAPDH in human primary cardiac fibroblasts transfected with control (Ctrl) or LOXL2 siRNA. (b) Quantification of TGF-β isoforms in the culture media of human primary cardiac fibroblasts transfected with control or LOXL2 siRNA (n=4). P value: Student's t-test. Error bar: s.e.m. (c) Changes of COLA1, α-SMA and FN1 mRNA in human primary cardiac fibroblasts transfected with control (Ctrl) or LOXL2 siRNA. (d) Western blot of LOXL2, p-AKT, AKT, p-S6K, S6K and p-4E-BP1 with or without PI3K inhibitors LY294002/PI828 (10 μM each), PI3Kα inhibitors A66/BYL719 and mTORC1 inhibitor Rapamycine (0.1 μM) in cells infected with Ad_GFP/Ad_LOXL2. (e) TGF-β2 protein in the culture media (n=4). P value: Student's t-test. Error bar: s.e.m. (f,g) Western blot (f) and quantification (g) of TGF-β2 protein in the mice heart ventricles 6 weeks after sham/TAC operation. n=4 mice per group. P value: Student's t-test. Error bar: s.e.m. (h) A signalling cascade from LOXL2 to PI3K/AKT/mTORC1 to TGF-β2 translation. (i) Representative phase-contrast image of human primary cardiac fibroblasts 72 h after transfection with control (Ctrl) or LOXL2 siRNA. Scale bars, 50 μm. (j) Immunostaining of Col1A in IgG1- or α-LOXL2-treated mice 10 weeks (10W) after sham or TAC operation. Scale bars, 100 μm. Blue: haematoxylin. Brown: Col1A. (k,l) Gap closure assay of fibroblast migration in control, TGF-β2, α-LOXL2 (k) groups and quantification of cells migrating into the gap (l). Scale bars, 200 μm. n=5–10, P value: Student's t-test. Error bar: s.e.m.
Figure 7
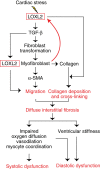
Figure 7. Working model.
A working model of how cardiac stress activates LOXL2 to trigger myofibroblast transformation, collagen synthesis, collagen crosslinking and myofibroblast migration, leading to diffuse ventricular fibrosis and dysfunction.

References

    1. Go A. S. et al.. Heart disease and stroke statistics--2014 update: a report from the American Heart Association. Circulation 129, e28–e292 (2014). - PMC - PubMed
    1. Schelbert E. B., Fonarow G. C., Bonow R. O., Butler J. & Gheorghiade M. Therapeutic targets in heart failure: refocusing on the myocardial interstitium. J. Am. Coll. Cardiol. 63, 2188–2198 (2014). - PubMed
    1. Butler J. et al.. Developing therapies for heart failure with preserved ejection fraction: current state and future directions. JACC Heart Fail. 2, 97–112 (2014). - PMC - PubMed
    1. Davis J. & Molkentin J. D. Myofibroblasts: trust your heart and let fate decide. J. Mol. Cell. Cardiol. 70, 9–18 (2014). - PMC - PubMed
    1. Kong P., Christia P. & Frangogiannis N. G. The pathogenesis of cardiac fibrosis. Cell. Mol. Life Sci. 71, 549–574 (2014). - PMC - PubMed

Publication types