. 2016 Dec 14:7:13717.
doi: 10.1038/ncomms13717.

Evaluating the convergence between eddy-covariance and biometric methods for assessing carbon budgets of forests

Affiliations

Evaluating the convergence between eddy-covariance and biometric methods for assessing carbon budgets of forests

M Campioli et al. Nat Commun. .

Abstract

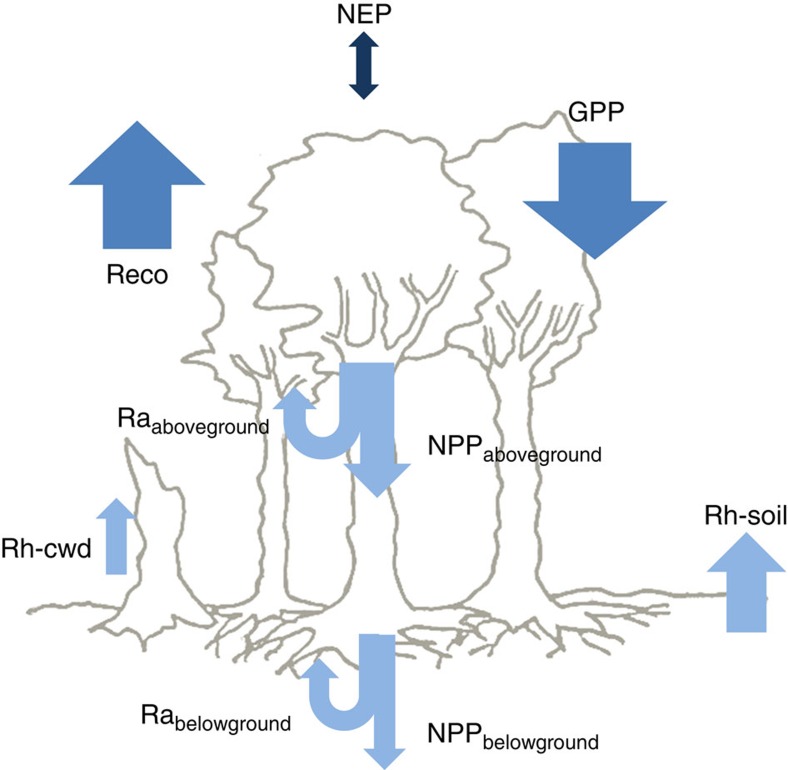
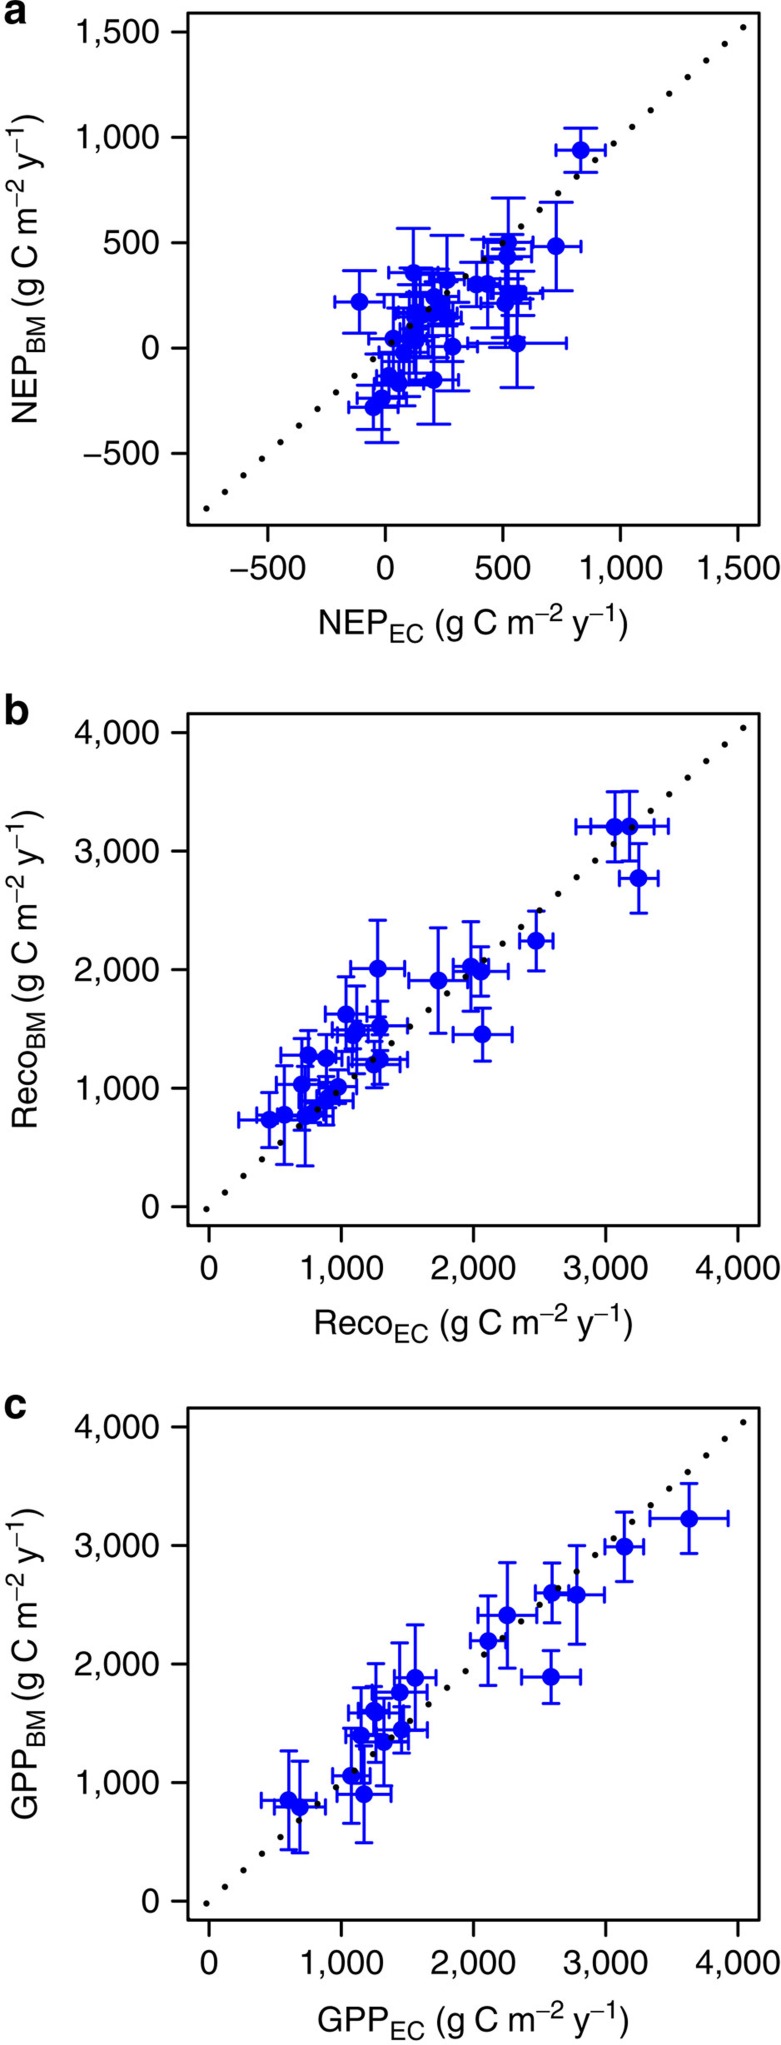
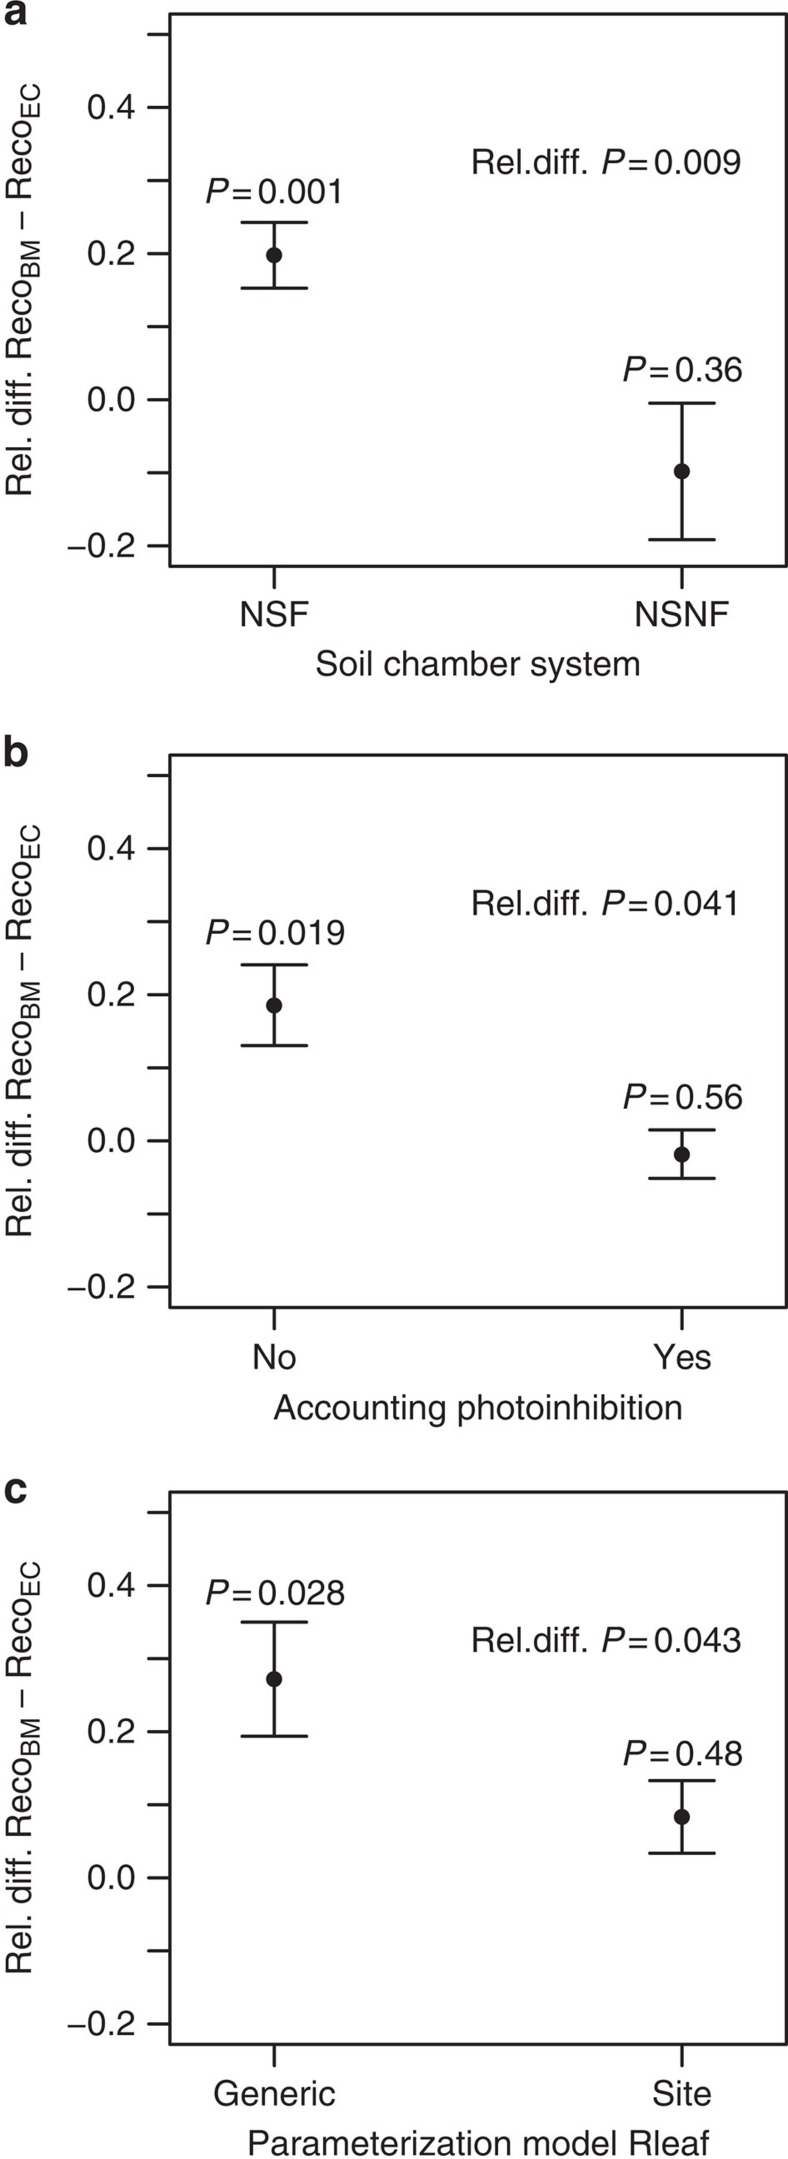
The eddy-covariance (EC) micro-meteorological technique and the ecology-based biometric methods (BM) are the primary methodologies to quantify CO2 exchange between terrestrial ecosystems and the atmosphere (net ecosystem production, NEP) and its two components, ecosystem respiration and gross primary production. Here we show that EC and BM provide different estimates of NEP, but comparable ecosystem respiration and gross primary production for forest ecosystems globally. Discrepancies between methods are not related to environmental or stand variables, but are consistently more pronounced for boreal forests where carbon fluxes are smaller. BM estimates are prone to underestimation of net primary production and overestimation of leaf respiration. EC biases are not apparent across sites, suggesting the effectiveness of standard post-processing procedures. Our results increase confidence in EC, show in which conditions EC and BM estimates can be integrated, and which methodological aspects can improve the convergence between EC and BM.


Figures

Figure 1
Figure 1. Schematic representation of the major components of the forest carbon cycle.
Raaboveground and Rabelowground: above- and belowground autotrophic respiration, respectively (their sum is indicated as Ra); Rh-soil and Rh-cwd: heterotrophic respiration from soil and coarse woody debris, respectively (their sum is indicated as Rh); NPPaboveground and NPPbelowground: above- and belowground net primary production, respectively (their sum is indicated as NPP); Reco: ecosystem respiration (Reco=Ra+Rh); GPP: gross primary production (GPP=NPP+Ra), and NEP: net ecosystem production (NEP=GPP−Reco=NPP−Rh). Each flux is associated with an arrow. Arrows pointing down indicate carbon (C) uptake, arrows pointing up indicate C release, whereas the up-down arrow indicates that both C release and C uptake can occur. The dark blue arrow indicates NEP, the mid-blue arrows indicate the primary components of NEP (Reco and GPP), whereas the light blue arrows indicate the components of Reco and GPP.
Figure 2
Figure 2. Comparison of carbon fluxes obtained from eddy-covariance or biometric methods for worldwide forests.
(a) Net ecosystem production (NEP, n=31), (b) ecosystem respiration (Reco, n=25) and (c) gross primary production (GPP, n=18) from eddy-covariance (EC; x axis) and biometric (BM; y axis) methods. Bars indicate confidence intervals which are derived from uncertainty ranges related to biome and latitude, constrained by a reduction factor depending on the methodology and by the number of replicate years of measurement (see Methods). The dotted line is the 1:1 line.
Figure 3
Figure 3. Impact of variants of biometric methods on the difference between ecosystem respiration from biometric methods and eddy-covariance.
The relative difference between ecosystem respiration from biometric methods (RecoBM) and eddy-covariance (RecoEC) [(RecoBM − RecoEC)/((RecoEC + RecoBM)/2)] when (a) using different chamber systems to measure soil respiration (NSF: non-steady-state through-flow chamber; NSNF: non-steady-state non-through-flow chambers), (b) whether light inhibition is accounted for when estimating leaf respiration (Rleaf), and (c) employing generic or site-specific parameterization for the empirical models used to scale up the point measurements of Rleaf to the annual scale. Points indicate means and bars the standard error of the mean. The P value above each point indicates the significance level of the difference between RecoBM and RecoEC for each case, whereas the significance level P of each factor (that is, chamber system, accounting light inhibition, parameterization type) is indicated as rel. diff. P (relative difference between RecoBM and RecoEC) and is reported in the top right of each panel.

References

    1. Baldocchi D. D. Assessing the eddy covariance technique for evaluating carbon dioxide exchange rates of ecosystems: past, present and future. Global Change Biol. 9, 479–492 (2003).
    1. Chapin F. S. III et al.. Reconciling carbon-cycle concepts, terminology, and methods. Ecosystems 9, 1041–1050 (2006).
    1. Baldocchi D. Measuring fluxes of trace gases and energy between ecosystems and the atmosphere-the state and future of the eddy covariance method. Global Change Biol. 20, 3600–3609 (2014). - PubMed
    1. Baldocchi D. et al.. FLUXNET: a new tool to study the temporal and spatial variability of ecosystem-scale carbon dioxide, water vapor, and energy flux densities. Bull. Am. Meteorol. Soc 82, 2415–2434 (2001).
    1. Aubinet M., Vesala T. & Papale D. Eddy Covariance: A Practical Guide to Measurement and Data Analysis Springer (2012).

Publication types

LinkOut - more resources