. 2016 Dec 14:6:38565.
doi: 10.1038/srep38565.

Noninvasive Electroencephalogram Based Control of a Robotic Arm for Reach and Grasp Tasks

Affiliations

Noninvasive Electroencephalogram Based Control of a Robotic Arm for Reach and Grasp Tasks

Jianjun Meng et al. Sci Rep. .

Erratum in

Abstract

Brain-computer interface (BCI) technologies aim to provide a bridge between the human brain and external devices. Prior research using non-invasive BCI to control virtual objects, such as computer cursors and virtual helicopters, and real-world objects, such as wheelchairs and quadcopters, has demonstrated the promise of BCI technologies. However, controlling a robotic arm to complete reach-and-grasp tasks efficiently using non-invasive BCI has yet to be shown. In this study, we found that a group of 13 human subjects could willingly modulate brain activity to control a robotic arm with high accuracy for performing tasks requiring multiple degrees of freedom by combination of two sequential low dimensional controls. Subjects were able to effectively control reaching of the robotic arm through modulation of their brain rhythms within the span of only a few training sessions and maintained the ability to control the robotic arm over multiple months. Our results demonstrate the viability of human operation of prosthetic limbs using non-invasive BCI technology.


Figures

Figure 1
Figure 1. Experiment setup and task progression.
(a) Overview of experimental sessions for each participant. There were five stages of experiments with increasing level of difficulty, where each stage included two to four sessions of the same experimental paradigm. (b) Motor imagery tasks were used to drive two dimensional virtual cursor or robotic arm movement. The imagination of left hand, right hand, both hands, and relaxation corresponds to the respective left, right, up, and down movement of the robotic arm and virtual cursor. (c) Overview of tasks for experiment stages two through five. Experiment stage two (four-target grasp): Grasping one of the four fixed targets. Experiment stage three (five-target grasp): Grasping one of the five fixed targets. Experiment stage four (random-target grasp): Grasping a randomly located target. Experiment stage five (shelf-target grasp): Moving one target from the table onto the shelf. (d) Trial structure of a single trial task. First, there is a short period of inter-trial interval between two separate trials. After that, the target is displayed on the screen for three seconds during the prefeedback period and is followed by a moving pink cursor and robotic arm in the respective workspaces during the feedback period. If the robotic arm remained within the predefined radius above the designated block for 2 seconds, the hover period would be complete and the task would progress to the step of grasping in the reach-and-grasp sequence (otherwise the step is timeout after 12 seconds and a new trial begins). At this point, the computer would recognize that the robotic arm was meant to stop and grasp the target. The robotic arm would open the fingers and be prepared to finish the grasping sequence during the next trial (step) if the subject controls the robotic arm to move towards the block correctly.
Figure 2
Figure 2. Overall learning process of virtual cursor control.
Learning processes (PVC) of 1D LR and 2D cursor movement for all subjects across all sessions. Average PVC for LR and 2D are highlighted by the red and green lines, respectively. The standard errors of the mean (SEM) are indicated by the shaded regions alongside the two lines. Since not all subjects participated in all 15 sessions, the number of subjects included in each 1D LR and 2D session which are arranged chronologically are indicated, respectively, by the red and green bar plots in the lower part of the figure.
Figure 3
Figure 3. Event related desychronization (ERD)/event related synchronization (ERS) maps of 2D virtual cursor movement.
ERD/ERS maps of left, right, up and down target trials for electrodes C3 and C4. In each subplot the horizontal axis indicates the time (seconds); the vertical solid black line denotes when the target appeared, and the vertical solid blue line indicates when cursor control began. The period between the black dashed line and the black solid line shows the baseline period that was used to calculate the ERD/ERS. Only significant changes of ERD/ERS activity quantified by a bootstrap resampling method (see method) were shown here. The 8–26 Hz frequency band is indicated in the vertical axis. The red rectangle centered at 12 Hz (3 Hz bin width) highlights the mu band rhythmic activity starting from the appearance of the target and ending at 3.5 seconds after the cursor began to move. The target appeared at −3 seconds and the virtual cursor control began at 0 seconds. The baseline was selected as −4.5 seconds to −3 seconds during which the screen was black and the subject was instructed to remain in an idle state.
Figure 4
Figure 4. Event related desychronization (ERD)/event related synchronization (ERS) maps of the fixed four target grasping task.
ERD/ERS maps of moving towards the left, right, up and down targets for electrodes C3 and C4. The target appeared at −2.5 seconds and the robotic arm began to move at 0 seconds. The baseline was selected as −4 seconds to −2.5 seconds during which the robotic arm was stationary, the screen was black, and the subject was instructed to remain in an idle state.
Figure 5
Figure 5. Grasping performance of the four-target and five-target grasp tasks in the presence and absence of the accompanying cursor movement.
(a) Group average PVC and one standard deviation for the four-target and five-target grasp tasks. The leftmost bar for each task indicates the PVC of the original 13 subjects. The right two bars compare the PVC of the subset of six subjects who participated in additional sessions both with and without the cursor present. (b) Average number of blocks grasped in each run of the four-target and five-target grasp tasks for all subjects and all sessions, as well as the subset of six subjects. The green line shows the ideal maximum number of blocks (13 blocks) that can be grasped in each run. (c) Average single-trial time-to-hit target for all subjects and all sessions, as well as the subset of six subjects. The feedback duration when the robotic arm moved to complete the individual steps of the reach-and-grasp sequence was denoted as the single-trial time-to-hit.
Figure 6
Figure 6. Grasping performance of randomly located targets.
(a) Average number of targets grasped per run for all subjects and all sessions versus the ideal number of targets that could be grasped per run (10 targets). (b) Average single-trial time-to-hit of EEG robotic arm control compared to the ideal time-to-hit of the robotic arm control.
Figure 7
Figure 7. Example trajectories and the distribution of successful grasping trials for randomly located targets.
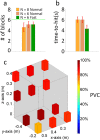
(a) 24 example trajectories from six different subjects (four each) for grasping random targets located in the four quadrants. The circles indicate the hover area for the randomly placed targets. (b) The distribution of successful and unsuccessful grasping within the workspace. The histograms above and to the right of the plot indicate how often the target was placed in that area of the workspace. (c) Topography of successful grasping rate within the workspace.
Figure 8
Figure 8. Grasping performance of the shelf-target grasp stage.
(a) Average number of targets grasped in each run for the original 8 subjects (orange bar) and the subset of 6 subjects who participated in three extra sessions. These extra three sessions involved controlling the robotic arm with the initial normal speed (shelf-target grasp) and an increased speed of movement (fast-shelf-target grasp). The green line shows the ideal number of blocks (6 blocks) that can be reached in a single run. (b) Average single-trial time-to-hit and standard deviation for all of the original 8 subjects and the 6 subjects who participated in both the shelf-target grasp and fast-shelf-target graps tasks. (Examples of robotic hand trajectories during the feedback period are shown as blue, yellow, red and green lines in Supplementary Figure 5). (c) Distribution of PVC for moving targets from a table onto a shelf. Average PVC of reach-and-grasp for the blocks on the table (x-y plane) and average PVC of reach-and-release for the blocks onto the shelf (x-z plane) are shown.

References

    1. He B., Gao S., Yuan H. & Wolpaw J. R. Brain–computer interfaces. In Neural Engineering (pp. 87–151). Springer: US, doi: 10.1007/978-1-4614-5227-0_2 (2013). - DOI
    1. Hochberg L. R. et al.. Reach and grasp by people with tetraplegia using a neurally controlled robotic arm. Nature. 485(7398), 372–375, doi: 10.1038/nature11076 (2012). - DOI - PMC - PubMed
    1. Collinger J. L. et al.. High-performance neuroprosthetic control by an individual with tetraplegia. The Lancet, 381(9866), 557–564, doi: 10.1016/S0140-6736(12)61816-9 (2013). - DOI - PMC - PubMed
    1. Carmena J. M. et al.. Learning to control a brain–machine interface for reaching and grasping by primates. PLoS Biol, 1(2), e42, doi: 10.1371/journal.pbio.0000042 (2003). - DOI - PMC - PubMed
    1. Ganguly K. & Carmena J. M. Emergence of a stable cortical map for neuroprosthetic control. PLoS Biol 7.7, e1000153, doi: 10.1371/journal.pbio.1000153 (2009). - DOI - PMC - PubMed

Publication types