

Epidemic spreading in random rectangular networks
- PMID: 27967075
- PMCID: PMC7217508
- DOI: 10.1103/PhysRevE.94.052316
Epidemic spreading in random rectangular networks
Abstract
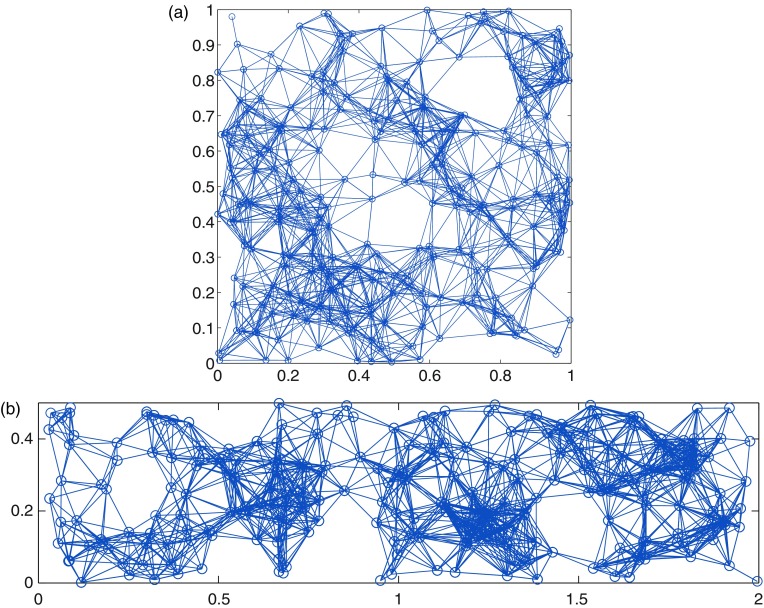
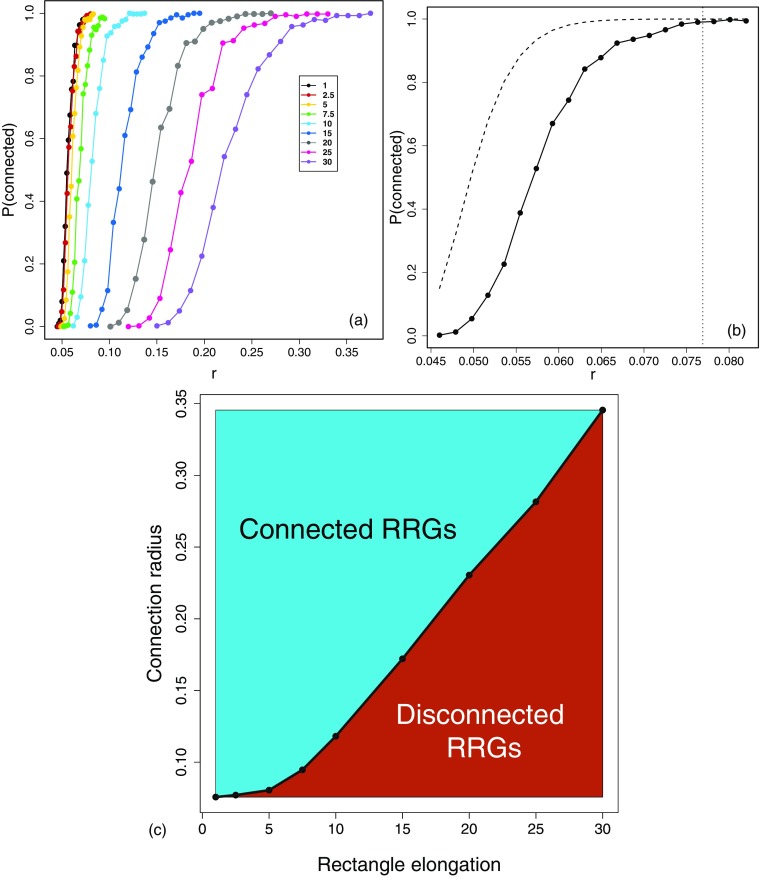
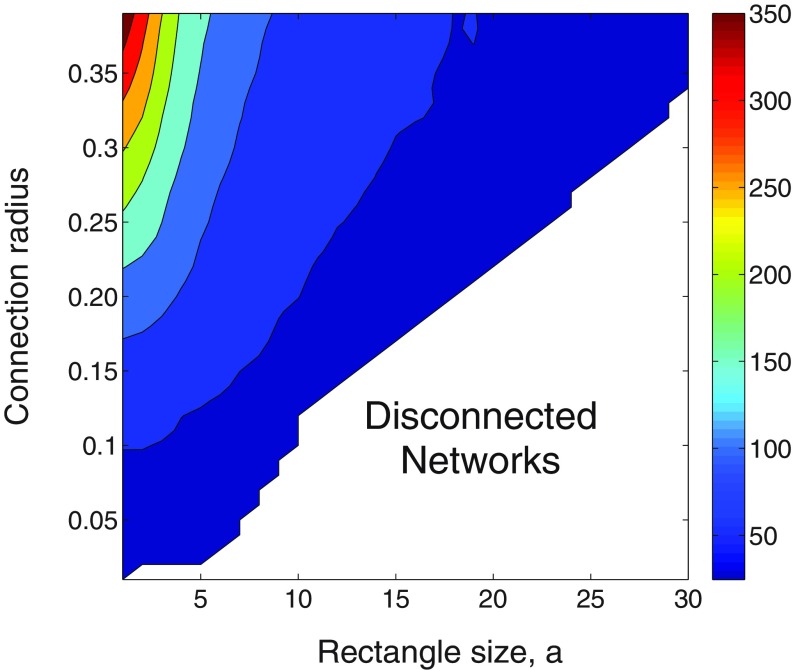
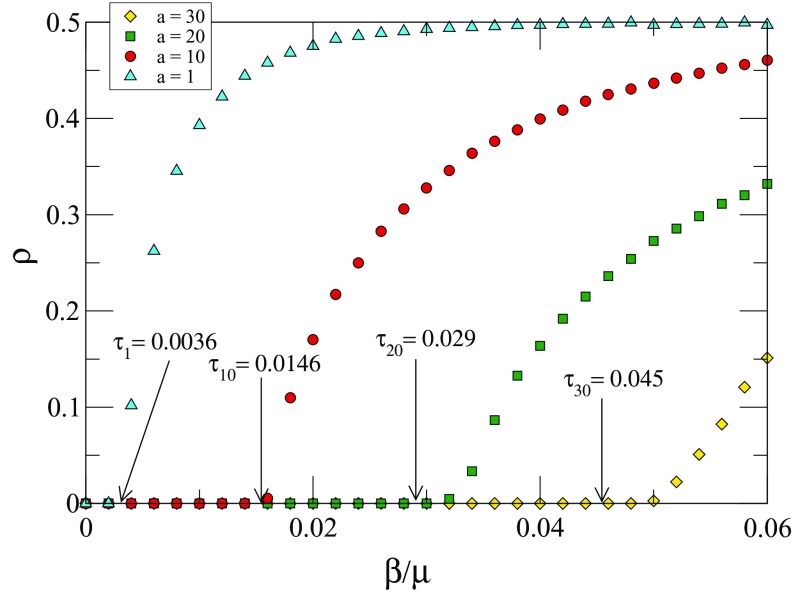
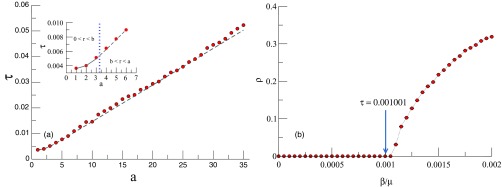
The use of network theory to model disease propagation on populations introduces important elements of reality to the classical epidemiological models. The use of random geometric graphs (RGGs) is one of such network models that allows for the consideration of spatial properties on disease propagation. In certain real-world scenarios-like in the analysis of a disease propagating through plants-the shape of the plots and fields where the host of the disease is located may play a fundamental role in the propagation dynamics. Here we consider a generalization of the RGG to account for the variation of the shape of the plots or fields where the hosts of a disease are allocated. We consider a disease propagation taking place on the nodes of a random rectangular graph and we consider a lower bound for the epidemic threshold of a susceptible-infected-susceptible model or a susceptible-infected-recovered model on these networks. Using extensive numerical simulations and based on our analytical results we conclude that (ceteris paribus) the elongation of the plot or field in which the nodes are distributed makes the network more resilient to the propagation of a disease due to the fact that the epidemic threshold increases with the elongation of the rectangle. These results agree with accumulated empirical evidence and simulation results about the propagation of diseases on plants in plots or fields of the same area and different shapes.
Figures
Similar articles
-
Epidemics on plants: Modeling long-range dispersal on spatially embedded networks.J Theor Biol. 2018 Sep 14;453:1-13. doi: 10.1016/j.jtbi.2018.05.004. Epub 2018 May 5. J Theor Biol. 2018. PMID: 29738720
-
Random rectangular graphs.Phys Rev E Stat Nonlin Soft Matter Phys. 2015 Apr;91(4):042805. doi: 10.1103/PhysRevE.91.042805. Epub 2015 Apr 21. Phys Rev E Stat Nonlin Soft Matter Phys. 2015. PMID: 25974545
-
Infection dynamics on spatial small-world network models.Phys Rev E. 2017 Nov;96(5-1):052316. doi: 10.1103/PhysRevE.96.052316. Epub 2017 Nov 30. Phys Rev E. 2017. PMID: 29347688 Free PMC article.
-
Identifying epidemic threshold by temporal profile of outbreaks on networks.Chaos. 2019 Oct;29(10):103141. doi: 10.1063/1.5120491. Chaos. 2019. PMID: 31675823
-
Stochastic Compartment Model with Mortality and Its Application to Epidemic Spreading in Complex Networks.Entropy (Basel). 2024 Apr 25;26(5):362. doi: 10.3390/e26050362. Entropy (Basel). 2024. PMID: 38785610 Free PMC article.
Cited by
-
Spatial effects in meta-foodwebs.Sci Rep. 2017 Aug 30;7(1):9980. doi: 10.1038/s41598-017-08666-8. Sci Rep. 2017. PMID: 28855519 Free PMC article.
-
Mathematical modelling for sustainable aphid control in agriculture via intercropping.Proc Math Phys Eng Sci. 2019 Jun;475(2226):20190136. doi: 10.1098/rspa.2019.0136. Epub 2019 Jun 19. Proc Math Phys Eng Sci. 2019. PMID: 31293361 Free PMC article.
-
Particle velocity controls phase transitions in contagion dynamics.Sci Rep. 2019 Apr 23;9(1):6463. doi: 10.1038/s41598-019-42871-x. Sci Rep. 2019. PMID: 31015505 Free PMC article.
-
From Infection Clusters to Metal Clusters: Significance of the Lowest Occupied Molecular Orbital (LOMO).ACS Omega. 2021 Jan 7;6(2):1339-1351. doi: 10.1021/acsomega.0c04913. eCollection 2021 Jan 19. ACS Omega. 2021. PMID: 33490793 Free PMC article.
-
Null Model and Community Structure in Multiplex Networks.Sci Rep. 2018 Feb 19;8(1):3245. doi: 10.1038/s41598-018-21286-0. Sci Rep. 2018. PMID: 29459696 Free PMC article.
References
-
- S. Boccaletti, V. Latora, Y. Moreno, M. Chavez, and D. U. Hwang, Complex networks: Structure and dynamics, Phys. Rep. 424, 175 (2006).PRPLCM10.1016/j.physrep.2005.10.009 - DOI
LinkOut - more resources
Full Text Sources
Other Literature Sources