. 2016 Dec 14;11(12):e0167646.
doi: 10.1371/journal.pone.0167646. eCollection 2016.

Attentional Selection Accompanied by Eye Vergence as Revealed by Event-Related Brain Potentials

Affiliations

Attentional Selection Accompanied by Eye Vergence as Revealed by Event-Related Brain Potentials

Maria Sole Puig et al. PLoS One. .

Abstract

Neural mechanisms of attention allow selective sensory information processing. Top-down deployment of visual-spatial attention is conveyed by cortical feedback connections from frontal regions to lower sensory areas modulating late stimulus responses. A recent study reported the occurrence of small eye vergence during orienting top-down attention. Here we assessed a possible link between vergence and attention by comparing visual event related potentials (vERPs) to a cue stimulus that induced attention to shift towards the target location to the vERPs to a no-cue stimulus that did not trigger orienting attention. The results replicate the findings of eye vergence responses during orienting attention and show that the strength and time of eye vergence coincide with the onset and strength of the vERPs when subjects oriented attention. Our findings therefore support the idea that eye vergence relates to and possibly has a role in attentional selection.


Conflict of interest statement

HS is shareholder of Braingaze. This does not alter our adherence to PLOS ONE policies on sharing data and materials.

Figures

Fig 1
Fig 1. Schematic explanation of the modulation in the angle of eye vergence during a visual task.
The eyes focus on a single point in space, i.e. the fixation spot. The eyes briefly converge when orienting attention to one of the eight peripheral bars. The vergence angle (α1) becomes then larger (α2).
Fig 2
Fig 2. Illustration of the visual attention task.
Fig 3
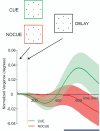
Fig 3. Vergence eye movements.
The normalized average (across all subjects) size of the angle of eye vergence in the cue (green) and no-cue (red) conditions over time. Time points (blue) indicate a significant difference in angle of eye vergence between both conditions. Shaded areas represent ±1 times standard deviation around the mean. Time is from cue onset.
Fig 4
Fig 4. Pupil size and auditory cueing.
The average pupil size in the cue (green) and no-cue (red) conditions over time. Time points (blue) indicate a significant differences between conditions.
Fig 5
Fig 5. Event-Related potentials.
Event-Related potentials (y-axis) associated to the cue signal (solid line) and no-cue signal (dashed line) for three parieto-occipital electrodes: O2 (blue), Pz (green) and PO2 (red). Significant differences (p<0.05 corrected for multiple conditions, see Materials and Methods sections) between cue and no-cue conditions are indicated with solid yellow areas in the corresponding electrodes. In addition, voltage maps are included at selected time windows (175–225 ms, 300–400 ms and 400–500 ms) for descriptive purposes. Time is from cue onset.
Fig 6
Fig 6. Correlation between vergence and EPRs.
Cross-correlation between single-trial EEG activity and vergence at different time lags, from -400 to +400 ms in the cue (green) and no-cue (red) conditions. Solid line indicate the mean among subjects and colored areas the corresponding standard deviation of the mean. Note that the cross-correlation of the two conditions peaks around a time lag of 0 (+28 ms for the cue condition, and at +16 ms for the no-cue condition) but the significant differences between conditions (indicated by the horizontal blue lines) extend between time lags from 0 to 56 ms and from 96 ms and 116 ms.
Fig 7
Fig 7. Vergence and ERPs responses.
Average (across all subjects) normalized vergence (blue) and ERPs (orange) responses. ERP response is aligned to the onset of mean eye vergence across subjects. Shaded areas represent ±1 standard deviation around the mean. Time is from mean onset latency of eye vergence. Note that we plotted the ERP component with positive values up (contrary to the traditional orientation, negative up) in order to easily compare it with vergence values.

References

    1. McAlonan K, Cavanaugh J, Wurtz RH (2008) Guarding the gateway to cortex with attention in visual thalamus. Nature 456: 391–394. 10.1038/nature07382 - DOI - PMC - PubMed
    1. Krauzlis RJ, Lovejoy LP, Zénon A. (2013) Superior colliculus and visual spatial attention. Annu Rev Neurosci. 36:165–82. 10.1146/annurev-neuro-062012-170249 - DOI - PMC - PubMed
    1. Ghajar J, Ivry RB (2009) The predictive brain state: asynchrony in disorders of attention? Neuroscientist. 15:232–42. 10.1177/1073858408326429 - DOI - PMC - PubMed
    1. Rugg MD, Milner AD, Lines CR, Phalp R (1987) Modulation of visual event-related potentials by spatial and non-spatial visual selective attention. Neuropsychologia, 25: 85–96. - PubMed
    1. Eimer M (1994) Sensory gating as a mechanism for visual-spatial orienting: Electrophysiological evidence from trial-by-trial cueing experiments. Perception and Psychophysics, 55: 667–675. - PubMed