. 2016 Nov 23;92(4):739-753.
doi: 10.1016/j.neuron.2016.10.015. Epub 2016 Oct 27.

Capturing and Manipulating Activated Neuronal Ensembles with CANE Delineates a Hypothalamic Social-Fear Circuit

Affiliations

Capturing and Manipulating Activated Neuronal Ensembles with CANE Delineates a Hypothalamic Social-Fear Circuit

Katsuyasu Sakurai et al. Neuron. .

Abstract

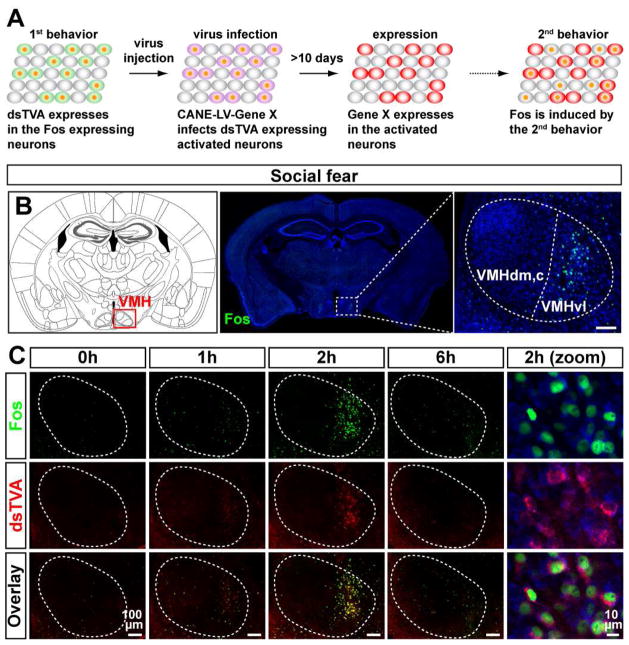
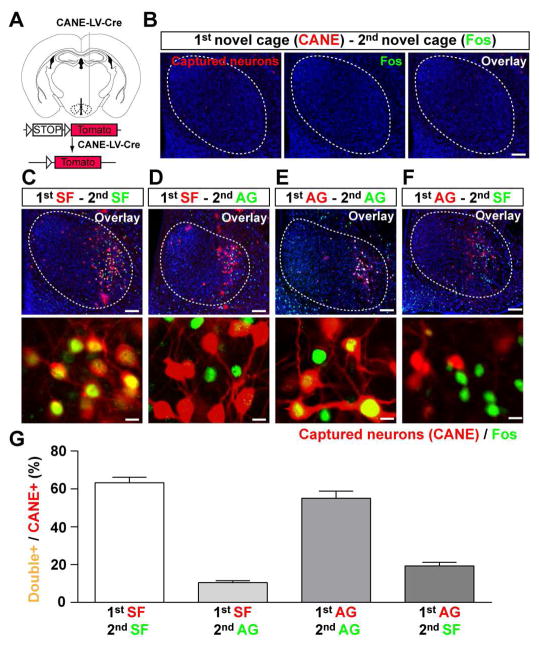
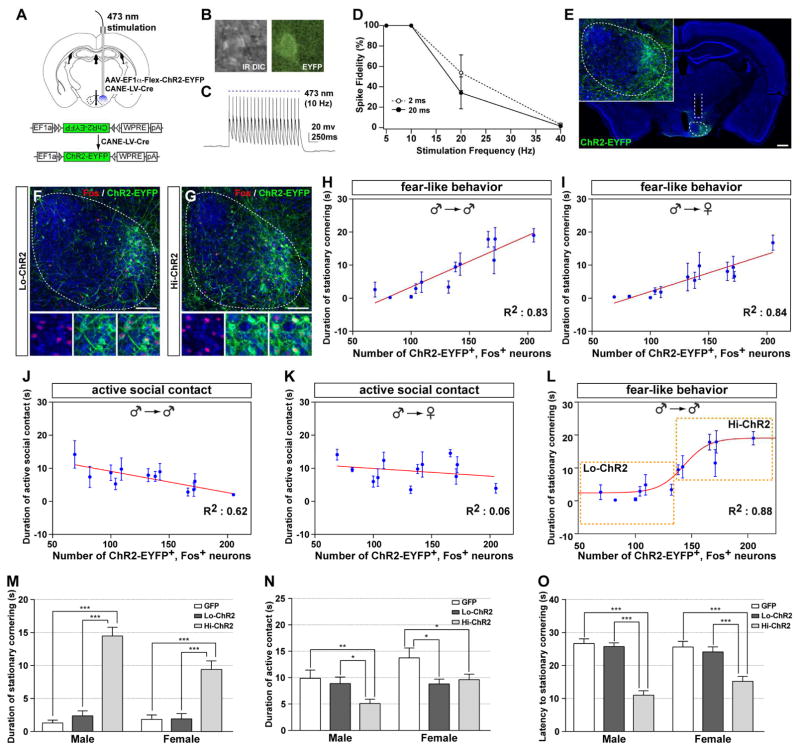
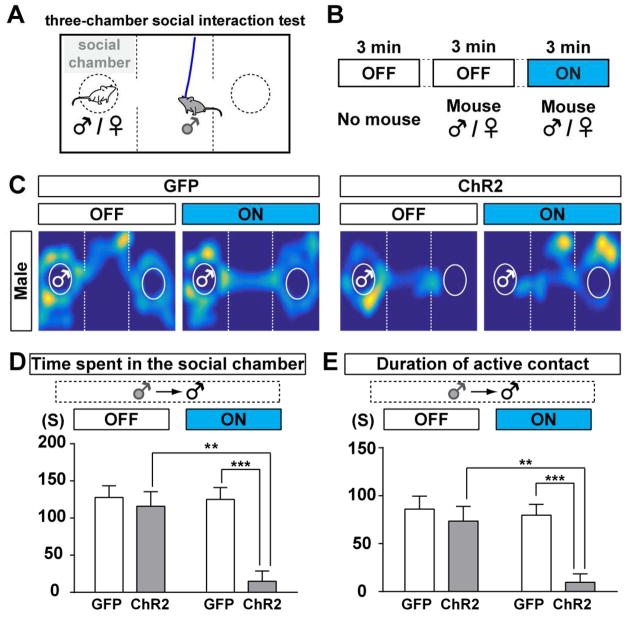
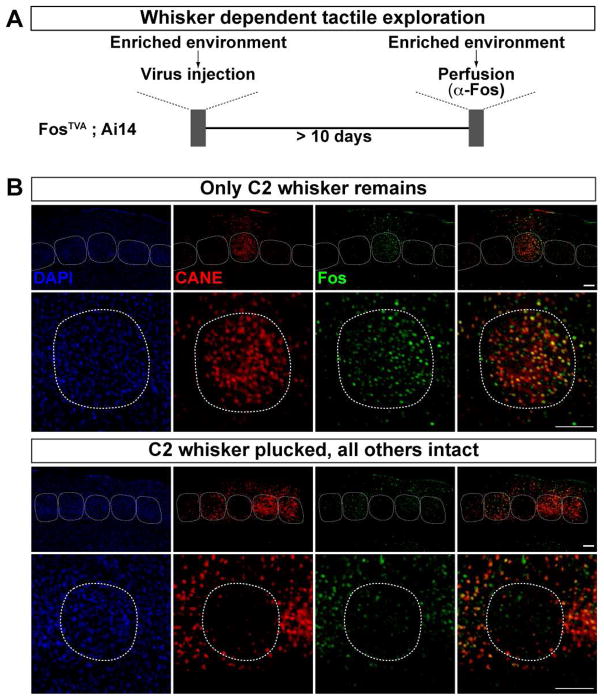
We developed a technology (capturing activated neuronal ensembles [CANE]) to label, manipulate, and transsynaptically trace neural circuits that are transiently activated in behavioral contexts with high efficiency and temporal precision. CANE consists of a knockin mouse and engineered viruses designed to specifically infect activated neurons. Using CANE, we selectively labeled neurons that were activated by either fearful or aggressive social encounters in a hypothalamic subnucleus previously known as a locus for aggression, and discovered that social-fear and aggression neurons are intermixed but largely distinct. Optogenetic stimulation of CANE-captured social-fear neurons (SFNs) is sufficient to evoke fear-like behaviors in normal social contexts, whereas silencing SFNs resulted in reduced social avoidance. CANE-based mapping of axonal projections and presynaptic inputs to SFNs further revealed a highly distributed and recurrent neural network. CANE is a broadly applicable technology for dissecting causality and connectivity of spatially intermingled but functionally distinct ensembles.

Keywords: CANE; Fos; VMHvl; activity dependent; aggression; functional neural circuit; hypothalamus; social fear.


Conflict of interest statement

None of the authors of this manuscript have a financial interest related to this work.

Figures

Figure 1
Figure 1. Schematic of the CANE technology
Schematic illustration of the FosTVA mouse, and the pseudotyped viruses that are designed to infect only activated (Fos+) neurons in the CANE technology.
Figure 2
Figure 2. Characterization of the FosTVA knock-in mice
(A) Strategy needed for validating the specificity and efficiency of the CANE method. The two-bout behavior paradigm is needed to examine the overlap of CANE+ (after 1st behavior) and Fos+ neurons (induced by 2nd behavior). (B) Fos expression patterns induced in intruder. Left, stereotaxic map of the coronal section containing VMH. Central, low mag image. Right, high mag image with dashed-line circling VMH. VMH, ventromedial hypothalamus; VMHdm,c, dorsomedial and central subdivision of VMH; VMHvl, ventrolateral subdivision of VMH. Green, Fos; blue, fluorescent Nissl. Scale bar, 100 μm. (C) Time course of Fos (green) and dsTVA (red) expression patterns in VMHvl following social fear experience in FosTVA mice. Scale bars, 100 μm (left 4 panels), 10 μm (right-most panel).
Figure 3
Figure 3. Capturing Social fear neurons (SFNs) in VMHvl using CANE-LV-Cre
(A) Strategy to express tdTomato in VMHvl SFNs in FosTVA; Ai14 mice using CANE. (B) Control experiments in which CANE-LV-Cre was injected into VMHvl after FosTVA; Ai14 mice explored a novel cage. Red, minimum background infection following the 1st novel cage exploration; Green, Fos staining after a 2nd novel cage experience showing that Fos is not induced in VMHvl. Scale bar, 100 μm (C–F) Examination of CANE-captured neurons (red) versus behavior-activated Fos+ neurons (green) in VMHvl. In all four paradigms, CANE method was used to capture neurons activated by 1st behavior, and weeks later Fos was induced by the 2nd behavior. SF, social fear; AG, aggression behavior. Blue, fluorescent Nissl. Scale bar, 100 μm for upper panels, 10 μm for lower panels. (G) The percentage of Fos+ neurons among CANE+ neurons. Data are Mean ± S.E.M. (1st SF – 2nd SF, n=9; 1st SF – 2nd AG, n = 9; 1st AG – 2nd AG, n = 6; 1st AG – 2nd-SF, n=5). SF, social fear; AG, aggression.
Figure 4
Figure 4. Behavioral effects of optogenetic activation of captured SFNs in the home cage
(A) Strategy of expressing channelrhodopsin (ChR2) in VMHvl SFNs using CANE. (B–D) Whole-cell patch clamp recording from ChR2-expressing SFNs (B) in acute brain slices. Photo stimulation-evoked representative spiking (C) and the spike fidelity (D) are shown (open circles, 2 ms light pulse-width, n = 8; filled circles, 20 ms light pulse-width, n = 8). (E) Representative low and high magnification images of captured ChR2-EYFP expressing SFNs in VMHvl. The square dashed line indicates where the fiber optic was implanted. (F and G) Representative images of ChR2-EYFP captured SFNs in Lo-ChR2 (F) and Hi-ChR2 (G) groups. Photo stimulation (after all behaviors were completed) was used to induce Fos expression in ChR2-EYFP+ SFNs to facilitate counting of the numbers of captured neurons in each animal. (H and I) Linear regression analysis of the duration of stationary cornering behavior during photo-stimulation (fear-like behavior) versus the numbers of ChR2-EYFP activated SFNs. (H), male-male; (I), male-female interaction. Data are Mean ± S.E.M. over multiple trials (n = 12 mice). R2 value is shown on each graph. P<0.001 (H), P<0.001 (I). (J and K) Linear regression analysis of the duration of active social contact during photo-stimulation versus the numbers of ChR2-EYFP activated SFNs. (J), male-male intruder; (K), male-female. Data are Mean ± S.E.M. over multiple trials (n = 12 mice). R2 value is shown on each graph. P = 0.002 (J), P = 0.43 (K). (L) A sigmoidal fit for describing the relationship between the duration of stationary cornering behavior and the number of ChR2-EYFP activated SFNs (toward a male intruder). Data are Mean ± S.E.M. over multiple trials (n = 12 mice). (M–O) Quantification of behavior parameters induced by photo stimulations. The duration of stationary cornering behavior (M), the duration of active contact (N) and the latency to the onset of stationary behavior (O) in the presence of a male or a female are shown. Data are Mean ± S.E.M. (GFP group, n = 4; Lo-ChR2, n = 6; Hi-ChR2, n = 6 mice). *P < 0.05, **P < 0.01, ***P < 0.001. Unpaired t-Test. Blue, fluorescent Nissl. Scale bar, 200 μm (E), 100 μm (F and G).
Figure 5
Figure 5. Behavioral effects of optogenetic activation of SFNs in the three-chamber social interaction test
(A) Schematic illustration of three-chamber social preference test. (B) Experimental time course used for the three-chamber test. (C) Representative spatial heat maps showing the locations of the experimental mouse in the presence of a male mouse. (D) Quantification of time spent in the social chamber in the presence of a male mouse. (E) Quantification of duration of active contact in in the presence of a male mouse. Data are Mean ± S.E.M. (GFP group, n = 7; ChR2, n = 6 to male). **P < 0.01, ***P < 0.001.Unpaired t-Test.
Figure 6
Figure 6. Behavioral effects of silencing SFNs
(A) Strategy of expressing tetanus toxin light chain (TeLC) in VMHvl SFNs using CANE. (B) Representative images of TeLC-GFP expressing SFNs in VMHvl. (C) Experimental time course of the behavioral test. (D) Representative video still (left), and representative traces of inter-mouse distance during the 5 min social interaction period (center; control mouse; right; SFN-silenced mouse). (E–I) Quantification of social interactions. The averaged relative distance between two mice (E), the social avoidance ratio (avoidance behavior when being contacted) (F), the total duration of physical contact (G), the total duration of nose to nose contact (H), and the total duration of anogenital sniffing (I). Data are Mean ± S.E.M. (Control group, n = 4; TeLC group, n = 8). *P < 0.05, **P < 0.01. Unpaired t-Test. Blue, fluorescent Nissl. Scale bar, 100 μm.
Figure 7
Figure 7. Mapping the axonal projection targets of the VMHvl SFNs
(A) Strategy to visualize axonal projections from SFNs using CANE. (B–D) Representative images of CANE-GFP-captured SFNs in VMHvl. Green, GFP-expressing SFNs captured after the 1st social fear encounter (B); Red, Fos expression induced by the 2nd social fear stimulation (C). (D), overlay of (B) and (C). Inserts are high magnification images. (E–P) Representative images of axonal projections from captured SFNs in several brain nuclei. In all cases, the left panel is a stereotaxic map adapted from Paxinos and Franklin mouse brain atlas, with the red box depicting the area for the image shown on the right panel; the right panel is a representative image of the boxed area showing axonal projections from CANE-GFP+ SFNs and Fos expression (red) induced by social fear experience. (Q) Quantification of total GFP+ pixels in each projection target (normalized against the ipsilateral AHA). (R) Quantification of normalized density of innervations (total GFP+ pixels divided by the area of each nucleus). All data shown are Mean ± S.E.M. (n = 3). Ipsi; ipsilateral. Contra; Contralateral. cg1, cingulate cortex 1; PrL, prelimbic cortex; IL, infralimbic cortex; NaC, nucleus accumbens; LS, lateral septal nucleus; BNST, bed nuclei of the stria terminalis; MPA, medial preoptic area; LPO, lateral preoptic area; PVH, paraventricular hypothalamic nucleus; AHA, anterior hypothalamic area; PVT, paraventricular nucleus of the thalamus; MeA, medial amygdalar nucleus; CeA, central amygdalar nucleus; PMd, dorsal premammillary nucleus; PMv, ventral premammillary nucleus; PAGDM, dorsomedial periaqueductal gray; PAGL, lateral periaqueductal gray; MRNL, lateral region of midbrain reticular formation; Ipsi, ipsilateral; Contra, contralateral. Scale bars, 100 μm.
Figure 8
Figure 8. Visualization of transsynaptically labeled presynaptic neurons for the VMHvl SFNs
(A) Strategy for capturing SFNs in VMHvl using CANE-RV-mCherry. (B–D) Representative images of CANE-RV-mCherry captured SFNs. Red, captured SFNs activated by the 1st social fear behavior (B); Green, Fos expression induced by a 2nd social fear behavior (C). (D) is the overlay of (B) and (C). (E) 61 ± 6% of CANE-RV-mCherry+ infected neurons with Fos. Data is Mean ± S.E.M. (n = 4). (F) Strategy for transsynaptic tracing of presynaptic inputs for SFNs in VMHvl in FosTVA mice. (G–I) Representative images of viral infection in VMHvl. Green, EGFP/TVA/rabies-G captured SFNs after the 1st social fear experience (G). Red, CANE-RV-mCherry infected neurons after a 2nd social fear experience (H). (I) is the overlay of (G) and (H). (J–R) Representative images of transsynaptically labeled neurons in several brain regions. In all cases, the left panel is a stereotaxic map, with the red box showing the specific area for the image in the right panel. (S) Quantification of the number of transsynaptically labeled neurons in each brain area. The value is normalized against the number of starter neurons and averaged across animals. Data are Mean ± S.E.M. (n = 3). (T) Schematic summary of both the input sources and the output targets of VMHvl SFNs. Most abbreviations are same as in Figure 7. Scale bars, 100 μm.
Figure 9
Figure 9. Application of CANE technology to capture activated neurons in whisker dependent tactile exploration
(A) Strategy for capturing barrel cortex neurons activated by whisker mediated exploration in FosTVA; Ai14 mice using CANE. (B) Representative images of CANE+ barrel cortex neurons. The top two rows were results from mice with only the C2 whisker remained. The bottom two rows were results from mice with all-but-C2 whiskers intact. Red, CANE+ neurons; Green, Fos expression induced by a 2nd exploration. White dash lines circle the structure of barrel columns in layer 4. Scale bars, 100 μm (B).

References

    1. Barnard RJ, Elleder D, Young JA. Avian sarcoma and leukosis virus-receptor interactions: from classical genetics to novel insights into virus-cell membrane fusion. Virology. 2006;344:25–29. - PubMed
    1. Barnard RJ, Young JA. Alpharetrovirus envelope-receptor interactions. Curr Top Microbiol Immunol. 2003;281:107–136. - PubMed
    1. Barth AL, Gerkin RC, Dean KL. Alteration of neuronal firing properties after in vivo experience in a FosGFP transgenic mouse. J Neurosci. 2004;24:6466–6475. - PMC - PubMed
    1. Bergan JF, Ben-Shaul Y, Dulac C. Sex-specific processing of social cues in the medial amygdala. Elife. 2014;3:e02743. - PMC - PubMed
    1. Callaway EM. Transneuronal circuit tracing with neurotropic viruses. Curr Opin Neurobiol. 2008;18:617–623. - PMC - PubMed

Publication types

MeSH terms

Substances