. 2016 Nov 23;92(4):796-812.
doi: 10.1016/j.neuron.2016.09.055. Epub 2016 Oct 27.

Tau Prion Strains Dictate Patterns of Cell Pathology, Progression Rate, and Regional Vulnerability In Vivo

Affiliations

Tau Prion Strains Dictate Patterns of Cell Pathology, Progression Rate, and Regional Vulnerability In Vivo

Sarah K Kaufman et al. Neuron. .

Abstract

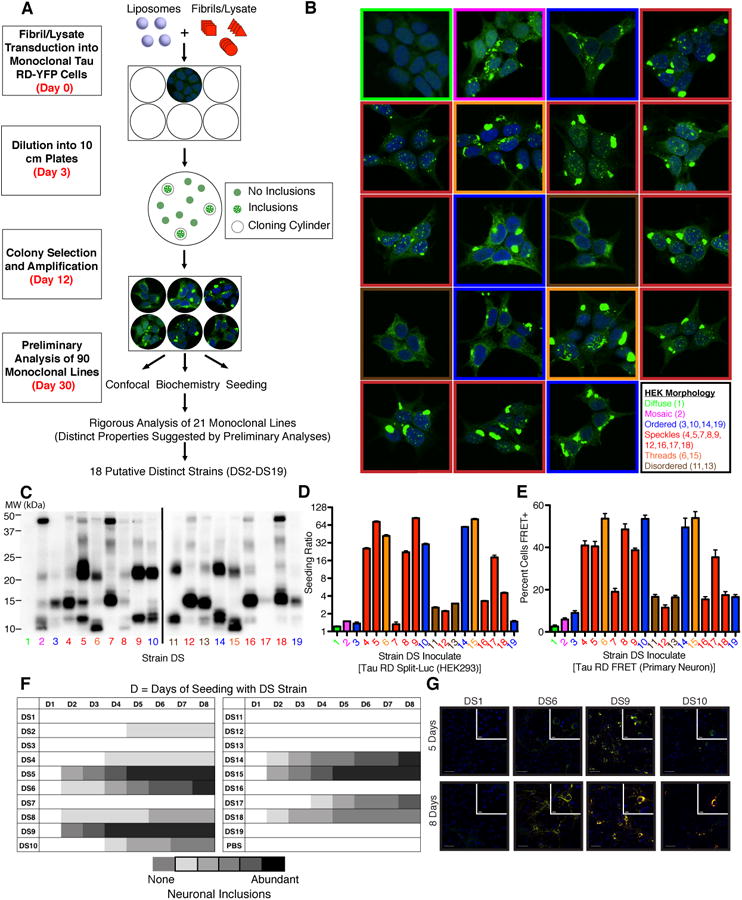
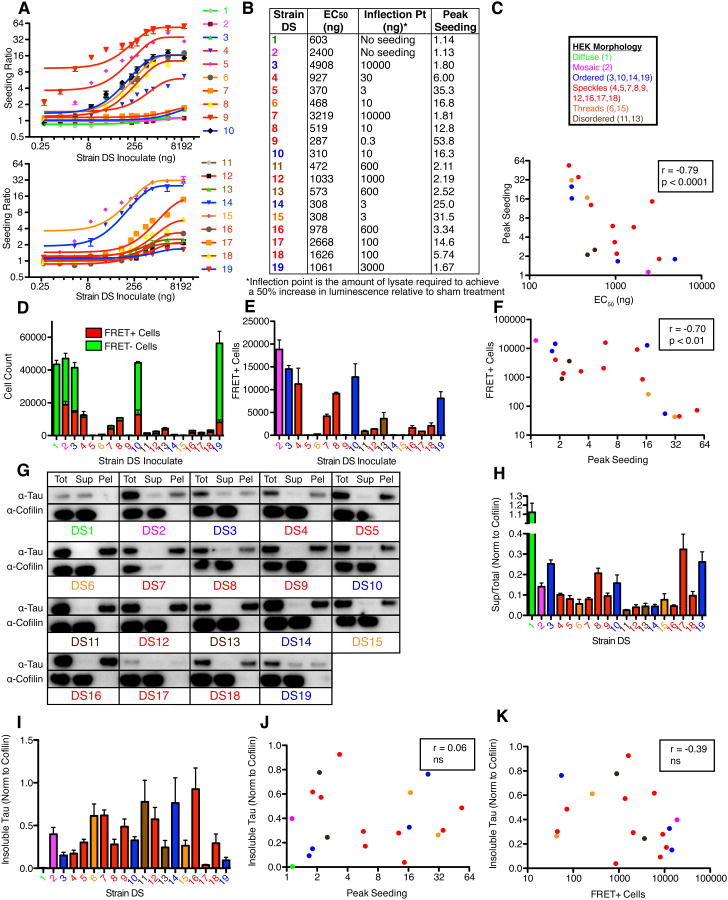
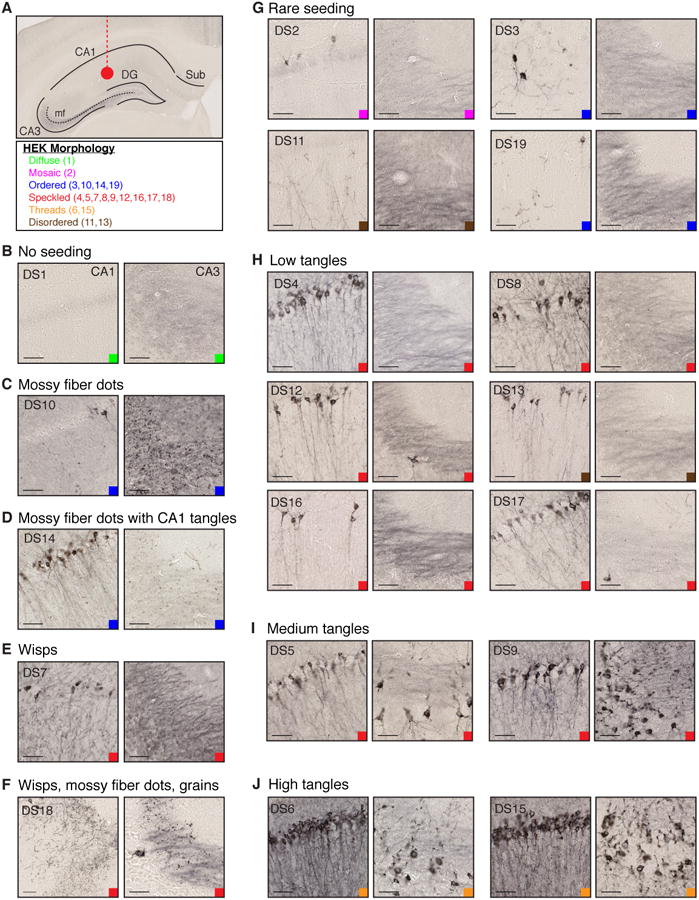
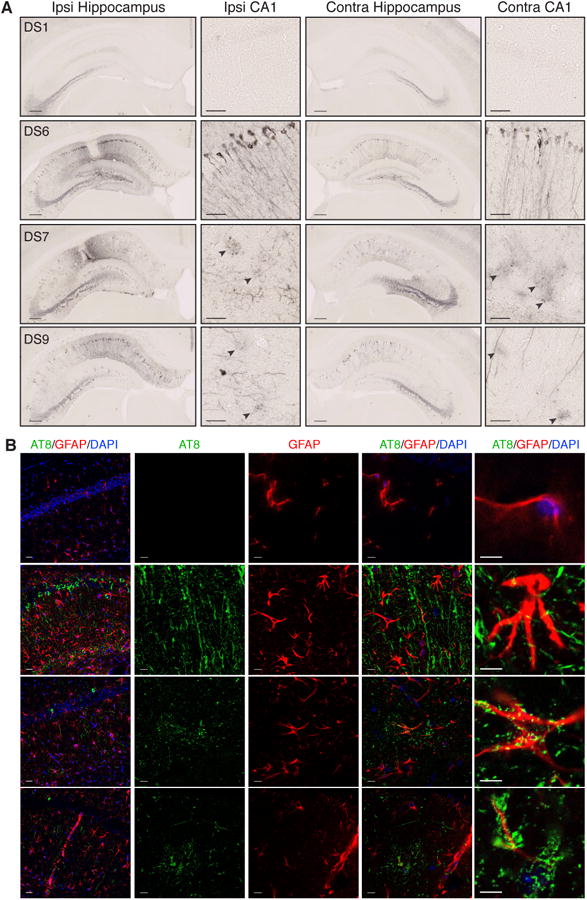
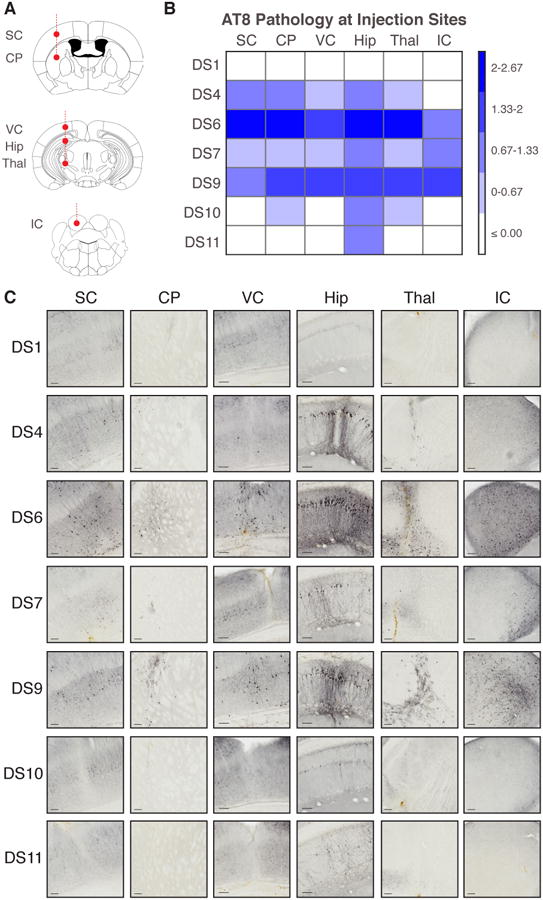
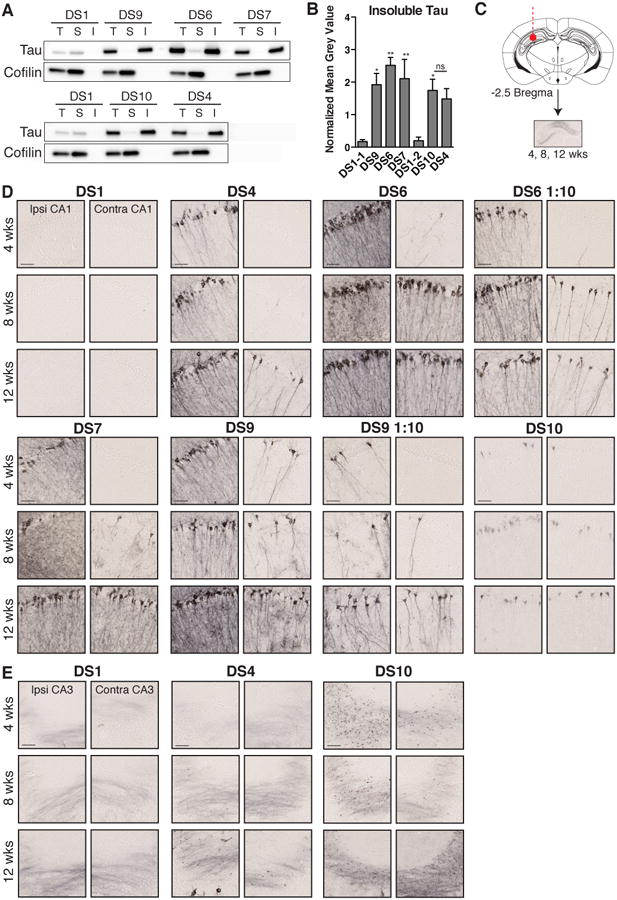
Tauopathies are neurodegenerative disorders that affect distinct brain regions, progress at different rates, and exhibit specific patterns of tau accumulation. The source of this diversity is unknown. We previously characterized two tau strains that stably maintain unique conformations in vitro and in vivo, but did not determine the relationship of each strain to parameters that discriminate between tauopathies such as regional vulnerability or rate of spread. We have now isolated and characterized 18 tau strains in cells based on detailed biochemical and biological criteria. Inoculation of PS19 transgenic tau (P301S) mice with these strains causes strain-specific intracellular pathology in distinct cell types and brain regions, and induces different rates of network propagation. In this system, strains alone are sufficient to account for diverse neuropathological presentations, similar to those that define human tauopathies. Further study of these strains can thus establish a structural logic that governs these biological effects.

Keywords: cell model; prion; prion-like; seeding activity; strain; tau; tau pathology; tauopathy; transcellular propagation.


Figures

Figure 1
Figure 1. Generation and characterization of a tau prion strain library
(A) A monoclonal HEK293 line stably expressing tau RD(P301L/V337M) (“LM”)-YFP (DS1) was treated with diverse sources of fibrillar tau seeds. 90 monoclonal lines that stably propagated tau inclusions were derived and characterized by the indicated metrics. 18 strains are differentiated based on their unique properties in the indicated assays. See Figure S1A for origin of inoculates used to derive each strain. (B) Several tau inclusion phenotypes were identified in the monoclonal strains: mosaic (magenta), ordered (blue), speckles (red), threads (orange), and disordered (brown). With the exception of the mosaic phenotype, these inclusion phenotypes stably propagate to daughter cells over months of division. A negative control cell line (DS1) features diffuse tau (green). See Figure S2F-H for data regarding stability of specific strains upon passage into DS1. (C) Limited proteolysis using pronase differentiates the protected fibrillar cores in individual tau strains. Unique “fingerprints” along with other metrics indicated structurally distinct tau prion strains. See Figure S1B for pronase digestion of strains diluted with HEK lysate. (D) Seeding activity of strains in a split-luciferase assay. A tau RD(P301S) split-luciferase assay based on enzymatic complementation following aggregation demonstrates differences in strain seeding activities following introduction into the cytoplasm using lipofectamine. Seeding ratio indicates luminescence relative to sham treatment. Biological quadruplicates with saturating quantities of lysate were averaged. Error bars represent S.E.M. for biological quadruplicates. (E) Strain seeding activities replicate in primary neurons expressing tau RD. Primary hippocampal neurons expressing tau RD(P301S)-CFP and tau RD(P301S)-YFP were treated with lysates derived from various strains. After 96 hours, neurons were fixed and the percentage of cells featuring seeded aggregates was determined by FRET flow cytometry. Error bars represent S.E.M. for biological quintuplicates. (F) Strain seeding activities replicate in primary neurons expressing full-length tau. Primary hippocampal neurons expressing 1N4R tau(P301S)-YFP were exposed to lysates from each strain and the extent of seeding was semi-quantitatively determined at various time points (D =number of days) based on the extent of visible YFP puncta (0-5: 0 = none; 5 = abundant inclusions). Strains show variable lag times and extent of seeding, which correlates with the split-luciferase complementation assay. (G) Strains differentially induce the formation of insoluble tau aggregates in primary neurons. Triton X-100 was used to remove soluble tau and primary neurons were stained for conformationally altered tau (MC1) five or eight days following seeding. Strains show significant differences in seeding of aggregation in neurons. This parallels differences in the split-luciferase complementation assay. Scale bars represent 50 μm for the wide view and 10 μm for the inset images. See Figure S1C for representative images for all strains.
Figure 2
Figure 2. Seeding activity, but not insoluble tau, correlates with strain toxicity in vitro
(A) Strains have large differences in seeding of monomeric tau as determined by a tau split-luciferase complementation assay. Strain lysates were transduced into tau RD(P301S) split-luciferase cells, seeding ratios relative to sham treatment were determined, and titration curves were plotted using non-linear regression with a one-phase decay fit. Curves are plotted on two separate graphs for clarity. Error bars represent S.E.M for biological quadruplicates. (B) Based on titration curves in the tau split-luciferase complementation assay, the EC50, inflection point, and peak seeding ratio were determined for each strain. The inflection point represents the amount of lysate required to achieve a 50% increase in luminescence relative to sham treatment. (C) Peak seeding significantly correlates with EC50s for the strain library in the tau split-luciferase complementation assay. (D) Strains display significant differences in toxicity. Strains were transduced in biological triplicates into cells overexpressing both tau RD(LM)-CFP and tau RD(LM)-YFP. After 72 hours, equivalent numbers of aggregate-containing (FRET+) cells were sorted for each condition by FRET flow cytometry. For the negative control (DS1), aggregate-negative (FRET-) cells were sorted. Sorted cells were allowed to proliferate in technical sextuplicates for 1 week. Aggregate-positive (FRET+) and aggregate-negative (FRET-) cells were then quantified by flow cytometry. The presence of FRET- cells in certain conditions reflects the fact that some strains lose the aggregated state with cell division. Technical sextuplicates were averaged for each biological replicate. Error bars represent S.E.M. of biological triplicates. (E) Aggregate-positive (FRET+) cells were quantified and plotted after one week of growth. This highlights the variable growth defects in aggregate-containing cells. Error bars represent S.E.M. of biological triplicates. (F) Toxicity correlates with seeding activity. The number of aggregate-positive (FRET+) cells for a strain was plotted against its peak seeding ratio in the tau split-luciferase complementation assay. Strains that seed more efficiently are associated with reduced growth of aggregate-positive cells. See Figure S2A and B for data indicating the correlation between a strain's toxicity, EC50, and inflection point in the seeding assay. (G) Sedimentation analysis of strains. Lysates were ultracentrifuged and tau as well as a loading control protein (cofilin) were probed in the total, supernatant, and pellet fractions (Tot = total, Sup = supernatant, Pel = pellet). Blots are representative of biological quadruplicates. (H) Strains feature the majority of tau in the insoluble fraction. Densitometric analysis of tau in the total, supernatant, and pellet fractions was used to calculate supernatant to total ratios (a higher ratio indicates a smaller proportion of tau in the insoluble pellet). Error bars represent S.E.M. of biological quadruplicates. (I) Densitometric analyses highlight variation in insoluble tau in the various strains. Error bars represent S.E.M. of biological quadruplicates. See Figure S2C for quantification of tau in the total fractions. (J) Lack of correlation between insoluble tau and seeding activity as measured by peak seeding ratio. See Figure S2D for data indicating lack of correlation between total tau and seeding. (K) Lack of correlation between total tau and seeding activity. See Figure S2E for data indicating lack of correlation between total tau and toxicity.
Figure 3
Figure 3. Tau prion strains induce diverse patterns of hippocampal tau pathology
(A) Tau strains (10 μg) were injected into the left hippocampus of young PS19 mice (n=3 per condition, see Supplemental Table 1). Mouse brains were collected 8-weeks after injection. Relevant regions are indicated on a representative mouse hippocampus (DG, dentate gyrus; mf, mossy fibers; Sub, Subiculum). HEK Morphology table indicates the inclusion patterns in various strains, grouped by text color. Color-coded squares indicate these HEK cell-associated patterns in all images (B-J). (B) DS1 injection produces no AT8 tau pathology. Representative images of CA1 and CA3 are displayed. Scale bars represent 50 μm. See Figure S3A for whole hippocampal images for DS1-19. (C) DS10 produces AT8 positive mossy fiber “dot” pathology, with limited CA1 pathology as observed previously (Sanders et al., 2014). See Figure S3C for contralateral mf pathology. (D) DS14 seeds mossy fiber dots similar to DS10, as well as tangle-like pathology, indicating that it is a distinct strain despite its other similar features to DS10. See Figure S3C for contralateral mossy fiber and CA1 pathology. (E) DS7 induces “wisps” that resemble neuropil threads, but may fall within axon terminals and the dendritic tree of pyramidal neurons. (F) DS18 pathology includes wisps and mossy fiber dots similar to DS7 and 10 respectively, as well as “grains” that are found throughout much of the hippocampus. See Figure S3D for data indicating that these phenotypes spread to distant synaptically connected locations including the entorhinal cortex. (G-J) Several strains produce different levels of tangle-like AT8 pathology in CA1 and CA3 of the hippocampus. (G) DS2, 3, 11, and 19 induce rare AT8 pathology in pyramidal CA1 neurons. The localization of AT8 staining varies in certain cases (cell body versus axonal pathology in DS2 and 11 respectively). (H) DS4, 8, 12, 13, 16, and 17 induce slightly stronger tangle-like pathology in CA1 of the hippocampus (“low tangles”). CA3 shows limited or no tangle pathology at this time point. (I) DS5 and 9 produces AT8 tangle-like tau pathology that reaches CA3 of the hippocampus as well as CA1 pyramidal cells (“medium tangles”). Tangles appear relatively consolidated within the soma of neurons. See Figure S3B for spread of tau pathology to the contralateral hippocampus and ipsilateral EC. (J) DS6 and 15 display the highest level of tangle-like AT8 pathology (“high tangles”). Highly consolidated pathology was observed throughout cell bodies and axons of CA1 and CA3 neurons. See Figure S3B for spread of tau pathology to the contralateral hippocampus and ipsilateral EC.
Figure 4
Figure 4. Specific strains induce astrocytic tau pathology
(A) AT8 tau pathology 8-weeks after injection with DS1, 6, 7, or 9. DS1 does not induce tau pathology. DS6, 7 and 9 develop strong AT8 staining in ipsilateral and contralateral hippocampi. DS7 and 9 develop diffuse, circular-shaped accumulations of AT8 staining that do not appear to localize to a neuronal cell body (black arrow heads). Scale bars represent 250 μm for the whole hippocampus, and 50 μm for CA1. (B) Co-staining of AT8 (green) for phospho-tau, GFAP (red) for astrocytes, and DAPI (blue) for cell nuclei. DS1 shows limited GFAP staining, and no AT8 pathology. DS6 shows strong AT8 staining with limited overlap of AT8 staining. DS7 and 9 injected mice display astrocytic plaquelike pathology that either deposits within or around GFAP-positive processes of astrocytes. Scale bars represent 25 μm for left column, and 10 μm for all remaining images. For further quantification and representative images of other strains that display limited astrocytic plaque pathology, see Figure S4.
Figure 5
Figure 5. Tau strains preferentially seed pathology in specific brain regions
(A) Six tau strains were injected simultaneously into six brain regions: sensory cortex (SC); caudate/putamen (CP); visual cortex (VC); hippocampus (Hip); thalamus (Thal); inferior colliculus (IC) (5 μg per region). Mice that received DS1 (negative control), 4, 6, 7, 9, 10, or 11 strain injections were kept for 5-weeks post-inoculation before assessment of AT8 tau pathology (n=3 per condition). (B) Strains preferentially induced tau pathology in specific brain regions. Slices that contained the injection sites were stained for AT8 phospho-tau. Each injection site was assessed in a blinded fashion for tau pathology on a 0-3 scale (none, low, medium, high). The level of background AT8 pathology at each injection site was accounted for by subtracting the level of pathology present in DS1 mice within each brain region. A binned heat map represents the level of pathology observed at the injection site for each strain. Note differences in regional vulnerability. (C) Representative images are displayed for each brain region injected with the different tau strains. Scale bars represent 100 μm. DS10 mossy fiber pathology is shown in Figure S5A.
Figure 6
Figure 6. Strains induce different rates of tau pathology spread
(A) Sedimentation analysis was performed on cell lysate used for the time course inoculation experiment. Each strain contains a large amount of insoluble material (T, total; S, soluble; I, insoluble). Western blot analysis of insoluble tau was performed on three biological replicates. For each experiment, the soluble fraction was loaded at 2× the concentration of the total and insoluble fractions. A cofilin loading control was performed on the blots to verify the same amount of cell lysate was added for each strain. (B) The level of insoluble tau present in each strain was quantified by measuring the mean grey value of the insoluble tau western blot band. Samples were normalized to the mean grey value of cofilin in the total cell lysate fraction. DS1-1 and DS1-2 represent biological replicates of DS1. ANOVA shows strains have significantly more insoluble tau than DS1. A two-way t-test demonstrates DS10 and DS4 do not contain significantly different levels of insoluble tau (ns for P > 0.5; * for P ≤ 0.05; ** for P ≤ 0.01). Error bars represent S.E.M. of biological triplicates. (C) Strains were inoculated into the hippocampus of young PS19 mice (n=5-6 per condition per time point, see Supplemental Table 1). DS6 and 9 lysate diluted 1:10 in HEK293 cell lysate were also injected (n=4-5 per condition per time point). Mice were collected at 4, 8, or 12 weeks. (D) Representative images of ipsilateral and contralateral CA1 are displayed for each strain at 4, 8 and 12 weeks post-injection. AT8-positive tau pathology spreads to the contralateral hippocampus at different time points. Diluted DS6 and 9 lysate show faster spread than concentrated DS4, and more robust spread than DS7 and 10 at 8-weeks post-injection. Scale bars represent 50 μm. See Figure S6 for data regarding strain-specific rod microglial phenotype present at 12 weeks after inoculation. (E) Spread of mossy fiber dot pathology occurs by eight weeks in DS10 mice. Dot pathology appears eventually to develop in DS4 mice, but spread appears delayed compared to DS10.
Figure 7
Figure 7. Strain dictates the rate and pattern of spread of tau pathology
(A) Slices from mice injected with each strain at each time point were stained for AT8 pathology. Tau pathology was quantified in a blinded fashion on a 0-3 scale, and averaged for each location within a given condition (n=5-6 per condition). A continuous heat map was generated. Note differential rates of spread and regional vulnerability. Regions are listed on the x-axis, and conditions/time points are on the y-axis. (B) Limited heat maps were generated from the above data set (Figure 7A). Ipsilateral (Ip) and contralateral (Con) regions were included to assess patterns and rates of spread of pathology (retrosplenial cortex, RS; entorhinal cortex, EC; sensory cortex, SC; thalamus, Thal; CA1 of hippocampus, CA1; locus coruleus, LC; subiculum, Sub). Time points are arranged in order from earliest (4-weeks) to latest (12-weeks). Diluted DS6 and 9 lysates are also displayed (DS6 1:10 and DS9 1:10). (C) Homogenized tissue from the hippocampus, thalamus, or sensory cortex of mice 8-weeks after inoculation with strains was applied to tau biosensor cell lines. After 48-hours, cells were collected and flow cytometry was performed to quantify the level of seeding activity in each region by integrated FRET density (IFD = percent FRET-positive cells*median fluorescent intensity of FRET positive cells) (Holmes et al., 2014). DS4 induces lower spread of seeding activity to the contralateral hippocampus at 8-weeks. DS10 induces high seeding activity despite limited AT8 pathology, while DS7 induces low seeding activity despite high AT8 pathology. DS6 and DS9 also induce seeding activity in the ipsilateral thalamus. A one-way ANOVA with Bonferroni correction for multiple comparisons was performed between ipsilateral DS1 and every other sample within a given region. (* P ≤ 0.05; ** P ≤ 0.01; *** P ≤ 0.001; **** P ≤ 0.0001). Error bars represent S.E.M., n = 4-5. See Figure S7 for data regarding secondary cell line isolation of strains derived from inoculated mice or strain cell lysate.

Comment in

Similar articles

Cited by

References

    1. Armstrong MJ, Castellani RJ, Reich SG. “Rapidly” Progressive Supranuclear Palsy. Mov Disord Clin Pract. 2014;1:70–72. - PMC - PubMed
    1. Arnold SE, Toledo JB, Appleby DH, Xie SX, Wang LS, Baek Y, Wolk DA, Lee EB, Miller BL, Lee VMY, et al. Comparative survey of the topographical distribution of signature molecular lesions in major neurodegenerative diseases. J Comp Neurol. 2013;521:4339–4355. - PMC - PubMed
    1. Barghorn S, Zheng-Fischhöfer Q, Ackmann M, Biernat J, von Bergen M, Mandelkow EM, Mandelkow E. Structure, Microtubule Interactions, and Paired Helical Filament Aggregation by Tau Mutants of Frontotemporal Dementias †. Biochemistry. 2000;39:11714–11721. - PubMed
    1. Bessen RA, Marsh RF. Distinct PrP properties suggest the molecular basis of strain variation in transmissible mink encephalopathy. J Virol. 1994;68:7859–7868. - PMC - PubMed
    1. Boluda S, Iba M, Zhang Bin, Raible KM, Lee VMY, Trojanowski JQ. Differential induction and spread of tau pathology in young PS19 tau transgenic mice following intracerebral injections of pathological tau from Alzheimer's disease or corticobasal degeneration brains. Acta Neuropathol. 2015;129:221–237. - PMC - PubMed