. 2017 Apr 1;312(4):R451-R466.
doi: 10.1152/ajpregu.00353.2016. Epub 2016 Dec 14.

Mechanisms of blood pressure salt sensitivity: new insights from mathematical modeling

Affiliations

Mechanisms of blood pressure salt sensitivity: new insights from mathematical modeling

John S Clemmer et al. Am J Physiol Regul Integr Comp Physiol. .

Abstract

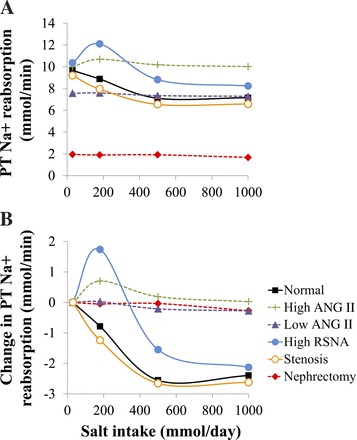
Mathematical modeling is an important tool for understanding quantitative relationships among components of complex physiological systems and for testing competing hypotheses. We used HumMod, a large physiological model, to test hypotheses of blood pressure (BP) salt sensitivity. Systemic hemodynamics, renal, and neurohormonal responses to chronic changes in salt intake were examined during normal renal function, fixed low or high plasma angiotensin II (ANG II) levels, bilateral renal artery stenosis, increased renal sympathetic nerve activity (RSNA), and decreased nephron numbers. Simulations were run for 4 wk at salt intakes ranging from 30 to 1,000 mmol/day. Reducing functional kidney mass or fixing ANG II increased salt sensitivity. Salt sensitivity, associated with inability of ANG II to respond to changes in salt intake, occurred with smaller changes in renal blood flow but greater changes in glomerular filtration rate, renal sodium reabsorption, and total peripheral resistance (TPR). However, clamping TPR at normal or high levels had no major effect on salt sensitivity. There were no clear relationships between BP salt sensitivity and renal vascular resistance or extracellular fluid volume. Our robust mathematical model of cardiovascular, renal, endocrine, and sympathetic nervous system physiology supports the hypothesis that specific types of kidney dysfunction, associated with impaired regulation of ANG II or increased tubular sodium reabsorption, contribute to BP salt sensitivity. However, increased preglomerular resistance, increased RSNA, or inability to decrease TPR does not appear to influence salt sensitivity. This model provides a platform for testing competing concepts of long-term BP control during changes in salt intake.

Keywords: angiotensin II; cardiac output; hypertension; kidney; renin-angiotensin system; salt; vascular resistance.


Figures

Fig. 1.
Fig. 1.
Mean arterial pressure (MAP) during chronic changes in salt intake (30–1,000 mmol/day). A: MAP; B: changes of MAP for salt-sensitive (denoted by dotted lines) and salt-resistant (solid lines) simulations. ANG II, angiotensin II; RSNA, renal sympathetic nerve activity.
Fig. 2.
Fig. 2.
Cardiac output (CO) responses during chronic changes in salt intake. A: absolute values for CO during each salt intake; B: changes in CO with baseline at 30 mmol/day.
Fig. 3.
Fig. 3.
Absolute values (A) and changes of total peripheral vascular resistance (TPR) (B) during changes in salt intake.
Fig. 4.
Fig. 4.
Renal hemodynamics during changes in salt intake. Glomerular filtration rate (GFR) (A) and changes in GFR (B) from a baseline of 30 mmol/day, renal blood flow (RBF) (C), and changes in RBF (D), afferent arteriolar resistance (E), and efferent arteriolar resistance (F) during changes in salt intake from 30 to 1,000 mmol/day are shown.
Fig. 5.
Fig. 5.
Plasma ANG II and aldosterone in response to chronic changes in salt. Absolute values of ANG II (A) and changes in ANG II (B) and plasma aldosterone (C) and changes in plasma aldosterone (D) during changes in salt are shown.
Fig. 6.
Fig. 6.
Proximal tubular (PT) reabsorption of Na+ as salt intake changed from 30 to 1,000 mmol/day are shown as absolute values (A) and changes in PT Na+ reabsorption (B).
Fig. 7.
Fig. 7.
Renal tubular handling of Na+ throughout different segments of the nephron. The Loop of Henle Na+ reabsorption (A), macula densa Na+ concentration (B), distal tubular (DT) Na+ reabsorption (C), and collecting duct (CD) Na+ reabsorption (D) as salt intake changed from 30 to 1,000 mmol/day are shown.
Fig. 8.
Fig. 8.
Na+ and volume retention during different salt intakes. A: blood volume; B: extracellular Na+ mass; C: extracellular fluid volume.
Fig. 9.
Fig. 9.
Effect of increasing salt intake from 180 to 500 mmol/day during normal conditions in which TPR could change (Control) and after clamping nonrenal TPR, either at high (Clamped High TPR) or normal values (Clamped Normal TPR). TPR (A), MAP (B), and cardiac output (CO) (C) are presented as baseline values for 1 wk with subsequent increases in salt intake for 4 wk.
Fig. 10.
Fig. 10.
Renal function curve (pressure natriuresis curve) for each simulation is displayed as the MAP for a given salt excretion (or salt intake, since each data point is after 4 wk and represents a simulation that is in salt balance). Simulations with larger fluctuations in MAP during changes in salt intake are designated salt sensitive (dotted lines). These curves represent the steady-state MAP associated with each sodium intake and sodium excretion load for the various conditions.
Fig. A1.
Fig. A1.
Volume and water transport regulation. Total body water (TBW) is calculated by the sum of three regions (torso compartments), each of which is divided into intracellular and interstitial spaces. Important calculation, variables, parameters are listed. Also included is a diagram of the water flux between the total intracellular, interstitial, and plasma fluid spaces with approximate volumes.
Fig. A2.
Fig. A2.
Control of renal vascular resistance and GFR. Dependent variables are displayed in the left column, whereas factors and effects that impact the dependent variables are listed in the middle column, along with their effect range and input variable that determines the effect. TGF, tubuloglomerular feedback; ANP, atrial natiuretic peptide; FF, filtration fraction; SNGFR, single nephron glomerular filtration rate; PT, proximal tubule; PC, capillary hydrostatic pressure; PBC Bowman’s Capsule hydrostatic pressure; Posm, capillary colloid osmostic pressure. *Indicates a negative relationship.
Fig. A3.
Fig. A3.
Control of sodium reabsorption in the nephron. Dependent variables are displayed in the left column, whereas factors and effects that impact the dependent variables are listed in the middle column, along with their effect range and input variable that determines the effect. ANG II, angiotensin II; ANP, atrial natiuretic peptide; IFP, renal interstitial fluid pressure; GFR, glomerular filtration rate; Aldo, aldosterone. *Indicates a negative relationship.
Fig. A4.
Fig. A4.
Regulation of TGF and hormones. Dependent variables are displayed in the left column, whereas factors and effects that impact the dependent variables are listed in the middle column, along with their effect range and input variable that determines the effect. Calculations are provided for some variables where indicated. TGF, tubuloglomerular feedback; ANP, atrial natiuretic peptide; ANG II, angiotensin II; GU, Goldblatt Units; VD, volume of distribution; ACEactivity, angiotensin-converting enzyme activity; PRA, plasma renin activity; ECFV, extracellular fluid volume; [K+], potassium concentration; ACTH, adrenocorticotropic hormone; G, gram of tissue; Aldo, aldosterone; TBW, total body water; RAP, right atrial pressure; LAP, left atrial pressure. *Indicates a negative relationship.
Fig. A5.
Fig. A5.
Control of organ vascular conductance. Dependent variables are displayed in the left column, whereas factors and effects that impact the dependent variables are listed in the middle column, along with their effect range and input variable that determines the effect. Conductance is calculated from the product of the effects and the baseline conductance. ANG II, angiotensin II; SM, skeletal muscle; Po2, partial pressure of oxygen; ADH, antidiuretic hormone; GI, gastrointestinal; Pco2, partial pressure of carbon dioxide; temp, temperature. *Indicates a negative relationship.

Similar articles

Cited by

References

    1. Abram SR, Hodnett BL, Summers RL, Coleman TG, Hester RL. Quantitative Circulatory Physiology: an integrative mathematical model of human physiology for medical education. Adv Physiol Educ 31: 202–210, 2007. doi:10.1152/advan.00114.2006. - DOI - PubMed
    1. Averina VA, Othmer HG, Fink GD, Osborn JW. A new conceptual paradigm for the haemodynamics of salt-sensitive hypertension: a mathematical modelling approach. J Physiol 590: 5975–5992, 2012. doi:10.1113/jphysiol.2012.228619. - DOI - PMC - PubMed
    1. Averina VA, Othmer HG, Fink GD, Osborn JW. A mathematical model of salt-sensitive hypertension: the neurogenic hypothesis. J Physiol 593: 3065–3075, 2015. doi:10.1113/jphysiol.2014.278317. - DOI - PMC - PubMed
    1. Barba G, Cappuccio FP, Russo L, Stinga F, Iacone R, Strazzullo P. Renal function and blood pressure response to dietary salt restriction in normotensive men. Hypertension 27: 1160–1164, 1996. doi:10.1161/01.HYP.27.5.1160. - DOI - PubMed
    1. Bertram JF, Douglas-Denton RN, Diouf B, Hughson MD, Hoy WE. Human nephron number: implications for health and disease. Pediatr Nephrol 26: 1529–1533, 2011. doi:10.1007/s00467-011-1843-8. - DOI - PubMed

Publication types

Substances

LinkOut - more resources