

Human Facial Shape and Size Heritability and Genetic Correlations
- PMID: 27974501
- PMCID: PMC5289863
- DOI: 10.1534/genetics.116.193185
Human Facial Shape and Size Heritability and Genetic Correlations
Abstract
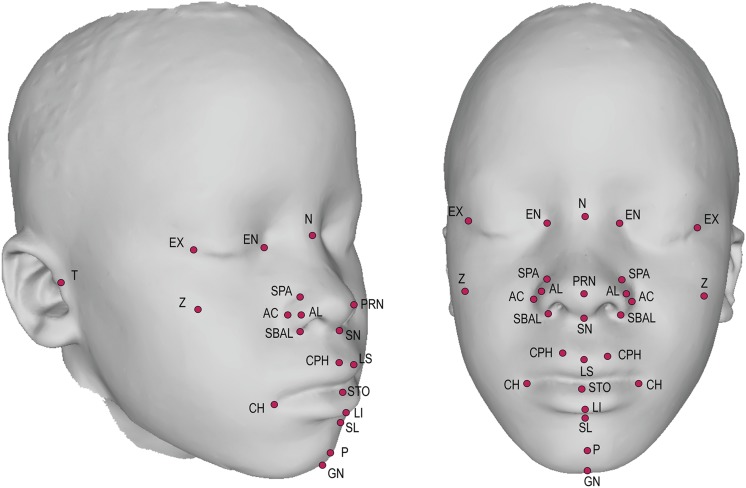
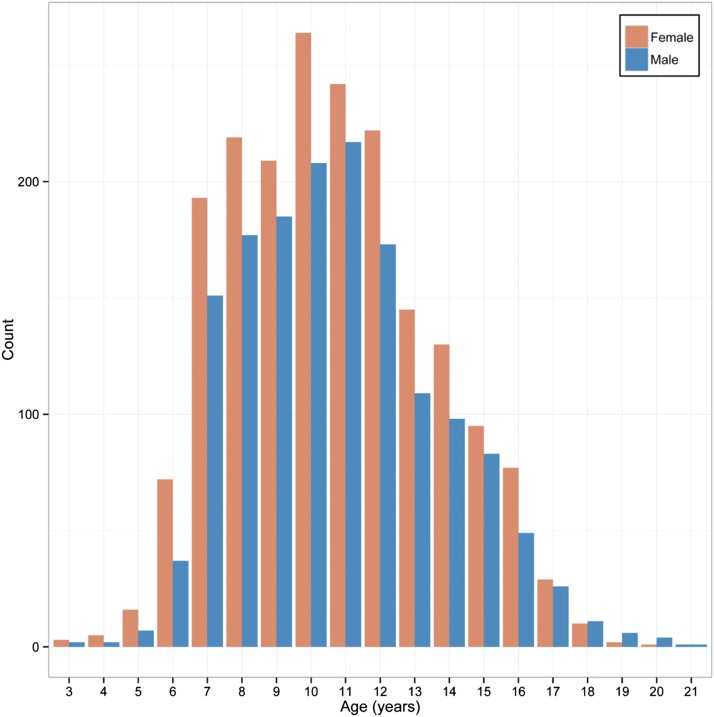
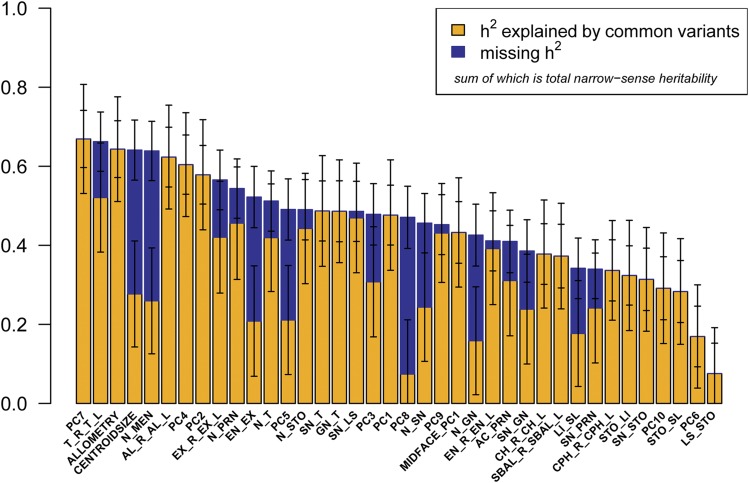
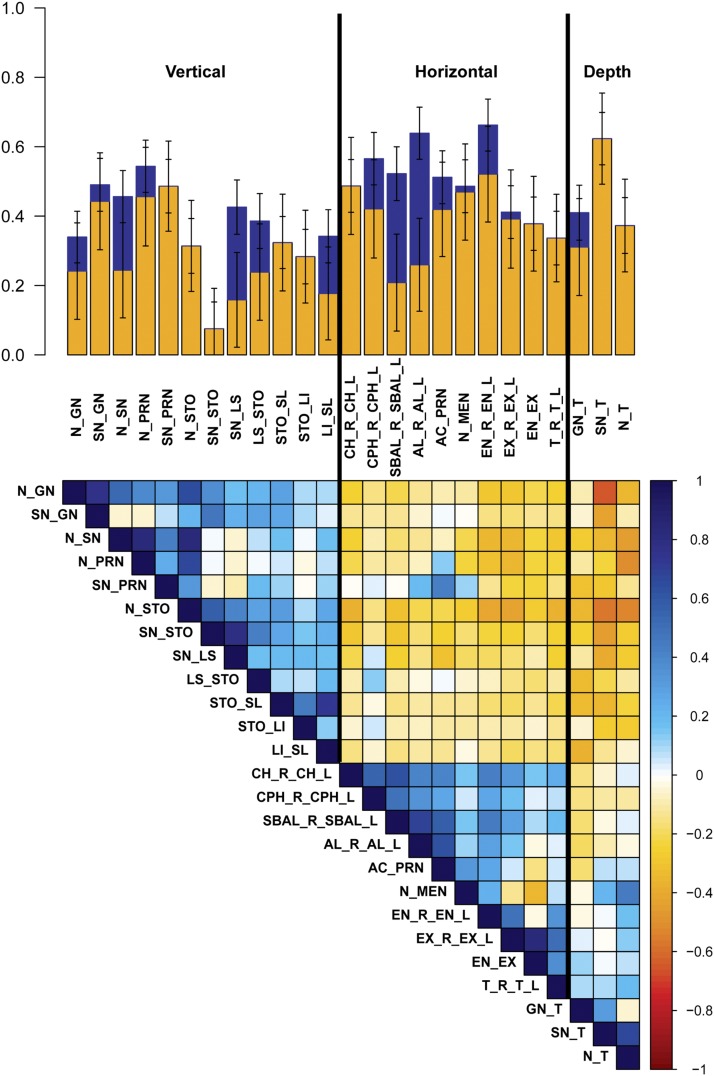
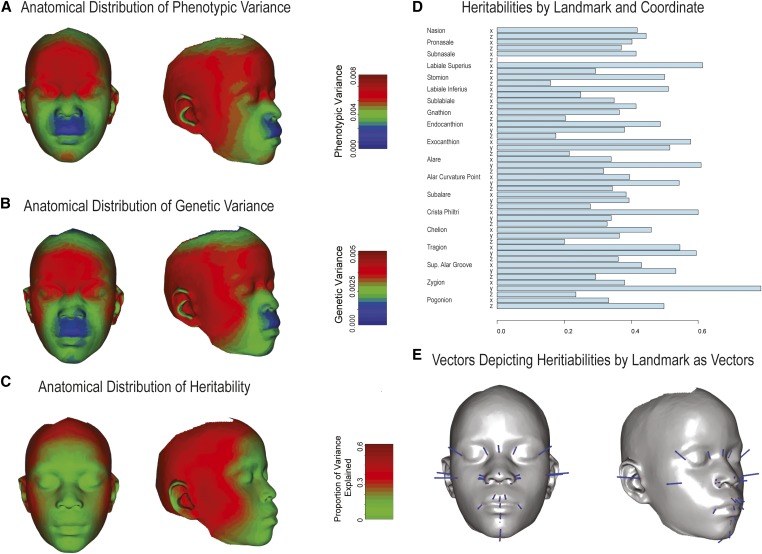
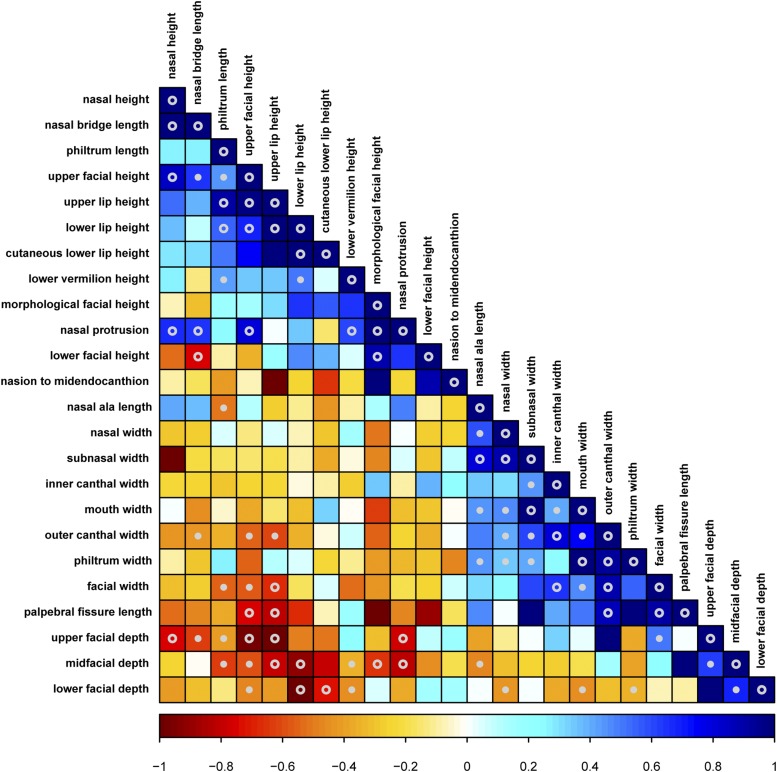
The human face is an array of variable physical features that together make each of us unique and distinguishable. Striking familial facial similarities underscore a genetic component, but little is known of the genes that underlie facial shape differences. Numerous studies have estimated facial shape heritability using various methods. Here, we used advanced three-dimensional imaging technology and quantitative human genetics analysis to estimate narrow-sense heritability, heritability explained by common genetic variation, and pairwise genetic correlations of 38 measures of facial shape and size in normal African Bantu children from Tanzania. Specifically, we fit a linear mixed model of genetic relatedness between close and distant relatives to jointly estimate variance components that correspond to heritability explained by genome-wide common genetic variation and variance explained by uncaptured genetic variation, the sum representing total narrow-sense heritability. Our significant estimates for narrow-sense heritability of specific facial traits range from 28 to 67%, with horizontal measures being slightly more heritable than vertical or depth measures. Furthermore, for over half of facial traits, >90% of narrow-sense heritability can be explained by common genetic variation. We also find high absolute genetic correlation between most traits, indicating large overlap in underlying genetic loci. Not surprisingly, traits measured in the same physical orientation (i.e., both horizontal or both vertical) have high positive genetic correlations, whereas traits in opposite orientations have high negative correlations. The complex genetic architecture of facial shape informs our understanding of the intricate relationships among different facial features as well as overall facial development.
Keywords: complex traits; facial shape; facial size; heritability; morphometrics.
Copyright © 2017 by the Genetics Society of America.
Figures
References
-
- Adams, D. C., and E. Otárola-Castillo, 2013 Geomorph: an R package for the collection and analysis of geometric morphometric shape data. Methods Ecol. Evol. 4: 393–399.
-
- Adams D. C., Collyer M. L., Otarola-Castillo E., Sherratt E., 2014. Geomorph: Software for geometric morphometric analyses. R package version 2.1. https://cran.r-project.org/web/packages/geomorph/geomorph.pdf
-
- Amini F., Borzabadi-Farahani A., 2009. Heritability of dental and skeletal cephalometric variables in monozygous and dizygous Iranian twins. Orthod. Waves 68: 72–79.
Publication types
MeSH terms
Grants and funding
LinkOut - more resources
Full Text Sources
Other Literature Sources
