Review
. 2017 Jan;97(1):283-409.
doi: 10.1152/physrev.00007.2016.

Murine Electrophysiological Models of Cardiac Arrhythmogenesis

Affiliations
Review

Murine Electrophysiological Models of Cardiac Arrhythmogenesis

Christopher L-H Huang. Physiol Rev. 2017 Jan.

Abstract

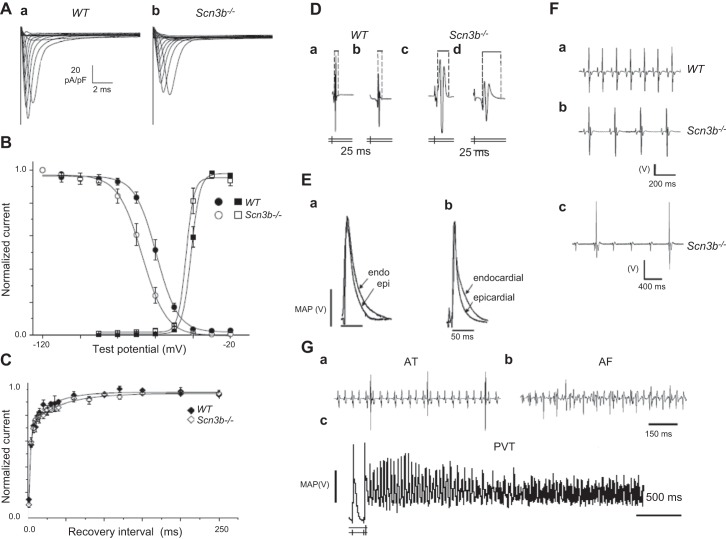
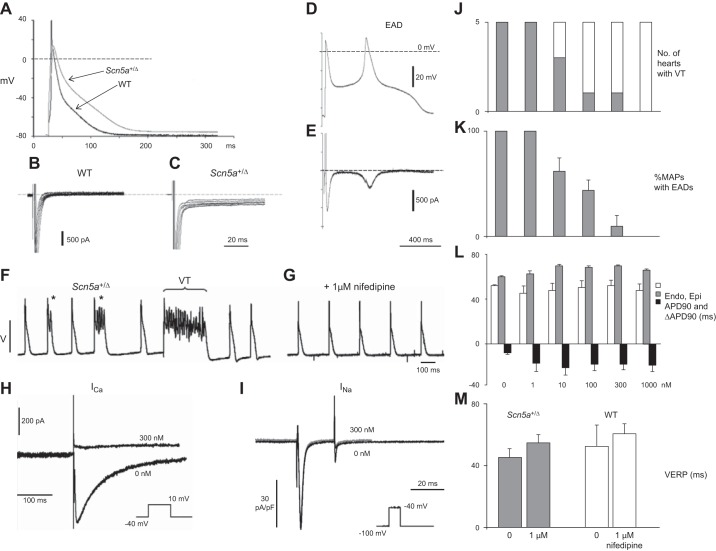
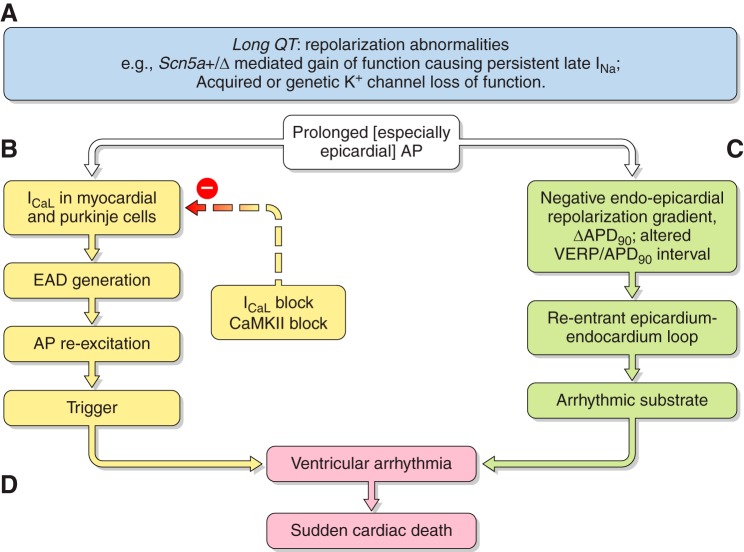
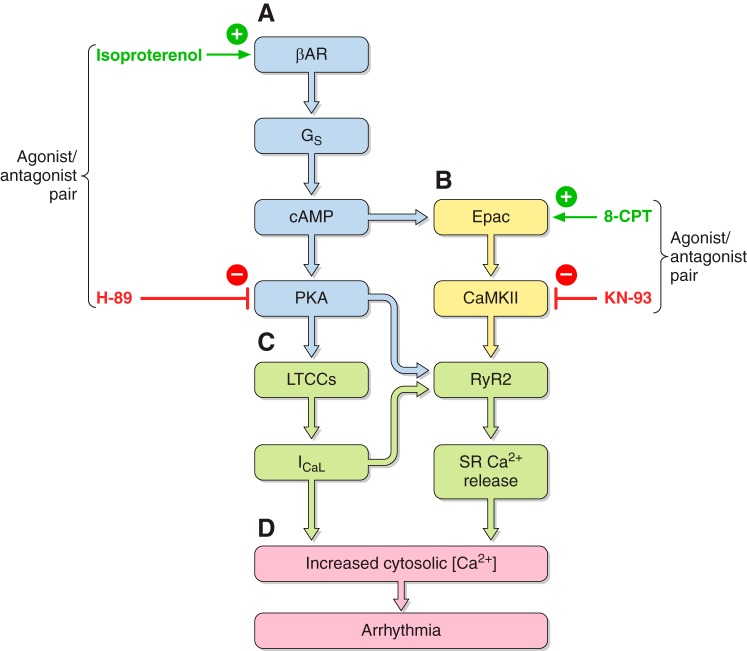
Cardiac arrhythmias can follow disruption of the normal cellular electrophysiological processes underlying excitable activity and their tissue propagation as coherent wavefronts from the primary sinoatrial node pacemaker, through the atria, conducting structures and ventricular myocardium. These physiological events are driven by interacting, voltage-dependent, processes of activation, inactivation, and recovery in the ion channels present in cardiomyocyte membranes. Generation and conduction of these events are further modulated by intracellular Ca2+ homeostasis, and metabolic and structural change. This review describes experimental studies on murine models for known clinical arrhythmic conditions in which these mechanisms were modified by genetic, physiological, or pharmacological manipulation. These exemplars yielded molecular, physiological, and structural phenotypes often directly translatable to their corresponding clinical conditions, which could be investigated at the molecular, cellular, tissue, organ, and whole animal levels. Arrhythmogenesis could be explored during normal pacing activity, regular stimulation, following imposed extra-stimuli, or during progressively incremented steady pacing frequencies. Arrhythmic substrate was identified with temporal and spatial functional heterogeneities predisposing to reentrant excitation phenomena. These could arise from abnormalities in cardiac pacing function, tissue electrical connectivity, and cellular excitation and recovery. Triggering events during or following recovery from action potential excitation could thereby lead to sustained arrhythmia. These surface membrane processes were modified by alterations in cellular Ca2+ homeostasis and energetics, as well as cellular and tissue structural change. Study of murine systems thus offers major insights into both our understanding of normal cardiac activity and its propagation, and their relationship to mechanisms generating clinical arrhythmias.


Figures

Figure 1.
Figure 1.
Basic features of cardiac electrophysiological excitation. Inward (A) and outward (B) ionic current contributions attributable to surface membrane ion channels to human (C) and mouse (D) ventricular action potential (AP) waveforms.
Figure 2.
Figure 2.
Extension of cable analysis to action potential wavelength, wave-break, and re-entry. A: typical murine monophasic right ventricular action potential (AP) waveform, indicating basic cycle length (BCL), action potential duration at 90% recovery (APD90), latency and diastolic interval (DI) of the current (nth) and preceding [(n−1)th]AP. B: these variables yield the active and resting wavelengths λ' and λ0' for which the basic cycle distance, BCD' = λ' + λ0'. C: orthograde propagation of an AP with long λ' over a heterogeneity results in the back of the propagating wave blocking retrograde propagation. D: propagation of an AP with a short λ' results in the back of the wave passing the heterogeneity before retrograde excitation has crossed the unidirectional block. This results in initiation of a new propagating retrograde wave and a re-entrant circuit. [From Matthews et al. (753).]
Figure 3.
Figure 3.
Conditions underlying generation of re-entrant arrhythmia. A: basic features of arrhythmic substrate, consisting of slow conducting myocardial pathway (path 1; dark gray), nonconducting myocardium, and second normally conducting pathway (path 2; white) (i). Normal action potential (blue arrow) propagates with velocity θ and effective refractory period (ERP) resulting in propagation wavelength (λ = θ × ERP) (yellow region) along path 2. It initiates a slow conducting impulse traveling along path 1 (i). In normal activity, the latter impulse cannot re-enter the circuit as it collides with refractory tissue in path 2 (ii). B: an abnormal triggered impulse immediately following the normal action potential cannot enter path 1 as this remains refractory. C: self-perpetuating re-entrant excitation occurs when a retrogradely conducting AP along path 1 (i) enters the beginning of path 2 with reduced conduction velocity and effective refractory period and therefore reduced excitation wavelength smaller than the dimensions of the propagation pathways. [From King et al. (567).]
Figure 4.
Figure 4.
Temporal heterogeneity in the generation of re-entrant substrate. A: classical restitution curves in which action potential duration (APDn) of the nth AP decreases with the decreasing, preceding, (n−1)th, diastolic interval (DI) observed at successively shortened basic cycle lengths (BCL). The accompanying progressively increasing slope requires successively greater number of cycles of alternans to intervene before the system reaches a new steady-state APD (points 1 and 2). When unity slope is reached, alternans become sustained (point 3). Slopes exceeding unity result in waxing oscillations (point 4) in APD. This culminates in conduction block and/or tachyarrhythmia resulting from wave-break. B: fuller analysis of generic restitution function relating APD90 corresponding to the APD at 90% AP recovery to the corresponding DI90. In addition to conventional measures of critical diastolic interval (DIcrit) and maximum gradient (mmax), this maps the maximum APD (APDmax) at low heart rates, DI90 at the effective refractory period (DIERP), and the horizontal axis intercept of the restitution function (DIlimit), corresponding to absolute refractoriness. This permits definition of conditions for stability (unshaded), instability (gray), as well as relative (dark shading) and complete loss of capture (left shaded area). C and D: typical records reflecting arrhythmic phenotypes in monophasic action potential recordings from regularly paced (triangular markers) murine Scn5a+/− right ventricular (RV) epicardia showing nonsustained VT (BCL 134 ms) (C) and the initiation of sustained polymorphic VT (BCL 124 ms) (D). [From Martin et al. (740) and Matthews et al. (752).]
Figure 5.
Figure 5.
Sodium (Na+) currents in Scn5a+/− hearts. A: Na+ currents (INa) normalized to cell capacitance from myocytes from left (LV) and right ventricles (RV) of wild-type and Scn5a+/− hearts. Corresponding current-voltage relationships (B), maximum INa (C), and activation (D) and inactivation (E) curves with Boltzmann fits are shown. *Effect of genotype. #Effect of cardiac ventricle. [From Martin et al. (741).]
Figure 6.
Figure 6.
Re-entrant circuit initiation of ventricular arrhythmia in Scn5a+/− ventricle. A–F: right ventricular (RV) isochronal propagation maps in flecainide-treated Scn5a+/− heart illustrating initiation of ventricular tachycardia (VT). Thick black lines denote propagation block. Thin arrows denote lines of propagation. G: ECG trace with ventricular ectopic initiating polymorphic VT. H: part of the same ECG trace, with 8 electrogram traces, at the point of VT initiation. Electrogram numbers correspond to the channel numbers of the array marked in maps A–F. A: crowded isochronal lines in the last sinus beat and area of conduction slowing. A”: repolarization map of the last sinus beat with increased repolarization heterogeneity in the same area. B: premature ventricular beat superimposed on this leads to line of block with impulse propagation flowing around it. C: a second ventricular ectopic (VE) resulting in a reentrant circuit. D: the circuit continuing into the next beat to initiate VT. E and F: changes in the line of block that create a nonstationary vortex, causing polymorphic arrhythmia. I: propagation map, ECG, and electrogram traces of the VT propagating as a wave front across the LV from the RV. J: ECG trace of a VE occurring after the T wave. [From Martin et al. (736).]
Figure 7.
Figure 7.
Conduction and arrhythmic properties in ageing male Scn5a+/− hearts. A: lead II electrocardiographic traces obtained from anesthetized aged Scn5a+/− mouse showing spontaneous nonsustained ventricular tachycardia (VTs indicated by arrow). B: chest lead ECG complexes from young (a) and old (b) intact anesthetized male Scn5a+/− mice. The latter shows patterns of fragmented QRS complexes, indicating bundle branch block most frequently observed with Scn5a+/−. C and D: activation maps from five successive cardiac cycles in young male WT (C) and old male Scn5a+/− hearts (D). E: picrosirius red staining demonstrating ventricular fibrosis in 85-wk-old WT (a) and Scn5a+/− with mild (b) and severe fibrosis which appears red (c). F: corresponding INa records in ventricular myocytes from 12-wk-old WT (a) and mildly (b) and severely affected Scn5a+/− mice (c). G: frequency distributions of activation times in young male WT (a) and old male Scn5a+/− mice (b). [From Jeevaratnam and co-workers (–503) and Leoni et al. (642).]
Figure 8.
Figure 8.
Development of arrhythmia resulting from a combination of Nav1.5 haploinsufficiency and structural change in progressive cardiac conduction defect (PCCD) and Brugada syndrome (BrS). Nav1.5 haploinsufficiency produces a background electrophysiological defect in conduction. This results in arrhythmic substrate typically unmasked by flecainide or ajmaline challenge. Cardiac fibrotic changes occur with age, particularly in males. This further compromises action potential propagation. Superimposition of the two factors sufficiently compromises conduction, thereby accentuating arrhythmic substrate to lead to arrhythmic events. There is thus a combination of biophysical and structural change with age, particularly in males, that results in arrhythmia. [From Jeevaratnam et al. (500).]
Figure 9.
Figure 9.
Variations in conduction properties through the isolated sinoatrial node of Scn5a+/− hearts with age. A: electrograms and activation mapping in young WT (a) and young Scn5a+/− (b) as well as old WT (c) and old Scn5a+/− atria (d). B and C: sinoatrial node (SAN) cycle lengths (B) and sinoatrial conduction times in the four experimental groups (C). D–F: fibrosis-regulating, TGF-β1, vimentin, and Nav1.5 gene expression and interacting effects of ageing and genotype. D: mRNA abundance assessed by real-time polymerase chain reaction. E: correlations between gene expression of TGF-β1 and Nav1.5 (a), vimentin and Nav1.5 (b), and vimentin and TGF-β1 (c). F: TGF-β1 gene expression initiated by Nav1.5 inhibition with Nav1.5 antibody. TGF-β1 gene expression was increased by Nav1.5 antibody treatment at the transcriptional (a) and protein levels (b) in both human neonatal myocytes and fibroblasts. [From Hao et al. (408).]
Figure 10.
Figure 10.
The Scn3b−/− exemplar for cardiac arrhythmogenesis. A: INa traces from WT (a) and Scn3b−/− myocytes (b) showing peak INa that is significantly smaller in Scn3b−/− myocytes. B: Boltzmann fits to steady-state voltage dependence of activation (squares) and inactivation (circles) in WT (filled symbols) and Scn3b−/− (open symbols). Differing voltage dependence of inactivation in Scn3b−/− compared with WT particularly between holding voltages of −70 and −40 mV. C: recovery from inactivation in WT (filled symbols) and Scn3b−/− (open symbols). D: bipolar electrogram waveforms from programmed electrical stimulation at the longest (a, c) and shortest (b, d) S1–S2 intervals in WT (a, b) and Scn3b−/− hearts (c, d). The latter hearts showed consistently longer waveforms. E: representative monophasic action potential (MAP) recordings from the WT (a) and their shortening in Scn3b−/− hearts (b). F: ECG recordings obtained from WT (a) and Scn3b−/− mice (b). Scn3b−/− mice showed slower heart rates and prolonged PR intervals. c: Some ECGs from Scn3b−/− mice showed ventricular QT complexes occurring independently of regularly occurring atrial P waves, i.e., third degree heart block. G: atrial tachycardia (AT) resulting in regular deflections at a higher frequency (a) and atrial fibrillation (AF) resulting in irregular deflections at a higher frequency following atrial burst pacing (ABP) in Langendorff-perfused Scn3b−/− hearts (b). The ventricular spikes result in the larger, and the atrial spikes in the smaller deflections. c: PES-induced VT beginning as a monomorphic then deteriorating into polymorphic VT in a Scn3b−/− heart preparation. [From Hakim and co-workers (–404).]
Figure 11.
Figure 11.
Separation of contributions to arrhythmogenesis from EADs and transmural APD gradients in Scn5a+/ΔKPQ hearts. A: microelectrode recordings showing action potential prolongation in Scn5a+/ΔKPQ myocytes. B and C: prolonged recovery tail currents after 100 ms test pulses to +40 mV from a −120 mV holding potential in WT (B) and Scn5a+/ΔKPQ myocytes (C). D: action potential (AP) waveforms with early afterdepolarizations (EAD) generating inward late tetrodotoxin (TTX)-sensitive INaL in myocytes in an action potential clamp (E). F and G: epicardial monophasic AP recordings from spontaneously active Scn5a+/ΔKPQ hearts showing multiple EADs and nonsustained VT (F), abolished by 1 μM nifedipine (G). H and I: patch-clamp studies in isolated LV ventricular myocytes from Scn5a+/ΔKPQ hearts demonstrating that nifedipine (300 nM) completely suppressed the inward Ca2+ current following depolarizing steps from a holding voltage of −40 mV to 10 mV (H). In contrast, nifedipine had no effect on inward Na+ currents in response to depolarizing steps from −100 mV to −40 mV (I). J–L: number of hearts showing VT arrhythmia (J), percentage of monophasic action potentials showing EADs in Scn5a+/ΔKPQ hearts (K), and mean ± SE endocardial and epicardial APD90 values and ΔAPD90 in Scn5a+/ΔKPQ (L) at different nifedipine concentrations (0 nM, 1 nM, 10 nM, 100 nM, 300 nM, and 1 μM). M: effects of nifedipine (1 μM) on VERPs of Scn5a+/ΔKPQ and WT hearts. [From Head et al. (416) and Thomas et al. (1128).]
Figure 12.
Figure 12.
Electrophysiological features contributing to arrhythmogenesis in hypokalemic murine ventricles. A: outward and inward K+ currents (a, c) and representations of their respective maximum currents (b, d) from whole cell patch-clamped epicardial (a, b) and endocardial myocytes (c, d) under normokalemic (dark lines) and hypokalemic (3 mM) conditions (pale lines). Under normokalemic conditions, epicardial myocytes (a) showed greater early outward IK than endocardial myocytes (c). However, whereas hypokalemia reduced early outward IK in epicardial but not endocardial cells (b), it reduced inward IK1 in epi- and endocardial cells by similar extents (b, d). B: monophasic AP recordings from LV endocardial and epicardial Langendorff-perfused WT murine hearts paced at 125 ms BCL, under control (5.2 mM [K+]; a) and hypokalemic conditions (3 mM [K+]; b). C: steady-state epicardial (white columns) and endocardial APD90s (gray columns) and the resulting ΔAPD90 (black columns) at [K]o = 5.2 mM (a), 4 mM (b), and 3 mM (c), respectively. D: programmed electrical stimulation (PES) of isolated, WT Langendorff-perfused mouse hearts under normokalemic (a) and hypokalemic 4 mM (b) and 3 mM [K+]o (c) conditions did not induce VT in (a) but induced VT in 2 of 7 hearts in 4 mM [K+]o (b) and 9 of 11 hearts in 3 mM [K+]o (c). E: LV epicardial monophasic action potential (MAP) recordings during intrinsic pacing (a), and programmed electrical stimulation (PES) (b) in the presence of 3 mm [K+]o and 2 μm KN-93. KN-93 reduced the occurrence of early afterdepolarizations (EADs), triggered beats and ventricular tachycardia (VT) in spontaneously beating hearts (a). It failed to protect against arrhythmia provoked by PES in 6 of 6 hearts (b). [From Killeen and co-workers (559, 561).]
Figure 13.
Figure 13.
Development of arrhythmia resulting from a combination of triggering activity and recovery abnormality exemplified by the gain of Nav1.5 function Scn5a+/ΔKPQ, or loss of K+ channel function through genetic modification or hypokalemic challenge in murine exemplars. Emerging from studies of murine exemplars (A), triggered activity results from the prolonged APD predisposing to L-type Ca2+ channel reexcitation, producing triggered action potentials (B). Recovery abnormality, particularly in the epicardium, produces a background electrophysiological defect measurable as a LQTS, resulting in arrhythmic substrate involving alterations in recovery gradients arising from APD and VERP changes in epicardial and endocardial myocardium (C). Together, B and C predispose to arrhythmic events and SCD (D).
Figure 14.
Figure 14.
Signalling pathways underlying excitation-contraction coupling. β-Adrenergic receptor (βAR) activation through stimulatory guanine nucleotide-binding (Gs) proteins increases cellular cAMP levels (A). This in turn drives a phosphokinase-A (PKA)-mediated phosphorylation and activation of L-type Ca2+ channels and cardiac ryanodine receptor (RyR2) SR-Ca2+ release channels (A) and the exchange protein directly activated by cAMP (Epac) pathway producing a calmodulin kinase II (CaMKII)-mediated RyR2 activation (B). Either action on the Ca2+-induced Ca2+ mechanism impinges on the level of SR Ca2+ release (C), and consequent alterations in cytosolic Ca2+ (D). Experimentally used agonists (+) and antagonist (−) agents used on these pathways include isoproterenol, H-89, 8-pCPT-2-O-Me-cAMP (8-CPT), and KN-93.
Figure 15.
Figure 15.
Epac-induced RyR2 activation as an exemplar for Ca2+-mediated arrhythmia. A: propagation of a Ca2+ wave from one end of the cell to the other following 8-CPT challenge shown in successive confocal microscope frame scan images. B: Ca2+ fluorescence signal from six successive 2 μm × 2 μm regions of interest (a–f), placed along the long axis of a myocyte demonstrating progressively increasing delays in onset of the Ca2+ transient. C: Ca2+ signals in regularly stimulated ventricular myocytes (triangles mark timing of pacing stimuli) showing irregularly occurring ectopic Ca2+ transients during 8-CPT treatment (a, b) abolished by KN-93 (c). D: persistent ventricular tachycardia (VT) following programmed electrogram stimulation observed during perfusion with 8-CPT prevented by CaMKII inhibition with KN-93. E: triggered activity (*) during intrinsic activity observed during perfusion with 8-CPT, prevented by KN-93 pretreatment. F: epicardial (a) and endocardial APD90 (b), ΔAPD90 (c), and VERP (d) under control conditions (clear bars), during 1 μM 8-CPT treatment in the absence (black bars) and following 1 μM KN-93 pretreatment (striped bars). [From Hothi et al. (446).]
Figure 16.
Figure 16.
Proarrhythmic features in RyR2-P2328S hearts. A: sequential gallery of confocal microscope images showing Ca2+ waves in a single fluo3-loaded ventricular homozygotic RyR2-P2328S (RyR2S/S) myocyte following isoproterenol (100 nM) challenge. Arrowed: path taken by typical Ca2+ wave. B–D: epicardial monophasic action potentials in intrinsically active RyR2s/s hearts. B: spontaneous early afterdepolarizations (EADs) (*) followed by episodes of sustained monomorphic VT (sVT). C: coupled beats. D: persistent ventricular fibrillation (VF) following the cessation of regular S1 pacing after two intrinsic MAPs. E: S2 extra-stimuli during PES typically producing limited episodes of nonsustained VT in the absence (left trace) but sustained (>30 s) VT in the presence of 100 nm isoproterenol (right trace). F–I: electrophysiological assessment of Na+ channel function in RyR2S/S, Scn5a+/−, and WT atria. F: left atrial intracellular APs showing conduction latencies from WT, Scn5a+/−, and RyR2S/S myocytes and their corresponding (dV/dt)max (G). H and I: loose patch-clamp recordings of currents during a 100 mV 50-ms activation step following 50-ms prepulses between 20 and 100 mV for WT (H) and RyR2S/S atria (I). [From Goddard et al. (364) and King et al. (568).]
Figure 17.
Figure 17.
Physiological features mediating arrhythmogenesis in Pak1-deficient hearts. A: monophasic action potential (AP) recordings showing AP alternans (a), torsades de pointes (TdP) (b), and polymorphic VT (c) following burst pacing (horizontal line below trace) in ex vivo Pak1-cko hearts, features not observed in Pak1-f/f hearts. B: Ca2+ transients in field-stimulated Pak1-f/f (a) and Pak1-cko myocytes (b) at a 1-Hz stimulation frequency under baseline (left traces; i) and chronic β-adrenergic stress conditions (right traces; ii). Increased pacing frequencies increase the occurrence of Ca2+ waves to greater extents in Pak1-cko than Pak1-f/f myocytes particularly with chronic β-adrenergic stress. C and D: recovery of SR Ca2+ stores from after previous depletion by caffeine challenge, after which regular stimulation resumed. i: Ca2+ transients indicating recovery of SR Ca2+ in Pak1-f/f (C) and Pak1-cko myocytes (D) under baseline conditions. a–c: Comparison of increasing Ca2+ transients (ii), constant ICaL (iii), and increasing INCX (iii) at different stages (a–c) of SR Ca2+ recovery. [From Wang et al. (1230).]
Figure 18.
Figure 18.
Scheme exploring relationship between perturbations in Ca2+ homeostasis, triggering, arrhythmic substrate, and generation of arrhythmia. A: acquired or genetic perturbations resulting in increased release of sarcoplasmic reticular (SR) Ca2+ or decreased Ca2+ reuptake from cytosol to store both perturb cytosolic Ca2+ (B). This in turn alters (C) Na+-Ca2+ exchange (NCX) electrogenic activity leading to diastolic triggering phenomena. It can also (D) reduce Nav1.5 synthesis or membrane trafficking and therefore its membrane expression, or directly alter Nav1.5 biophysical properties. Both effects potentially slow conduction, resulting in arrhythmic substrate even under conditions of normal action potential recovery as reflected in action potential duration/effective refractory period (APD/ERP) ratios. Combination of C and D culminates in E, potentially fatal ventricular arrhythmia. Possible direct actions of intermediates arising from metabolic change on INa are not shown for simplicity.
Figure 19.
Figure 19.
Arrhythmogenic features of PGC1β−/− hearts. A: increased heart rate following isoproterenol challenge accompanied by polymorphic ventricular tachycardia (VT) in PGC1β−/− mice during ECG recording. B: monophasic action potential (AP) recordings of VT following programmed electrical stimulation in Langendorff-perfused PGC1β−/− hearts. C: APs from PGC1β−/− ventricular myocytes showing early (EADs) and delayed afterdepolarizations (DADs) and ectopic APs. Inset magnifies voltage trace 40-fold. D: abnormal Ca2+ homeostasis with intermittent elevations in diastolic Ca2+ and Ca2+ waves increased in amplitude and frequency in isoproterenol challenged PGC1β−/− ventricular myocytes. E: voltage-gated ICa and transient and sustained outward IK (F) in response to depolarizing pulses from −40 to +50 mV altered in successive 10-mV increments from a −40 mV holding potential. G: inwardly rectifying currents obtained in response to hyperpolarizing steps from −40 to −100 mV incremented in 10-mV intervals. E–G shown for PGC1β−/− (a) and WT ventricular myocytes (b), with voltage step protocols shown in c. H: step current injections produced single APs with prolonged plateaus with burst AP firing in PGC1β−/− (a) but not WT myocytes (b). [From Gurung et al. (387).]
Figure 20.
Figure 20.
Energetic dysfunction and arrhythmic phenotype. Possible simplified relationships between (A) energetic dysfunction associated with ischemic conditions, cardiac failure, ageing and diabetes, (B) mitochondrial dysfunction associated with ROS production, altered NAD+/NADH, and ATP/ADP and their possible consequences for (C) RyR2-mediated release of SR Ca2+ leading to increased [Ca2+]i, and NCX and DAD triggering activity, and (D) Na+ and K+ channel activity affecting AP excitation, propagation, and recovery potentially resulting in (E) substrate that can be potentially triggered to give arrhythmic phenotypes.
Figure 21.
Figure 21.
The arrhythmic mitogen-activated protein kinase kinase 4 knockout heart as an arrhythmic exemplar for fibrotic change. In vivo and ex vivo cardiac electrophysiological characterizations of mice carrying an atrial cardiomyocyte specific mitogen-activated protein kinase kinase 4 knockout, Mkk4-acko, compared with Mkk4-flox/flox, Mkk4-f/f, controls. A: representative in vivo ECG recordings showing (a) normal rhythm in Mkk4-f/f (a) in contrast to polymorphic atrial ectopic beats and spontaneous atrial tachycardic episodes in Mkk4-acko mice (b). B: ex vivo atrial epicardial monophasic action potential (AP) recordings in Langendorff-perfused hearts during programmed electrical stimulation interposing extrasystolic S2 stimuli following trains of pacing S1 stimuli. These show contrasting persistent sinus rhythm in Mkk4-f/f (a) with observations of frequent AF in Mkk4-acko (b). C: occurrence of atrial arrhythmic events (AT and AF) in young (3 mo) and old (12 mo), Mkk4-f/f and Mkk4-acko, hearts. D: picrosirius red-stained atrial tissue, fibrotic areas dark red, from 3- and 12-mo-old, Mkk4-f/f and Mkk4-acko, mice. E: percentage fibrotic area in 3- and 12-mo-old Mkk4-f/f (white) and Mkk4-acko atria (black bar). F: epicardial multielectrode array (MEA) activation maps resulting from differing AP conduction velocities following pacing in the center of the array in right (RA) and left atria (LA) of Mkk4-f/f and Mkk4-acko mice (a). G: computer modeling of the effects of fibroblast-cardiomyocyte coupling resulting in reentry following a premature beat. A standard S1S2 stimulation protocol is applied at the left edge of the 2D model containing randomly distributed fibroblast populations in which between one and five fibroblasts are coupled to any given cardiomyocyte. Subsequent snapshots demonstrate a breaking down of the wavefront of atrial excitation wave leading to formation of reentrant excitation waves. [From Davies et al. (245).]

Similar articles

Cited by

References

    1. Abbott G. The KCNE2 K+ channel regulatory subunit: ubiquitous influence, complex pathobiology. Gene 569: 162–172, 2015. - PMC - PubMed
    1. Abbott GW, Sesti F, Splawski I, Buck ME, Lehmann MH, Timothy KW, Keating MT, Goldstein SA. MiRP1 forms IKr potassium channels with HERG and is associated with cardiac arrhythmia. Cell 97: 175–187, 1999. - PubMed
    1. Abriel H. Cardiac sodium channel Nav1.5 and interacting proteins: Physiology and pathophysiology. J Mol Cell Cardiol 48: 2–11, 2010. - PubMed
    1. Adebanjo OA, Anandatheerthavarada HK, Koval AP, Moonga BS, Biswas G, Sun L, Sodam BR, Bevis PJ, Huang CLH, Epstein S, Lai FA, Avadhani NG, Zaidi M. A new function for CD38/ADP-ribosyl cyclase in nuclear Ca2+ homeostasis. Nat Cell Biol 1: 409–414, 1999. - PubMed
    1. Adebanjo OA, Shankar VS, Pazianas M, Simon BJ, Lai FA, Huang CLH, Zaidi M. Extracellularly applied ruthenium red and cADP ribose elevate cytosolic Ca2+ in isolated rat osteoclasts. Am J Physiol Renal Fluid Electrolyte Physiol 270: F469–F475, 1996. - PubMed

Publication types

LinkOut - more resources