

In Vivo Imaging with Bioluminescent Enterovirus 71 Allows for Real-Time Visualization of Tissue Tropism and Viral Spread
- PMID: 27974562
- PMCID: PMC5309956
- DOI: 10.1128/JVI.01759-16
In Vivo Imaging with Bioluminescent Enterovirus 71 Allows for Real-Time Visualization of Tissue Tropism and Viral Spread
Abstract
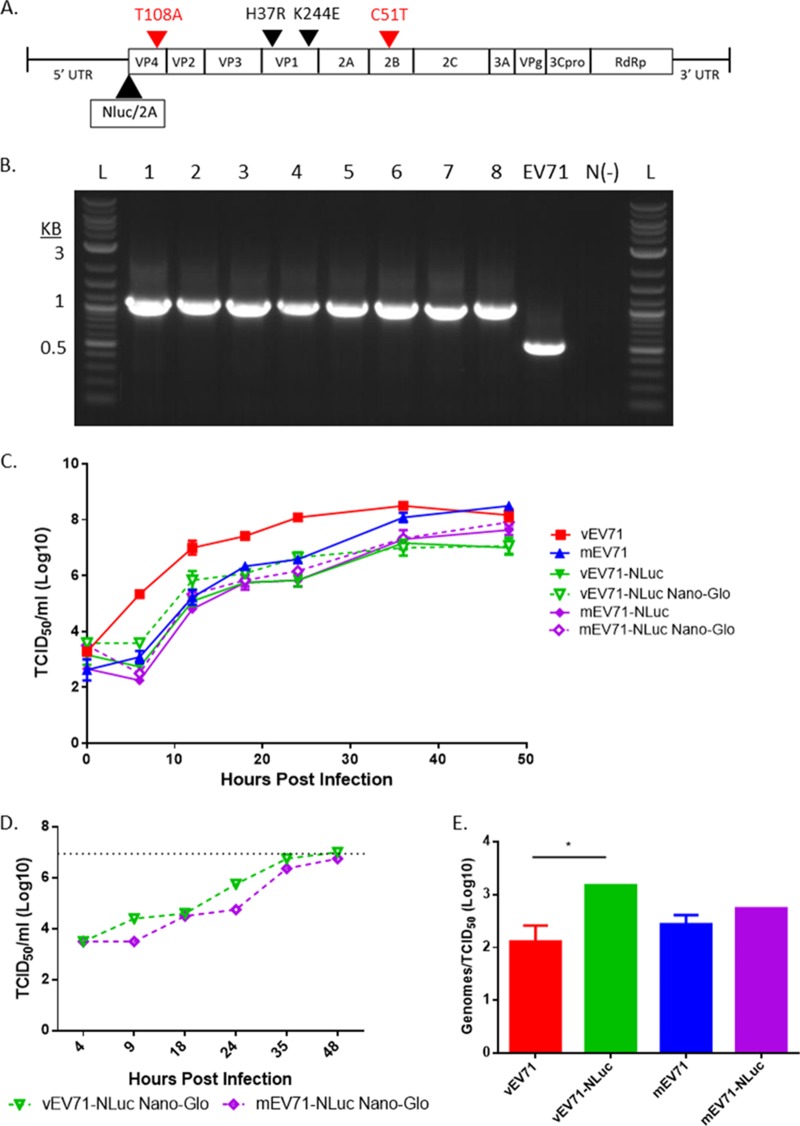
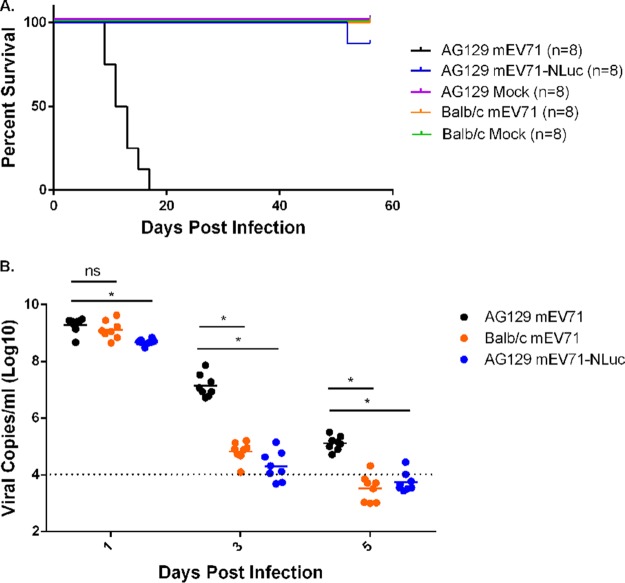
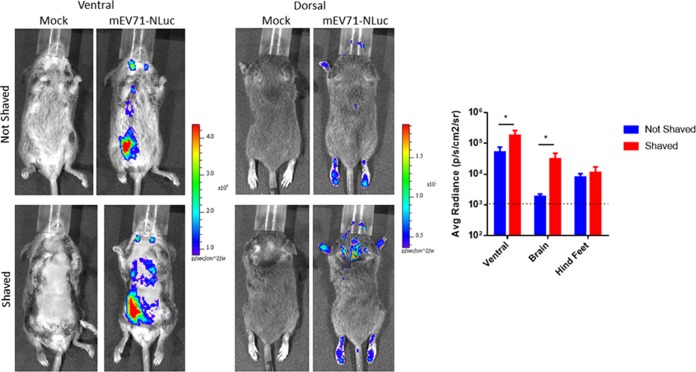
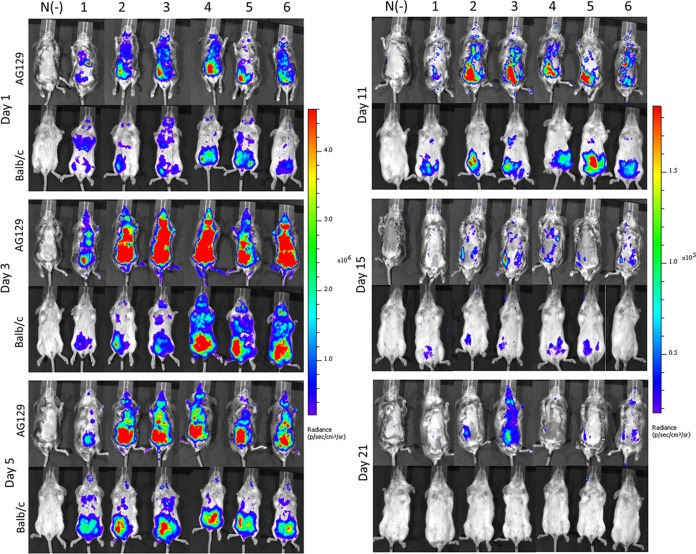
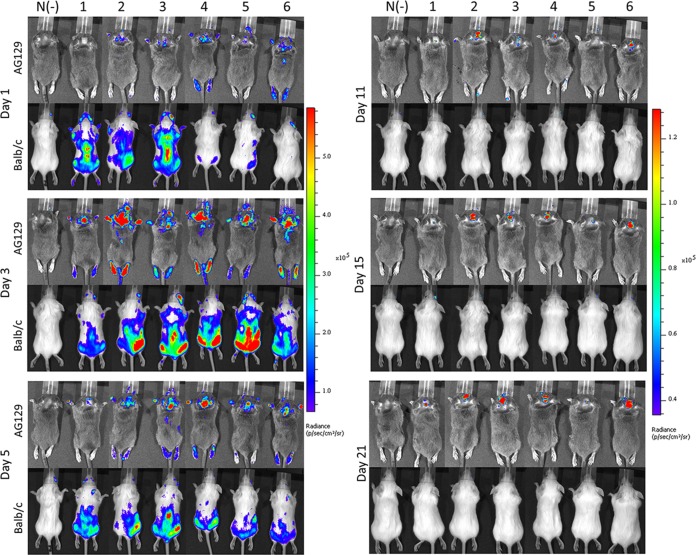
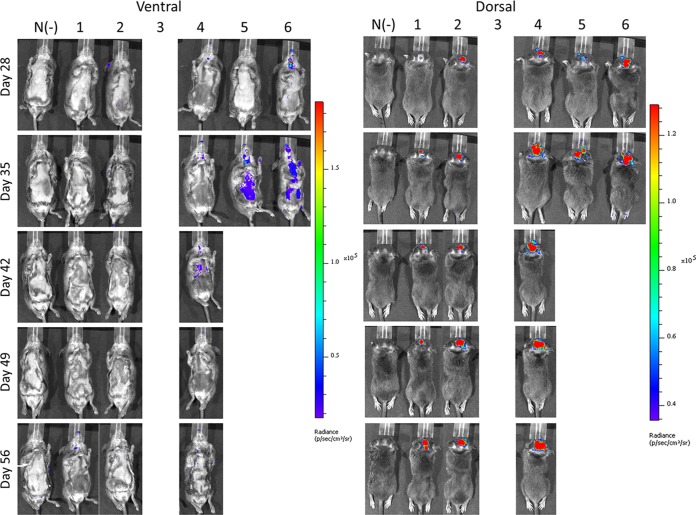
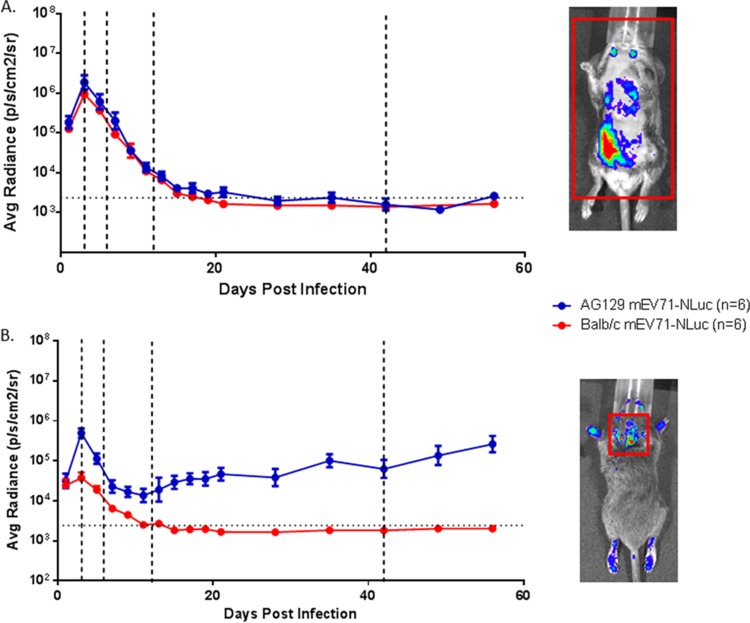
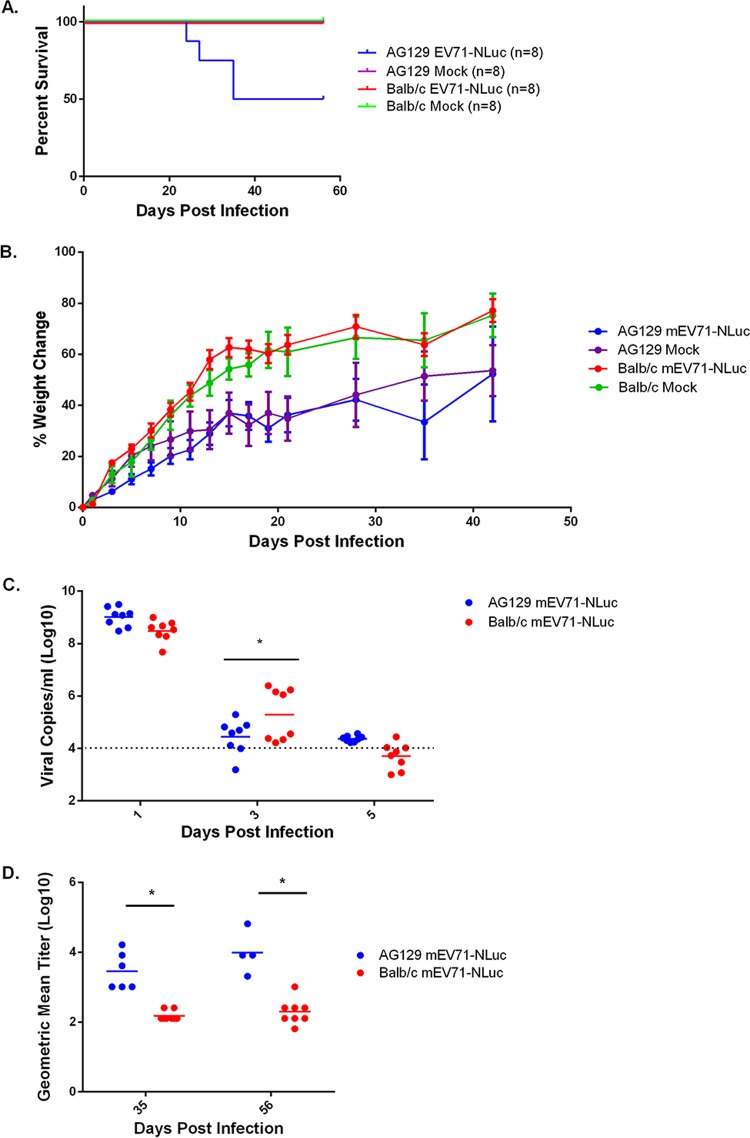
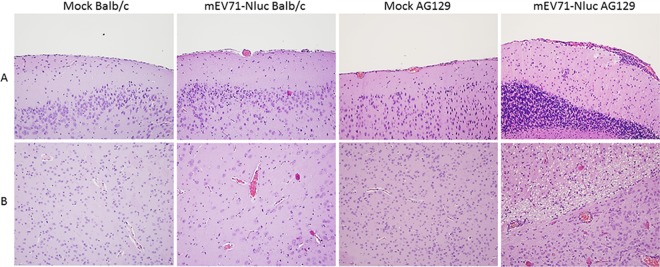
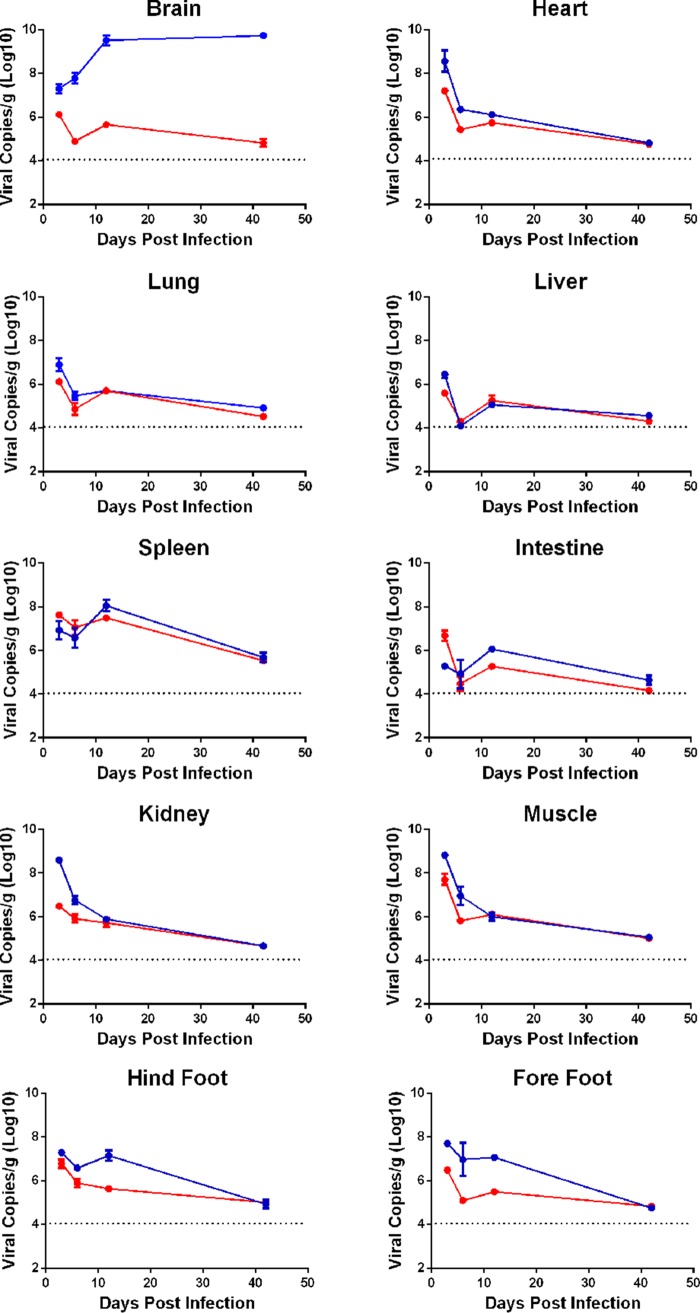
Hand, foot, and mouth disease (HFMD) is a reemerging illness caused by a variety of enteroviruses. The main causative agents are enterovirus 71 (EV71), coxsackievirus A16 (CVA16), and, most recently, coxsackievirus A6 (CVA6). Enterovirus infections can vary from asymptomatic infections to those with a mild fever and blisters on infected individuals' hands, feet, and throats to infections with severe neurological complications. Viral persistence for weeks postinfection (wpi) has also been documented by the demonstration of virus in children's stools. However, little is known about disease progression, viral spread, and tissue tropism of these viruses. These types of studies are limited because many recently developed mouse models mimic the severe neurological complications that occur in a small percentage of enterovirus infections. In the present study, we documented real-time EV71 infection in two different mouse strains by the use of in vivo imaging. Infection of BALB/c mice with a bioluminescent mouse-adapted EV71 construct (mEV71-NLuc) resulted in a lack of clinical signs of disease but in relatively high viral replication, as visualized by luminescence, for 2 wpi. In contrast, mEV71-NLuc infection of AG129 mice (alpha/beta and gamma interferon receptor deficient) showed rapid spread and long-term persistence of the virus in the brain. Interestingly, AG129 mice that survived infection maintained luminescence in the brain for up to 8 wpi. The results we present here will allow future studies on EV71 antiviral drug susceptibility, vaccine efficacy, transmissibility, and pathogenesis. IMPORTANCE We report here that a stable full-length enterovirus 71 (EV71) reporter construct was used to visualize real-time viral spread in AG129 and BALB/c mice. To our knowledge, this is the first report of in vivo imaging of infection with any member of the Picornaviridae family. The nanoluciferase (NLuc) gene, one of the smallest luciferase genes currently available, was shown to be stable in the EV71 genome for eight passages on rhabdomyosarcoma cells. Real-time visualization of EV71 infection in mice identified areas of tropism that would have been missed by traditional methods, including full characterization of EV71 replication in BALB/c mice. Additionally, the bioluminescent construct allowed for increased speed and sensitivity of cell culture assays and will allow future studies involving various degrees of enterovirus infection in mice, not just severe infections. Our data suggest that interferon plays an important role in controlling EV71 infection in the central nervous system of mice.
Keywords: enterovirus 71; in vivo imaging; mouse models; nanoluciferase; pathogenesis; tissue tropism.
Copyright © 2017 American Society for Microbiology.
Figures
Similar articles
-
A Single Mutation in the VP1 of Enterovirus 71 Is Responsible for Increased Virulence and Neurotropism in Adult Interferon-Deficient Mice.J Virol. 2016 Sep 12;90(19):8592-604. doi: 10.1128/JVI.01370-16. Print 2016 Oct 1. J Virol. 2016. PMID: 27440896 Free PMC article.
-
Efficacy of a Trivalent Hand, Foot, and Mouth Disease Vaccine against Enterovirus 71 and Coxsackieviruses A16 and A6 in Mice.Viruses. 2015 Nov 17;7(11):5919-32. doi: 10.3390/v7112916. Viruses. 2015. PMID: 26593938 Free PMC article.
-
In Vitro and In Vivo Inhibition of the Infectivity of Human Enterovirus 71 by a Sulfonated Food Azo Dye, Brilliant Black BN.J Virol. 2019 Aug 13;93(17):e00061-19. doi: 10.1128/JVI.00061-19. Print 2019 Sep 1. J Virol. 2019. PMID: 31167919 Free PMC article.
-
Immunocompetent and Immunodeficient Mouse Models for Enterovirus 71 Pathogenesis and Therapy.Viruses. 2018 Nov 28;10(12):674. doi: 10.3390/v10120674. Viruses. 2018. PMID: 30487421 Free PMC article. Review.
-
Cell and tissue tropism of enterovirus 71 and other enteroviruses infections.J Biomed Sci. 2014 Mar 7;21(1):18. doi: 10.1186/1423-0127-21-18. J Biomed Sci. 2014. PMID: 24602216 Free PMC article. Review.
Cited by
-
Utilization of In Vivo Imaging System to Study Staphylococcal Sepsis and Septic Arthritis Progression in Mouse Model.Pathogens. 2024 Aug 2;13(8):652. doi: 10.3390/pathogens13080652. Pathogens. 2024. PMID: 39204252 Free PMC article.
-
TBK1 and IRF3 are potential therapeutic targets in Enterovirus A71-associated diseases.PLoS Negl Trop Dis. 2023 Jan 10;17(1):e0011001. doi: 10.1371/journal.pntd.0011001. eCollection 2023 Jan. PLoS Negl Trop Dis. 2023. PMID: 36626364 Free PMC article.
-
Emergency Services of Viral RNAs: Repair and Remodeling.Microbiol Mol Biol Rev. 2018 Mar 14;82(2):e00067-17. doi: 10.1128/MMBR.00067-17. Print 2018 Jun. Microbiol Mol Biol Rev. 2018. PMID: 29540453 Free PMC article. Review.
-
A Simple and Robust Approach for Evaluation of Antivirals Using a Recombinant Influenza Virus Expressing Gaussia Luciferase.Viruses. 2018 Jun 13;10(6):325. doi: 10.3390/v10060325. Viruses. 2018. PMID: 29899269 Free PMC article.
-
A novel nanoluciferase-based system to monitor Trypanosoma cruzi infection in mice by bioluminescence imaging.PLoS One. 2018 Apr 19;13(4):e0195879. doi: 10.1371/journal.pone.0195879. eCollection 2018. PLoS One. 2018. PMID: 29672535 Free PMC article.
References
-
- Khetsuriani N, Lamonte-Fowlkes A, Oberste MS, Pallansch MA, Centers for Disease Control and Prevention. 2006. Enterovirus surveillance—United States, 1970–2005. MMWR Surveill Summ 55:1–20. - PubMed
Publication types
MeSH terms
Substances
Grants and funding
LinkOut - more resources
Full Text Sources
Other Literature Sources
Molecular Biology Databases
