. 2017 Jan 31;91(4):e02231-16.
doi: 10.1128/JVI.02231-16. Print 2017 Feb 15.

Within-Host Evolution of Simian Arteriviruses in Crab-Eating Macaques

Affiliations

Within-Host Evolution of Simian Arteriviruses in Crab-Eating Macaques

Louise H Moncla et al. J Virol. .

Abstract

Simian arteriviruses are a diverse clade of viruses infecting captive and wild nonhuman primates. We recently reported that Kibale red colobus virus 1 (KRCV-1) causes a mild and self-limiting disease in experimentally infected crab-eating macaques, while simian hemorrhagic fever virus (SHFV) causes lethal viral hemorrhagic fever. Here we characterize how these viruses evolved during replication in cell culture and in experimentally infected macaques. During passage in cell culture, 68 substitutions that were localized in open reading frames (ORFs) likely associated with host cell entry and exit became fixed in the KRCV-1 genome. However, we did not detect any strong signatures of selection during replication in macaques. We uncovered patterns of evolution that were distinct from those observed in surveys of wild red colobus monkeys, suggesting that these species may exert different adaptive challenges for KRCV-1. During SHFV infection, we detected signatures of selection on ORF 5a and on a small subset of sites in the genome. Overall, our data suggest that patterns of evolution differ markedly among simian arteriviruses and among host species.

Importance: Certain RNA viruses can cross species barriers and cause disease in new hosts. Simian arteriviruses are a diverse group of related viruses that infect captive and wild nonhuman primates, with associated disease severity ranging from apparently asymptomatic infections to severe, viral hemorrhagic fevers. We infected nonhuman primate cell cultures and then crab-eating macaques with either simian hemorrhagic fever virus (SHFV) or Kibale red colobus virus 1 (KRCV-1) and assessed within-host viral evolution. We found that KRCV-1 quickly acquired a large number of substitutions in its genome during replication in cell culture but that evolution in macaques was limited. In contrast, we detected selection focused on SHFV ORFs 5a and 5, which encode putative membrane proteins. These patterns suggest that in addition to diverse pathogenic phenotypes, these viruses may also exhibit distinct patterns of within-host evolution both in vitro and in vivo.

Keywords: evolution; simian arterivirus; simian hemorrhagic fever virus; virology; within-host diversity.


Figures

FIG 1
FIG 1
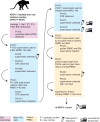
Passage history of KRCV-1 in cell culture. KRCV-1 was isolated from the blood of a wild Ugandan red colobus monkey (RC01), and this isolate was subsequently referred to as KRCV-1-RC01. KRCV-1-RC01 went through a series of passages on primary rhesus monkey broncheoalveolar lavage (BAL) fluid leukocytes (pink-shaded boxes), grivet kidney cells (MARC-145 cells; blue-shaded boxes), and primary rhesus monkey peripheral blood mononuclear cells (PBMCs; yellow-shaded boxes). Each passage is designated by a passage number (e.g., P1, P2) and a day of passage (e.g., D1, D2). A microcentrifuge tube icon indicates attempts to sequence an isolate; a MiSeq instrument icon indicates that sequencing yielded data. Viral RNA content analysis was performed on each day of the P6 passage (data not shown). CPE, cytopathic effect.
FIG 2
FIG 2
KRCV-1 cell culture passage results in the fixation of SNPs in ORFs associated with host cell entry. (a) Images taken during KRCV-1 passage in rhesus monkey leukocytes from bronchoalveolar lavage (BAL) fluid on passage 1, day 3 (P1-D3), and in MARC-145 cells from passage 2, day 18 (P2-D18). The top panel shows two photographs of cytopathic effect (CPE) in BAL fluid leukocytes. The bottom panel shows mock-infected MARC-145 cells on the left and CPE in KRCV-1-infected MARC-145 cells as observed on day 18 in passage 2 (P2-D18) on the right. (b) The numbers of synonymous (blue) and nonsynonymous (red) SNPs detected in each ORF (with reference to KRCV-1-RC01) are shown as a histogram, with the ORF shown on the x axis and the number of SNPs detected in that ORF shown on the y axis. (c) The number of SNPs divided by the number of synonymous or nonsynonymous sites present in each ORF is shown.
FIG 3
FIG 3
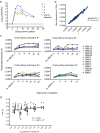
KRCV-1 selection in infected macaques is weak. (a) Log10 viral load in viral RNA copies/ml plasma from each crab-eating macaque infected with KRCV-1. Viral loads were quantified using qRT-PCR. The numbers 1 to 4 indicate the crab-eating macaque animal number. Data taken from reference 17 were replotted here. (b) π was calculated using either the original assemblies or assemblies subsampled to produce even coverage of 1,000× across the entire genome. For each ORF, animal, and time point, the corresponding π value calculated from the original assemblies is plotted on the x axis versus the π value for the same sample calculated from the subsampled assembly on the y axis. The results obtained were very similar, suggesting that uneven genome coverage likely did not impact diversity estimates. (c) KRCV-1 genome nucleotide diversity (π) was estimated for each ORF, day of infection, and infected crab-eating macaque (numbered 1 to 4). (d) The log-transformed π values for every ORF are plotted against the log-transformed viral load values. Regression analysis was performed in R.
FIG 4
FIG 4
Sliding window analysis reveals peaks in KRCV-1 diversity To quantify KRCV-1 diversity on a finer scale, we calculated πN and πS measurements in sliding windows of nine codons, with a step size of one codon. Because several ORFs overlap, we performed these analyses separately for each ORF and then plotted results from every ORF as shown here. Regions with overlapping ORFs will therefore have multiple πN and πS values plotted over top each other. (a) Data for all crab-eating macaques and time points were pooled for this analysis. The πN and πS values represent the mean values at that codon across all macaques and time points. πN is shown as a red line, and πS is shown as a blue line. Below the plot is a cartoon depiction of the organization of the KRCV-1 genome. Replicase genes are shown in gray, ORFs absent in the nonsimian arteriviruses are shown in blue, and ORFs encoding structural proteins are shown in orange. (b) An enlarged rendering of the graph from panel a spanning KRCV-1 genome nucleotide 10,000 to nucleotide 13,000, between which numerous peaks in both synonymous and nonsynonymous diversity are apparent.
FIG 5
FIG 5
No set of SNPs is consistently selected in KRCV-1-infected macaques. For each of the four crab-eating macaques, every SNP detected at the last time point at which virus was detectable is plotted. Each dot represents one SNP; different colors represent the different macaques. No SNPs were found at a high frequency at the last time point of infection in all four macaques. Below the plot is a cartoon depiction of the organization of the KRCV-1 genome. Replicase genes are shown in gray, ORFs absent in the nonsimian arteriviruses are shown in blue, and ORFs encoding structural proteins are shown in orange.
FIG 6
FIG 6
SHFV infection of crab-eating macaques leads to high diversity in ORFs 5a and 5. (a) The plasma viral RNA load is shown for each crab-eating macaque infected with SHFV. Viral loads were quantified using qRT-PCR, with the dotted line indicating the lower limit of quantification for our assay. Animals infected with KRCV-1 prior to SHFV infection are represented by the same colors and shapes (filled circles) as depicted in Fig. 2 but are shown with dashed lines. Animals infected with SHFV only are represented by solid lines with triangles. Data taken from reference 17 were replotted here. (b) π was calculated using either the original assemblies or assemblies subsampled to produce even coverage of 1,000× across the entire genome. For each ORF, animal, and time point, the corresponding π value calculated from the original assemblies is plotted on the x axis versus the π value for the same sample calculated from the subsampled assembly on the y axis. The results obtained were very similar, suggesting that uneven genome coverage likely did not impact diversity estimates. (c) Nucleotide diversity (π) was estimated for each macaque, time point, and ORF and for both SHFV stocks. (d) πN and πS were estimated using a sliding window for ORFs 5 and 5a, and the results for the region of ORF 5-ORF 5a overlap are shown in panel d. Solid lines depict πN values, while dotted lines represent πS values; ORF 5 results are shown in gray, while ORF 5a results are shown in blue.
FIG 7
FIG 7
Three SNPs increase in frequency during SHFV replication. (a, b, and c) Three SNPs that increased in frequency in multiple macaques during replication were identified. (d) A single site was simulated for 5 × 10⁶ virions, for which 76% harbored an A allele and 24% harbored a G allele. Samples of 1,000 alleles were then taken without replacement from this “parental population” to represent the dilution of the stock SHFV to 1,000 PFU. The frequency of the A allele was calculated in each of the 1,000 allele samples and is displayed as a histogram. The y axis represents the number of simulated replicates, and the x axis is the change in frequency of the A allele between the parental and sample populations. A total of 100,000 simulations were performed. The maximum change in frequency observed among all 100,000 replicates was 6%.

Similar articles

Cited by

References

    1. Allen AM, Palmer AE, Tauraso NM, Shelokov A. 1968. Simian hemorrhagic fever. II. Studies in pathology. Am J Trop Med Hyg 17:413–421. - PubMed
    1. London WT. 1977. Epizootiology, transmission and approach to prevention of fatal simian haemorrhagic fever in rhesus monkeys. Nature 268:344–345. doi:10.1038/268344a0. - DOI - PubMed
    1. Palmer AE, Allen AM, Tauraso NM, Shelokov A. 1968. Simian hemorrhagic fever. I. Clinical and epizootiologic aspects of an outbreak among quarantined monkeys. Am J Trop Med Hyg 17:404–412. - PubMed
    1. Tauraso NM, Shelokov A, Palmer AE, Allen AM. 1968. Simian hemorrhagic fever. 3. Isolation and characterization of a viral agent. Am J Trop Med Hyg 17:422–431. - PubMed
    1. Abildgaard C, Harrison J, Espana C, Spangler W, Gribble D. 1975. Simian hemorrhagic fever: studies of coagulation and pathology. Am J Trop Med Hyg 24:537–544. - PubMed

Publication types

LinkOut - more resources