

Improving diet sustainability through evolution of food choices: review of epidemiological studies on the environmental impact of diets
- PMID: 27974596
- PMCID: PMC5155614
- DOI: 10.1093/nutrit/nuw043
Improving diet sustainability through evolution of food choices: review of epidemiological studies on the environmental impact of diets
Abstract
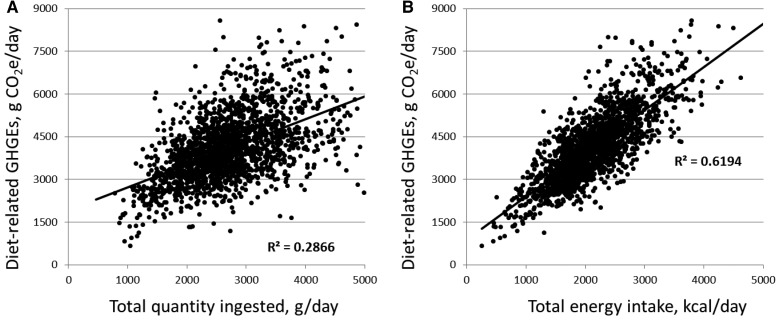
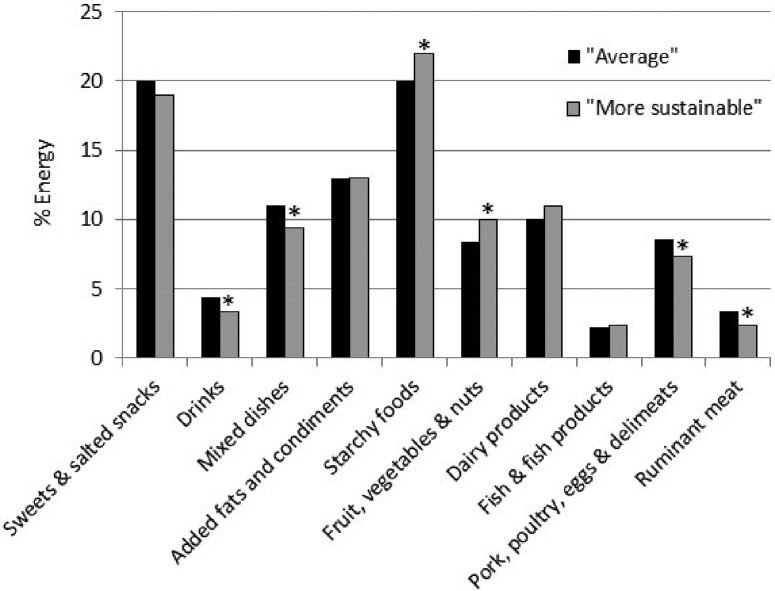
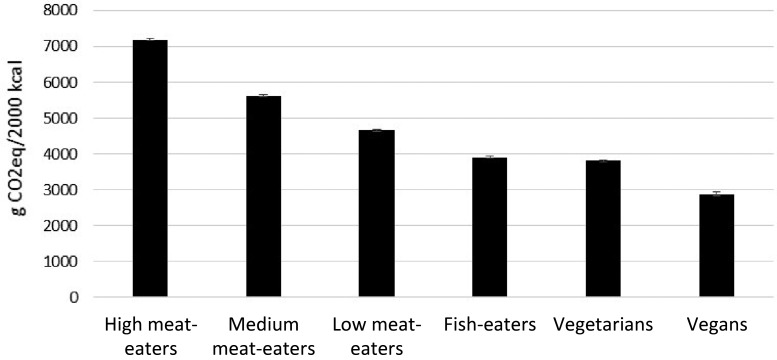
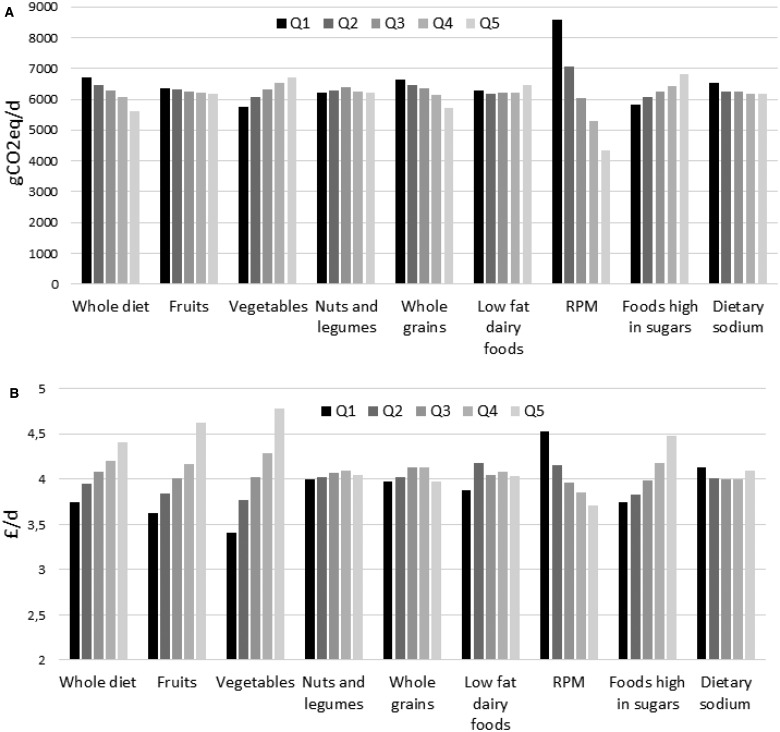
The Food and Agriculture Organization defines sustainable diets as nutritionally adequate, safe, healthy, culturally acceptable, economically affordable diets that have little environmental impact. This review summarizes the studies assessing, at the individual level, both the environmental impact and the nutritional quality or healthiness of self-selected diets. Reductions in meat consumption and energy intake were identified as primary factors for reducing diet-related greenhouse gas emissions. The choice of foods to replace meat, however, was crucial, with some isocaloric substitutions possibly increasing total diet greenhouse gas emissions. Moreover, nutritional adequacy was rarely or only partially assessed, thereby compromising the assessment of diet sustainability. Furthermore, high nutritional quality was not necessarily associated with affordability or lower environmental impact. Hence, when identifying sustainable diets, each dimension needs to be assessed by relevant indicators. Finally, some nonvegetarian self-selected diets consumed by a substantial fraction of the population showed good compatibility with the nutritional, environmental, affordability, and acceptability dimensions. Altogether, the reviewed studies revealed the scarcity of standardized nationally representative data for food prices and environmental indicators and suggest that diet sustainability might be increased without drastic dietary changes.
Keywords: diet cost; food choice; greenhouse gas emissions; nutritional quality; public health; sustainable diet.
© The Author(s) 2016. Published by Oxford University Press on behalf of the International Life Sciences Institute.
Figures
References
-
- Food and Agriculture Organization of the United Nations. Definition of sustainable diets. Paper presented at: International Scientific Symposium: Biodiversity and Sustainable Diets United Against Hunger; November 3–5, 2010; Rome, Italy: http://www.fao.org/ag/humannutrition/28507-0e8d8dc364ee46865d5841c48976e.... Published 2010. Accessed August 1, 2015.
-
- Garnett T. Three perspectives on sustainable food security: efficiency, demand restraint, food system transformation. What role for life cycle assessment? J Clean Prod. 2014;73:10–18.
-
- Carlsson-Kanyama A, Gonzalez AD. Potential contributions of food consumption patterns to climate change. Am J Clin Nutr. 2009;89:1704S–1709S. - PubMed
-
- Pimentel D, Pimentel M. Sustainability of meat-based and plant-based diets and the environment. Am J Clin Nutr. 2003;78:660S–663S. - PubMed
-
- Stehfest E, Bouwman L, van Vuuren D, et al. Climate benefits of changing diet. Clim Change. 2009;95:83–102.
Publication types
MeSH terms
LinkOut - more resources
Full Text Sources
Other Literature Sources
