. 2016 Dec 14;36(50):12511-12529.
doi: 10.1523/JNEUROSCI.1605-16.2016.

Activation of Glutamatergic Fibers in the Anterior NAc Shell Modulates Reward Activity in the aNAcSh, the Lateral Hypothalamus, and Medial Prefrontal Cortex and Transiently Stops Feeding

Affiliations

Activation of Glutamatergic Fibers in the Anterior NAc Shell Modulates Reward Activity in the aNAcSh, the Lateral Hypothalamus, and Medial Prefrontal Cortex and Transiently Stops Feeding

Luis Prado et al. J Neurosci. .

Abstract

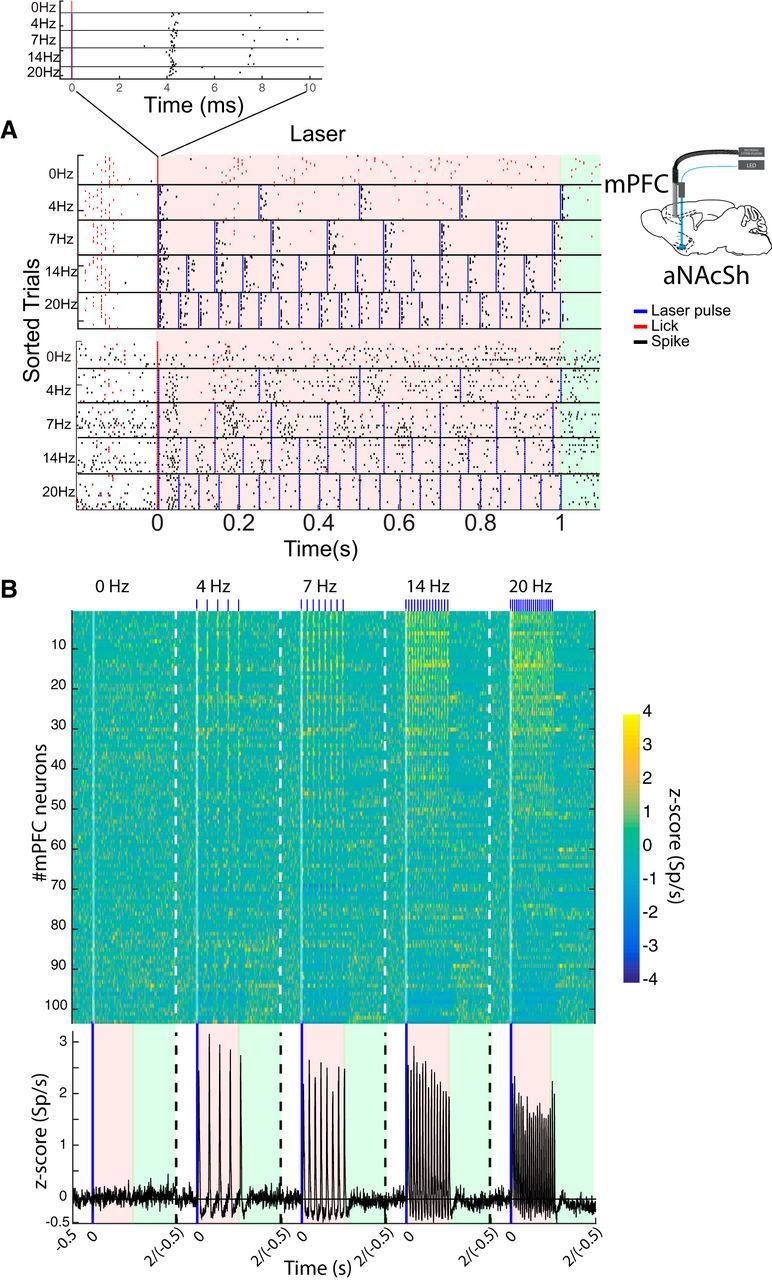
Although the release of mesoaccumbal dopamine is certainly involved in rewarding responses, recent studies point to the importance of the interaction between it and glutamate. One important component of this network is the anterior nucleus accumbens shell (aNAcSh), which sends GABAergic projections into the lateral hypothalamus (LH) and receives extensive glutamatergic inputs from, among others, the medial prefrontal cortex (mPFC). The effects of glutamatergic activation of aNAcSh on the ingestion of rewarding stimuli as well as its effect in the LH and mPFC are not well understood. Therefore, we studied behaving mice that express a light-gated channel (ChR2) in glutamatergic fibers in their aNAcSh while recording from neurons in the aNAcSh, or mPFC or LH. In Thy1-ChR2, but not wild-type, mice activation of aNAcSh fibers transiently stopped the mice licking for sucrose or an empty sipper. Stimulation of aNAcSh fibers both activated and inhibited single-unit responses aNAcSh, mPFC, and LH, in a manner that maintains firing rate homeostasis. One population of licking-inhibited pMSNs in the aNAcSh was also activated by optical stimulation, suggesting their relevance in the cessation of feeding. A rewarding aspect of stimulation of glutamatergic inputs was found when the Thy1-ChR2 mice learned to nose-poke to self-stimulate these inputs, indicating that bulky stimulation of these fibers are rewarding in the sense of wanting. Stimulation of excitatory afferents evoked both monosynaptic and polysynaptic responses distributed in the three recorded areas. In summary, we found that activation of glutamatergic aNAcSh fibers is both rewarding and transiently inhibits feeding.

Significance statement: We have established that the activation of glutamatergic fibers in the anterior nucleus accumbens shell (aNAcSh) transiently stops feeding and yet, because mice self-stimulate, is rewarding in the sense of wanting. Moreover, we have characterized single-unit responses of distributed components of a hedonic network (comprising the aNAcSh, medial prefrontal cortex, and lateral hypothalamus) recruited by activation of glutamatergic aNAcSh afferents that are involved in encoding a positive valence signal important for the wanting of a reward and that transiently stops ongoing consummatory actions, such as licking.

Keywords: Thy1-ChR2; feeding; glutamatergic afferents; licking; optogenetics; reward.


Figures

Figure 1.
Figure 1.
Optogenetic activation of glutamatergic axon fibers activates local aNAcSh medium spiny neurons and fast spiking interneurons. A, A parasagittal brain section of a transgenic mouse expressing the light-gated ion channel, ChR2(H134R)-EYFP. The section shows ChR2 -expressing neurons located at cortical layer V with dense staining of their corticospinal efferent fibers and corticostriatal fibers (Porrero et al., 2010). Dashed line indicates the anteroposterior level of coronal slices used for in vitro experiments. B, Close-up of a sagittal view of aNAcSh cell bodies stained with DAPI showing that the expression of ChR2-EYFP is generally excluded from cell bodies but is abundant in afferent fibers. C1, Schematic drawing indicating, with a red dot, where intracellular recordings were made. Inset, Coronal brain section of a Thy1-ChR2 mouse. The heavy fiber density. C2, Photomicrograph of an MSN with a high density of dendritic spines. This neuron, located in the aNAcSh, was filled with biocytin after electrophysiological recordings. C3, Voltage responses to hyperpolarized and depolarized current injections into the soma of an MSN showing the latency to the first induced action potential (red trace). D, Voltage response induced by depolarizing current injection and the action potentials evoked (black trace). In the same neuron, optogenetic activation of terminals (2 ms, at 7 Hz) evoked a strong depolarization of the MSN that induced action potentials (red traces). E, Voltage-clamp recording in another MSN showing that optogenetic activation of terminals (two pulses of light, 20 ms), evoked a strong inward current (black trace). In presence of AP5 and CNQX (50 and 10 μm, respectively), the inward current was markedly inhibited showing that optogenetic activation evokes glutamate release from these glutamatergic terminals. F, Top, Responses of a fast spiking interneuron to intracellular current injections (bottom), showing a stuttering pattern of firing (red trace) or high-frequency firing (black trace). H, Plot of current-voltage relationship and input resistance of this interneuron. G, Train of action potentials to intracellular current injection (top). The firing frequency was increased after optogenetic stimulation of glutamatergic fibers in the striatum during the train (2 ms, at 7 Hz). I, The same single light pulses were enough to depolarize and evoke action potentials at resting membrane potential (bottom).
Figure 2.
Figure 2.
Global optogenetic stimulation of aNAcSh fibers transiently stops sucrose consumption and delays resumption of sucrose intake. A, The closed-loop freely licking task contains three epochs: Before (four licks), Laser (1 s), and Time out (1 s). For more details, see Materials and Methods. Each red “L” indicates a lick given to a sipper filled with a solution of 10% sucrose. Every four licks given right after the Time out epoch initiate a new Laser epoch. Thus, mice have a direct control over the number of trials and laser stimulation (but not the frequency they receive). B, C, Representative raster plots of licking responses (red ticks) of WT and Thy1-ChR2 licking responses aligned at time = 0 s to the aNAcSh's photostimulation as a function of laser frequency. Optical stimulation in the Thy1-ChR2, but not in the WT mice, rapidly stops licking for sucrose. For an example of this behavior, see also Movie 1. D, Graph showing the number of licks in the 1 s window of the Laser epoch (1 s). E, The Time out epoch. F, Plot of the delay to the first lick after first laser pulse. G, The LI50% value (a measure of the overall sensitivity to photostimulation) was computed from the licking rate during the Laser epoch, as a function of laser's frequency. Left, LI50% of the raster plot shown in B. Middle, Thy1-ChR2 mice shown in C. Rightmost panel, Plot of the average LI50% value for each group. Each dot indicates the average LI50% across all days tested for each subject. Thy1-ChR2 mice displayed different sensitivity levels, but their LI50% values remained constant across stimulation days (data not shown).
Figure 3.
Figure 3.
A single light pulse was sufficient to transiently refrain animals from licking for sucrose. A, The task was identical to that displayed in Figure 2A, except that photostimulation only comprised 0 (Ctrl = control), 1, 2, 3, or 4 blue light pulses (30 ms width each pulse) delivered at a 20 Hz frequency. Shown is a raster plot for licking (red ticks) aligned (time = 0) to light flashes (blue marks). B, Lick rate during the Laser epoch as a function of group. C, Delay (in seconds) for the first lick given after the first laser pulse. This analysis uncovered that all laser pulses delayed resumption of licking relative to control trials.
Figure 4.
Figure 4.
Thy1-ChR2 mice lick an empty sipper to self-photoactivate aNAcSh fibers. A, Representative raster plots of WT (top rows, n = 3) and transgenic mice (bottom rows, n = 3) with animals licking an empty sipper (left and middle columns) or sessions with a sipper filled with sucrose (right column). Each raster represents the licking responses (red ticks) aligned to the photostimulation of the aNAcSh (time = 0) as a function of laser frequency (shown in blue ticks). B, The chronological order of the experiments and the number of licks given to an empty sipper across 7 d (sessions 1–7) of photostimulation, followed by 3 more sessions (sessions 8–10) with a sipper filled with sucrose. C, Same as B, but plots the number of trials per session. D, The number of licks in the 1 s window of Laser epoch given when licking an empty sipper (left) and with a sipper filled with 10% sucrose (right). Bottom, Delay to the first lick after first laser pulse. *p < 0.05 relative to control trials. #p < 0.05 in comparison with the WT mice.
Figure 5.
Figure 5.
Activation of glutamatergic fibers of the aNAcSh is rewarding. A, Graph showing the cumulative number of nose-pokes performed in a 30 min session, the position of the Active and Inactive ports was counterbalanced. In this close-loop task, every nose poke given to the Active port (blue trace) triggered a 1 s train of optical stimulation at 20 Hz, whereas a nose-poke in the Inactive port (red trace) had no programmed consequence. Note how transgenic Thy1-ChR2 mice nose-poked to self-stimulate glutamatergic inputs of the aNAcSh. B, Once animals maintained a constant rate of self-stimulation for at least four sessions, the positions of the Active and Inactive ports were switched. Animals stopped responding to the previously reinforced Active port (blue trace), and they began responding to the new position of the Active port (red trace). Also see Movie 2 for an example of this behavior.
Figure 6.
Figure 6.
Optical stimulation of aNAcSh fibers transiently stops sucrose feeding, but it does not decrease overall intake. A, Plot of the number of licks in stimulated 5 min blocks (blue shading represents 20 Hz, 1 s on and 2 s time out where the laser was off) separated by 5 min unstimulated blocks for WT (n = 3, black) and Thy1-ChR2 mice (n = 3, red). B, Cumulative intake of sucrose across the 30 min session. Arrows indicate periods where transgenic mice experienced an increase in wanting for sucrose. At the end of the session, they ingested approximately the same amount of total sucrose, indicating that activation of these fibers does not induce satiety. C, Optrode recordings in the aNAcSh while a new set of transgenic mice performed the open-loop stimulation task. Raster plot of two neurons recorded: one activated and the other inhibited by the stimulation. Responses were aligned (time = 0) to the onset of a 20 Hz (1 s on 2 s time out) photoactivation train of glutamatergic inputs of the aNAcSh. Thus, responses during the −1 to 0 and 1 to 2 s correspond to the 2 s time out periods. In the y-axis (from top to bottom), trials were plotted in chronological order so the first 100 trials belong to the first −5 to 0 min baseline epoch (BL) block, where sucrose was not available. At time 0 min, sucrose was made available; thus, times 0–5, 10–15, and 20–25 min correspond to the three 5 min stimulated blocks (On), whereas the interleave trials belong to the three unstimulated blocks (Off). The spikes are shown in black ticks for unstimulated (Off) blocks and in blue ticks for stimulated (On) blocks. For visualization purposes, neither licks nor laser ticks are shown. Top raster, The neuron increased its firing rate during the entire 5 min stimulated blocks. This was due to the increased in firing during the laser frequency (time = 0–1 s) and during the 2 s time out period (more easily seen in time = 1–2 s). Activity returned to baseline levels in the unstimulated blocks (see black PSTHs, below). Bottom raster, Neuron that, even when it responded coherently with laser pulses (time 0–1 s), it was inhibited during the stimulated block. This is because the neuron decreased its firing rate during the 2 s time out period (E, blue trace, Inh responses). D, Normalized Z-score population response of all 182 aNAcSh neurons aligned to laser onset for stimulated blocks (blue trace) and to arbitrary trials (3 s chunks) in the unstimulated block (black trace). E, Color-coded Z-score PSTH for all 182 neurons recorded in the task. Responses were sorted using the population PCA analysis; thus, neurons in the top were activated and at bottom inhibited during stimulation of glutamatergic inputs. Bottom, Population PSTH of all active neurons (red trace) and inhibited responses (blue) and population of all neurons recorded (black trace). Responses tend to return to baseline activity during the unstimulated blocks, so the overall activity of the aNAcSh returned to baseline levels; thus, it did not correlate with the acceleration in sucrose intake observed in the unstimulated blocks (see A). Bottommost panel, Activity of a small subset of neurons (n = 15) that displayed a selective rebound activity during the unstimulated blocks. This rebound activity was stronger in the first and second unstimulated blocks where mice tended to accelerate the sucrose intake (A, arrows).
Figure 7.
Figure 7.
Optogenetic stimulation of aNAcSh fibers activates local aNAcSh neurons and stops sucrose feeding. A, Raster plot of a representative aNAcSh neuron during the Baseline, Laser, and Time out epochs (Figs. 2–4). This neuron fired, at all frequencies, coherently with the photostimulation. Spiking responses were aligned to the first laser pulse (time = 0 s) and sorted as a function of laser frequency. Red tick represent a lick given to a sipper filled with sucrose. Black ticks represent single action potentials. The inhibition in the Time out epoch delayed at the higher stimulation frequencies. Right, Inset, Scheme of an optrode implanted in the aNAcSh. B, Representative example of a neuron whose firing rate was inhibited by optical stimulation. The effect is most easily seen at the higher stimulation frequencies. In the Time out epoch, this neuron recovered rapidly. C, Z-score PSTH for all 381 neurons recorded in the licking task in the Baseline, Laser, and Time out epochs. The neurons (y-axis) were sorted as a function of the first PCA scores (see Materials and Methods). x-axis indicates the binned (50 ms) neuronal responses (∼−0.5 to 2 s). The photostimulation onset is at time = 0 s. The Z-score PSTHs for control and 4, 7, 14, and 20 Hz trials were concatenated and displayed as a single PSTH for each recording sessions. Bottom, Population Z-score PSTH of all neurons (activated and inactivated) recorded in the aNAcSh (black trace). The licking rate is shown in red (right axis). The average LI50% was 6.57 ± 0.62 Hz for n = 56 sessions. D, Scatter plot of the firing rate in the Laser epoch during both Controls versus 20 Hz trial types. Neurons depicted in red were activated by the photostimulation and those in blue inhibited. Inset, Percentage of neurons with a significant modulation. E, The percentage of neurons that were significantly entrained for each laser frequency as determined by a coherence analysis (see Materials and Methods). Right, Average coherence value as a function of laser frequency. *Significant with p < 0.05.
Figure 8.
Figure 8.
Feeding modulated and optically stimulated aNAcSh glutamatergic fibers. A, Left, Normalized firing rate (relative to −1.5 to −1 activity) of aNAcSh neurons modulated by the initiation (time = 0 s) of feeding (licking for sucrose). They were classified as inhibited (Inh), activated (Act), or not modulated (NM). Right, Responses of the same neurons, but their responses were now aligned (time = 0 s) to the onset of laser stimulation (at 20 Hz) as a function of whether they covaried (CoV) or did not covary (noCoV) with the laser stimulation. B, Plots of the percentage of putative pMSN, pFSI, and pChAT aNAcSh neurons that were modulated (Inhibited, Activated, and Not modulated) by feeding sucrose. Red rectangle represents the number of neurons that were coherent (covary) with laser stimulation. White rectangle represents the number of neurons that did not covary with the laser stimulation. Right of each bar, Putative cell type of neurons (see Materials and Methods, including neurons that could not be identified [U]) that were modulated in each of the six groups. Percentages may not total 100% because of rounding.
Figure 9.
Figure 9.
Photostimulation of aNAcSh fibers activate mPFC neurons. A, Raster plots of two neurons recorded in two different sessions of licking task for sucrose having Baseline, Laser, and Time out epochs. Top, Neuronal response reliably fired an early single spike (onset = 4.2 ± 0.03 ms) after a pulse of optical stimulation (Top, Inset) and sporadically and with more jitter it evoked a second spike. Bottom, Raster plot represents a neuronal response that was inhibited by laser stimulation (more evident at higher frequencies). The conventions are the same as in Figure 7. Right, Inset, Schematic diagram of the stimulation and recording protocol. B, Plots of the Z-score PSTH for 113 neurons recorded in the mPFC cortex during this task. Neurons (y-axis) were sorted as a function of the first PCA scores. x-axis indicates the binned neuronal activity (∼−0.5 to 2 s). For all concatenated types of trials, the first photostimulation was at time = 0 s. Bottom, Average Z-score PSTH (black trace) of all mPFC-recorded neurons (for visualization purposes, the lick responses are not shown). Pink and green shadows represent the Laser and Time out epochs, respectively.
Figure 10.
Figure 10.
Photostimulation of aNAcSh's fibers modulate the discharge rate of LH neurons. A, Raster plot of two neurons simultaneously recorded during the licking task for sucrose as described in Figure 7. Also shown is a schematic of the recording setup. Referring to the upper LH response, it is seen as the first laser pulse generates a transient burst but in subsequent light pulses, especially at higher frequencies its responses were greatly attenuated. Bottom, The neuron is an example of a LH neuron that was inhibited by laser stimulation B. The color code population Z-score PSTH for 297 LH neurons recorded while mice performed the licking task. Top, Neurons that were activated by the laser. Bottom, Neurons that were inhibited by laser stimulation. For the z-score analysis (bottom), pink and green shadows represent the Laser and Time out epochs, respectively. Arrows indicate the response to the first laser pulse. Black trace represents the normalized population PSTH of all neurons recorded.
Figure 11.
Figure 11.
Photostimulation of aNAcSh's fibers rapidly modulate cortical and subcortical network activity encompassing the mPFC, LH, and the aNAcSh. A, Top, Population PSTH responses in the three tested brain regions of early evoked responses (monosynaptic) during the first laser pulse (30 ms blue line on abscissa) in 4 Hz trials. Bottom, Same as above but plots the long latency responses (polysynaptic) as a function of brain region. Vertical dashed line indicates the division (10 ms) between early versus late responses. B, Number of neurons with statistically significant onsets after the first light pulse. C, Pie chart showing the proportion of putative cell types recorded in the aNAcSh for the early and late responses. D, Schematic representation of antidromic and orthodromic generation of action potential induced by photostimulation of glutamatergic aNAcSh fibers. The numbers in each brain region indicate the average latency onsets in the mPFC, aNAcSh, and LH neurons. In all cases, the population was subdivided in early and late responses, indicated by the vertical dashed line (at 10 ms, B).

Similar articles

Cited by

References

    1. Adams JC. Heavy metal intensification of DAB-based HRP reaction product. J Histochem Cytochem. 1981;29:775. doi: 10.1177/29.6.7252134. - DOI - PubMed
    1. Arenkiel BR, Peca J, Davison IG, Feliciano C, Deisseroth K, Augustine GJ, Ehlers MD, Feng G. In vivo light-induced activation of neural circuitry in transgenic mice expressing channelrhodopsin-2. Neuron. 2007;54:205–218. doi: 10.1016/j.neuron.2007.03.005. - DOI - PMC - PubMed
    1. Berridge CW, Stratford TL, Foote SL, Kelley AE. Distribution of dopamine beta-hydroxylase-like immunoreactive fibers within the shell subregion of the nucleus accumbens. Synapse. 1997;27:230–241. doi: 10.1002/(SICI)1098-2396(199711)27:3<230::AID-SYN8>3.0.CO;2-E. - DOI - PubMed
    1. Berridge KC, Kringelbach ML. Pleasure systems in the brain. Neuron. 2015;86:646–664. doi: 10.1016/j.neuron.2015.02.018. - DOI - PMC - PubMed
    1. Britt JP, Benaliouad F, McDevitt RA, Stuber GD, Wise RA, Bonci A. Synaptic and behavioral profile of multiple glutamatergic inputs to the nucleus accumbens. Neuron. 2012;76:790–803. doi: 10.1016/j.neuron.2012.09.040. - DOI - PMC - PubMed

Publication types

LinkOut - more resources