. 2017 Jan;91(1):49-57.
doi: 10.1124/mol.116.106054. Epub 2016 Nov 10.

Myeloperoxidase Enhances Etoposide and Mitoxantrone-Mediated DNA Damage: A Target for Myeloprotection in Cancer Chemotherapy

Affiliations

Myeloperoxidase Enhances Etoposide and Mitoxantrone-Mediated DNA Damage: A Target for Myeloprotection in Cancer Chemotherapy

Mandeep Atwal et al. Mol Pharmacol. 2017 Jan.

Abstract

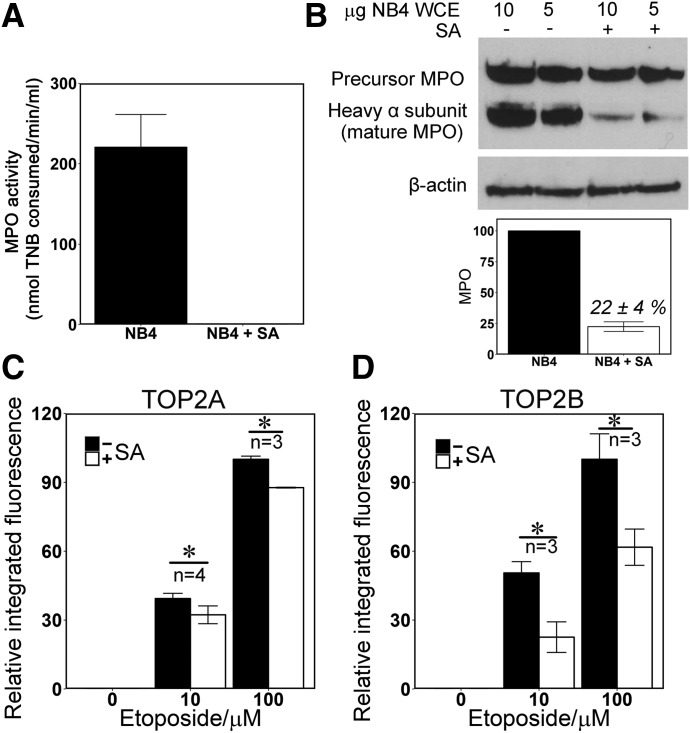
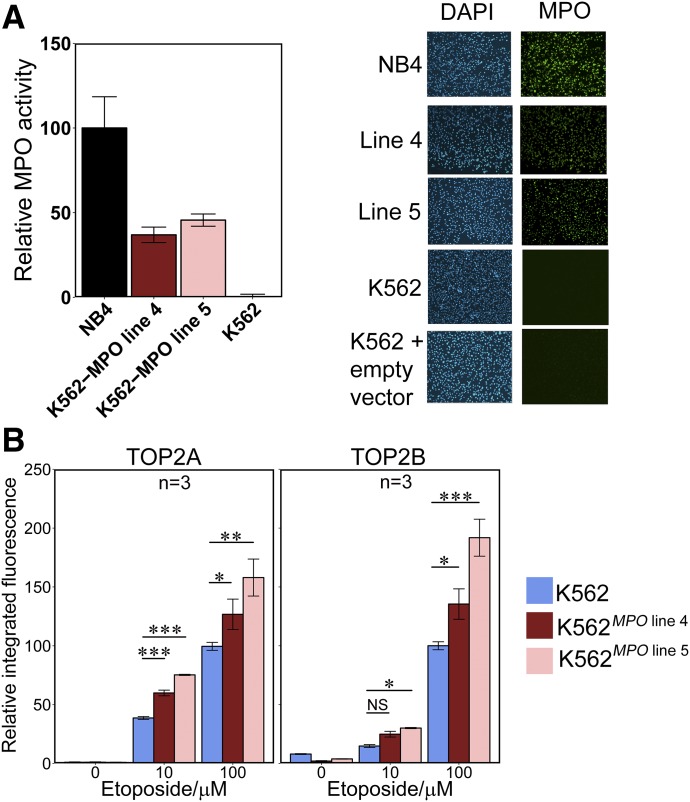
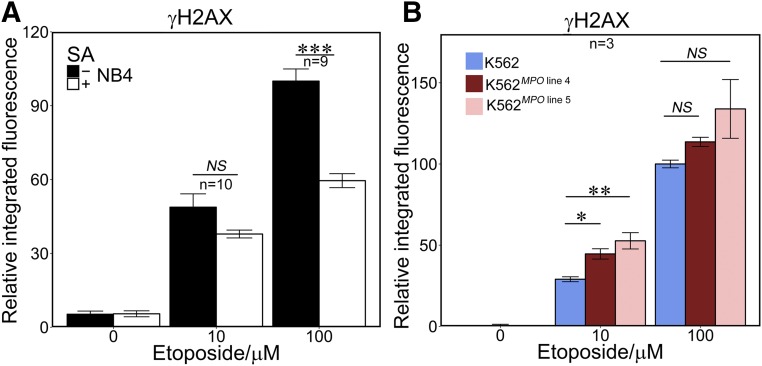
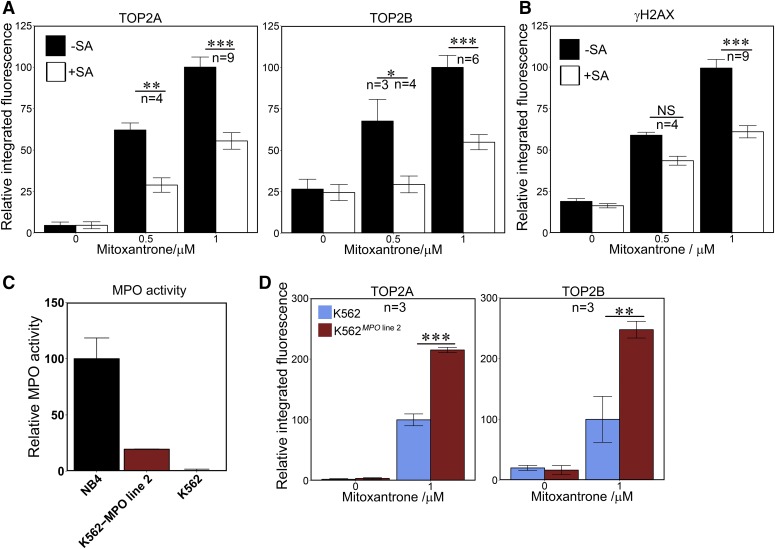
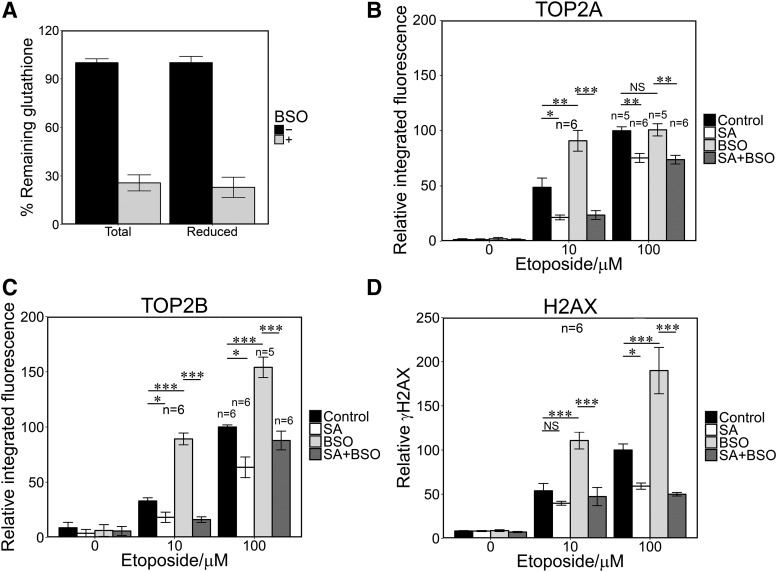
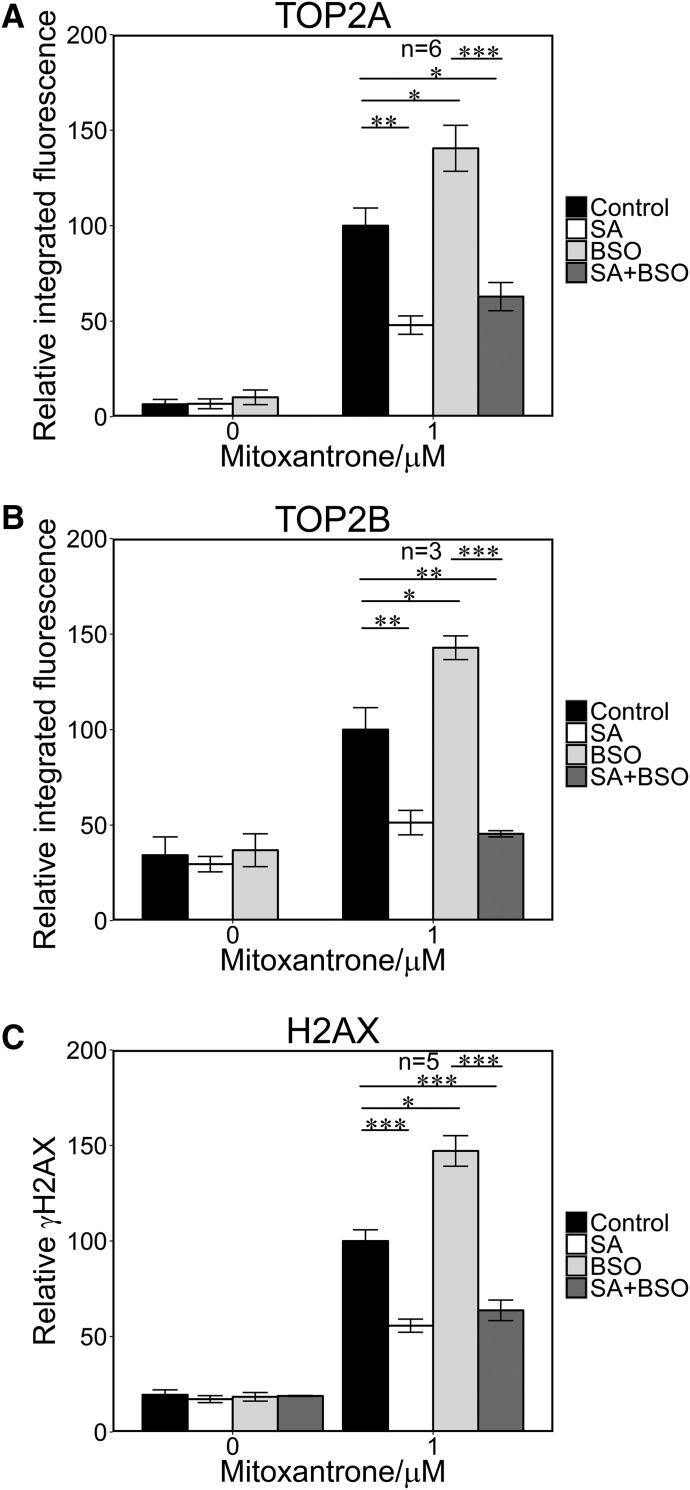
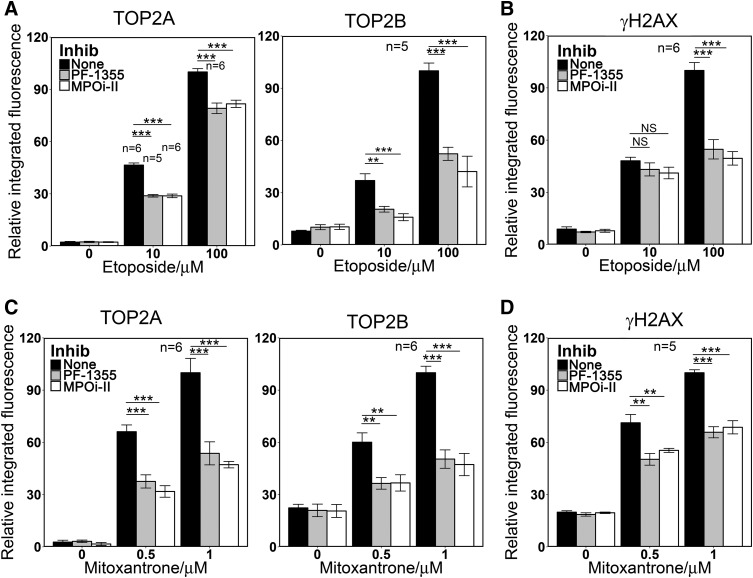
Myeloperoxidase is expressed exclusively in granulocytes and immature myeloid cells and transforms the topoisomerase II (TOP2) poisons etoposide and mitoxantrone to chemical forms that have altered DNA damaging properties. TOP2 poisons are valuable and widely used anticancer drugs, but they are associated with the occurrence of secondary acute myeloid leukemias. These factors have led to the hypothesis that myeloperoxidase inhibition could protect hematopoietic cells from TOP2 poison-mediated genotoxic damage and, therefore, reduce the rate of therapy-related leukemia. We show here that myeloperoxidase activity leads to elevated accumulation of etoposide- and mitoxantrone-induced TOP2A and TOP2B-DNA covalent complexes in cells, which are converted to DNA double-strand breaks. For both drugs, the effect of myeloperoxidase activity was greater for TOP2B than for TOP2A. This is a significant finding because TOP2B has been linked to genetic damage associated with leukemic transformation, including etoposide-induced chromosomal breaks at the MLL and RUNX1 loci. Glutathione depletion, mimicking in vivo conditions experienced during chemotherapy treatment, elicited further MPO-dependent increase in TOP2A and especially TOP2B-DNA complexes and DNA double-strand break formation. Together these results support targeting myeloperoxidase activity to reduce genetic damage leading to therapy-related leukemia, a possibility that is enhanced by the recent development of novel specific myeloperoxidase inhibitors for use in inflammatory diseases involving neutrophil infiltration.


Figures

Fig. 1.
Fig. 1.
MPO inhibition reduces the level of TOP2-DNA covalent complexes formed by etoposide in NB4 cells. (A and B) Succinylacetone (SA) abolished MPO activity (A) and reduced mature protein levels in NB4 cells (B); NB4 cells were treated with 200 µM SA for 48 hours and assayed for MPO activity (A) and MPO protein level by Western blotting of whole cell extracts (B). Blots were quantified by densitometry. (C and D) TOP2-DNA covalent complexes were quantified by TARDIS analysis using antibodies specific to TOP2A (C) or TOP2B (D). Integrated fluorescence values were determined per nucleus (at least 500 nuclei per treatment per replicate experiment). From these, median values were obtained for each treatment and means of the medians were calculated from replicate experiments (n = 3). Data are expressed as a percentage of the mean value obtained with 100 μM etoposide in the absence of SA, ±S.E.M. Integrated fluorescence data corresponding to an individual experiment are also shown in Supplemental Fig. 3, A and B. *P < 0.05.
Fig. 2.
Fig. 2.
Expression of active MPO in K562 cells increases the level of etoposide-stabilized TOP2-DNA covalent complexes. (A) Comparison of MPO activity (left) and MPO immunofluorescence (right) in K562 cells, two MPO-expressing K562-derived cell lines (K562MPO line4 K562MPO line5), and in NB4 cells. (B) K562 and K562MPO cell lines were incubated with 10 or 100 µM Etoposide or a vehicle control for 1 hour. Etoposide-stabilized TOP2-DNA complexes were quantified by TARDIS analysis using antibodies specific for TOP2A or TOP2B as described for Fig. 1. Numbers of replicates are indicated. *P < 0.05; **P < 0.01; ***P < 0.001.
Fig. 3.
Fig. 3.
MPO activity results in raised levels of etoposide-induced H2AX phosphorylation. (A) NB4 cells were pretreated for 48 hours with SA (200 µM) then incubated with etoposide (10 or 100 µM). (B) K562 and K562MPO cell lines were incubated with 10 and 100 µM etoposide or dimethyl sulfoxide vehicle control. For both (A) and (B), γH2AX was quantified by immunofluorescence. Analysis was carried out as described for TARDIS analysis in Fig. 1. Data are expressed relative to the mean values obtained with 100 μM etoposide in the absence of SA (A) or in wild-type parental K562 cells (B). Numbers of replicates are indicated. *P < 0.05; **P < 0.01; ***P < 0.001.
Fig. 4.
Fig. 4.
MPO activity enhances mitoxantrone-induced TOP2-DNA covalent complex formation and H2AX phosphorylation. (A and B) NB4 cells were pretreated with 200 μM SA for 48 hours followed by a 1-hour incubation with 0.5 or 1 μM mitoxantrone, or a vehicle control. TOP2-DNA covalent complexes and γH2AX were quantified as in Figs. 1 and 3. Data are expressed relative to the mean values obtained with 1 μM mitoxantrone in the absence of SA. (C) Quantification of MPO activity in K562MPO line 2 compared with NB4 and parental K562 cells. (D) MPO expression in K562 cells results in enhanced mitoxantrone-induced TOP2-DNA protein complex formation. Data are expressed relative to the mean value obtained for parental K562 cells treated with 1 μM mitoxantrone. Numbers of replicates are indicated. *P < 0.05; **P < 0.01; ***P < 0.001.
Fig. 5.
Fig. 5.
Glutathione depletion increases etoposide-mediated TOP2-DNA covalent complex formation and H2AX phosphorylation. (A) BSO preincubation (150 μM, 4.5 hours) resulted in 70% reduction of total and reduced glutathione in NB4 cells. (B–D) NB4 cells were incubated in the presence or absence of SA (200 μM) for 48 hours, BSO (150 μM) for 4.5 hours, with both or with neither, followed by addition of 10 or 100 μM etoposide for 1 hour. TARDIS and γH2AX assays were performed as described in Figs 1 and 3. Numbers of replicates are indicated. *P < 0.05; **P < 0.01; ***P < 0.001.
Fig. 6.
Fig. 6.
Glutathione depletion potentiates mitoxantrone-mediated TOP2 covalent complex formation and H2AX phosphorylation. NB4 cells were preincubated with SA, BSO, or both as described for Fig 4, followed by addition of 1 μM mitoxantrone for 1 hour. TOP2A TARDIS (A), TOP2B TARDIS (B), and γH2AX assays (C) were performed as described in Figs 1 and 3. *P < 0.05; **P < 0.01; ***P < 0.001.
Fig. 7.
Fig. 7.
Direct MPO inhibition reduces the level of TOP2-DNA covalent complexes formation and H2AX phosphorylation induced by etoposide or mitoxantrone in NB4 cells. (A and B) NB4 cells were pretreated with MPO inhibitors PF-1355 (10 μM, 4 hours) or MPOi-II (5 μM, 4 hours) before adding 10 or 100 μM etoposide or a vehicle control for 1 hour. (C and D) NB4 cells were pretreated with MPO inhibitors as in (A and B) before adding 0.5 or 1 μM mitoxantrone or a vehicle control for 1 hour. TOP2-DNA covalent complexes (A and C) and γH2AX (B and D) were quantified as in Figs 1 and 3. Numbers of replicates are indicated. **P < 0.01; ***P < 0.001.

References

    1. Allan JM, Travis LB. (2005) Mechanisms of therapy-related carcinogenesis. Nat Rev Cancer 5:943–955. - PubMed
    1. Austin CA, Marsh KL. (1998) Eukaryotic DNA topoisomerase II β. BioEssays 20:215–226. - PubMed
    1. Azarova AM, Lyu YL, Lin C-P, Tsai Y-C, Lau JY-N, Wang JC, Liu LF. (2007) Roles of DNA topoisomerase II isozymes in chemotherapy and secondary malignancies. Proc Natl Acad Sci USA 104:11014–11019. - PMC - PubMed
    1. Burma S, Chen BP, Murphy M, Kurimasa A, Chen DJ. (2001) ATM phosphorylates histone H2AX in response to DNA double-strand breaks. J Biol Chem 276:42462–42467. - PubMed
    1. Cowell IG, Austin CA. (2012) Mechanism of generation of therapy related leukemia in response to anti-topoisomerase II agents. Int J Environ Res Public Health 9:2075–2091. - PMC - PubMed

MeSH terms