. 2016 Dec 14;540(7633):395-399.
doi: 10.1038/nature20595.

The seahorse genome and the evolution of its specialized morphology

Affiliations

The seahorse genome and the evolution of its specialized morphology

Qiang Lin et al. Nature. .

Abstract

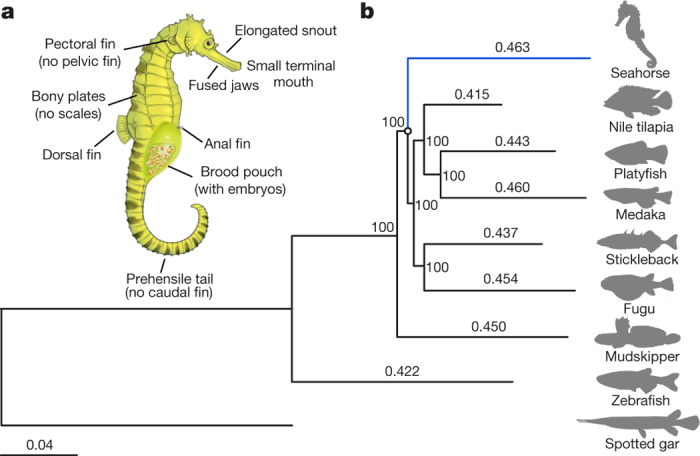
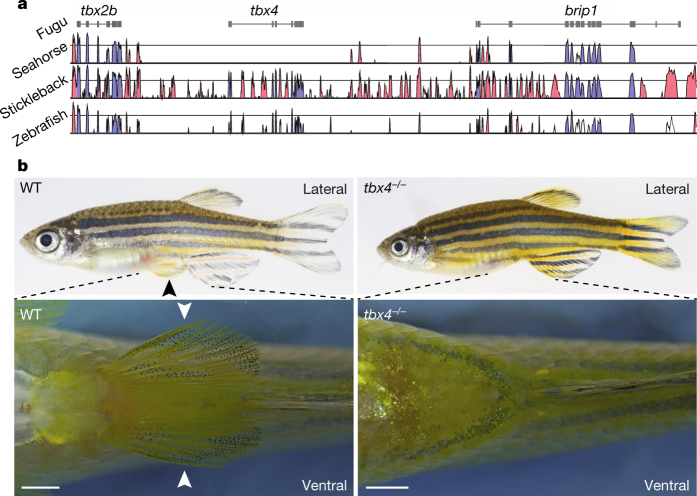
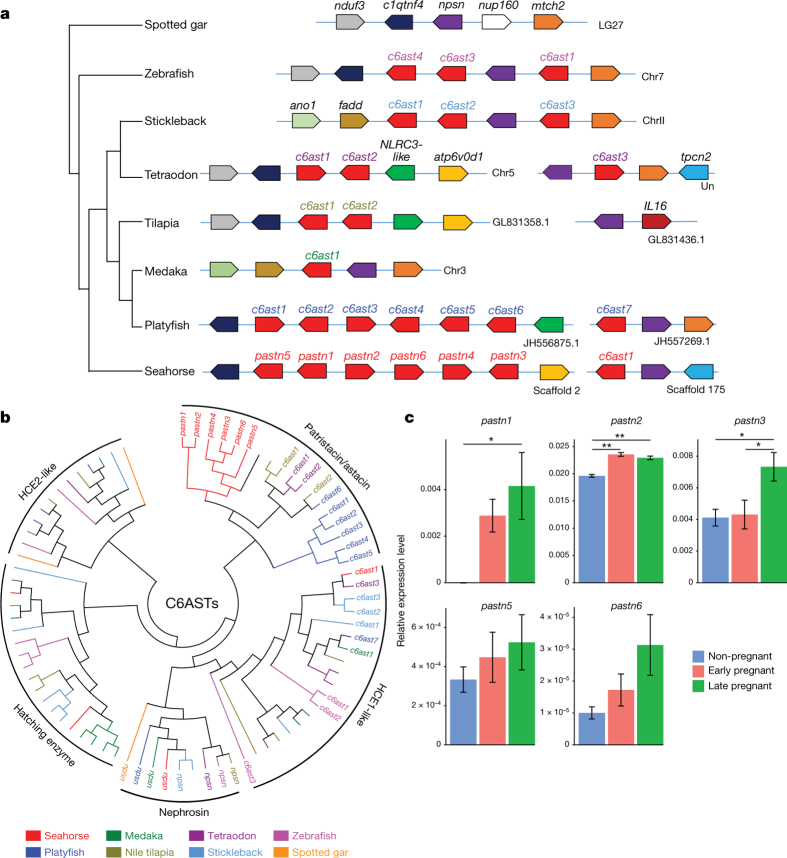
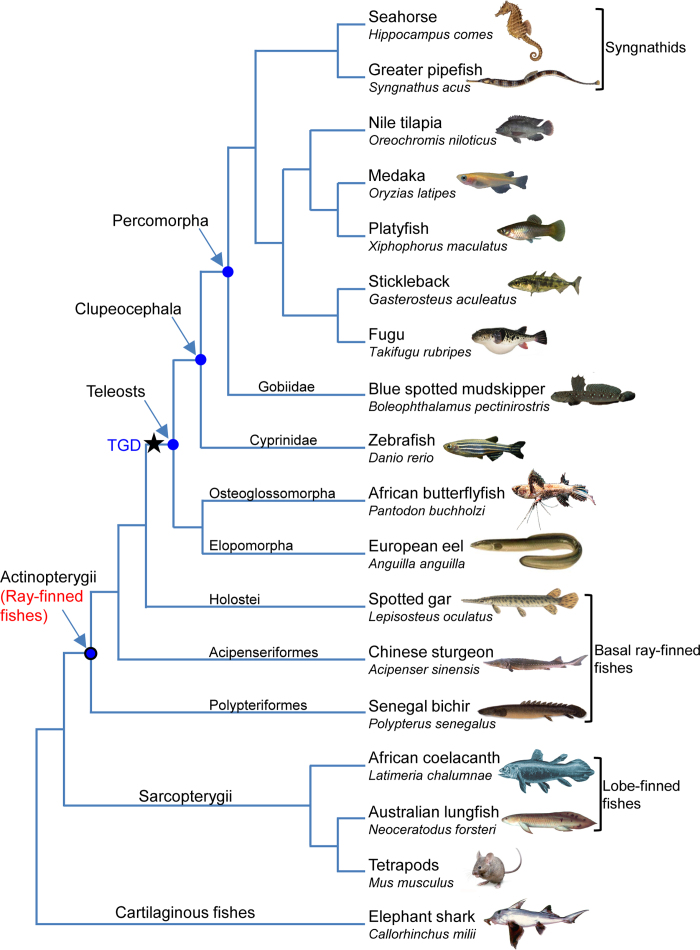
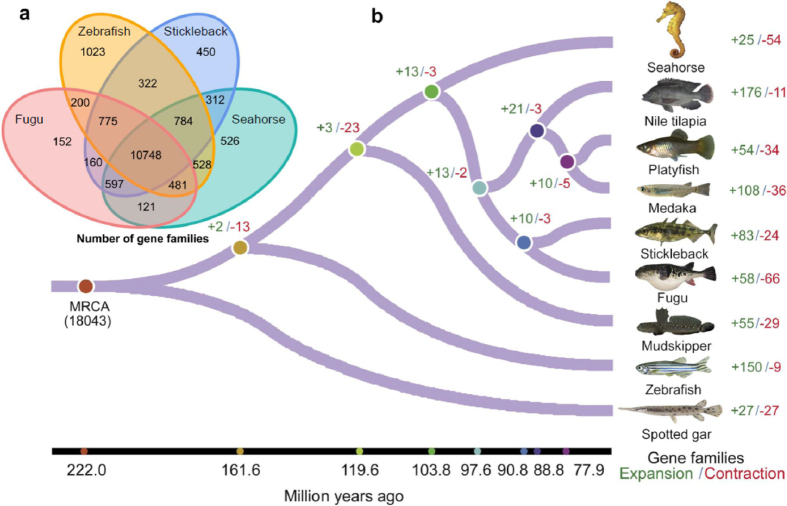
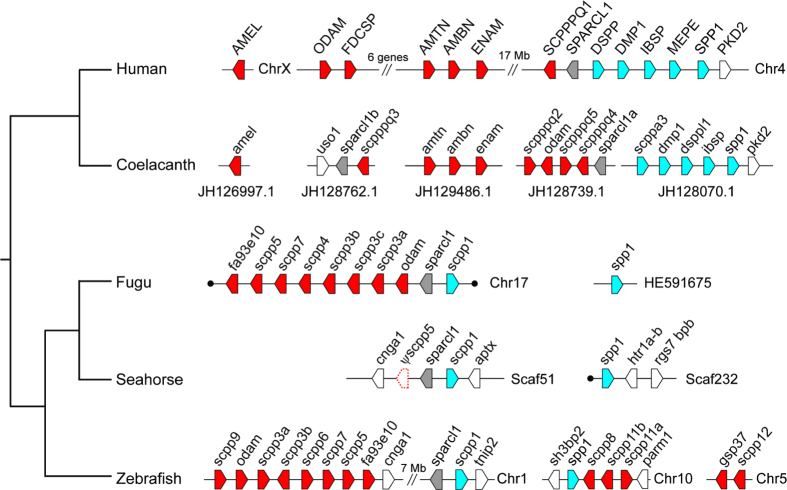
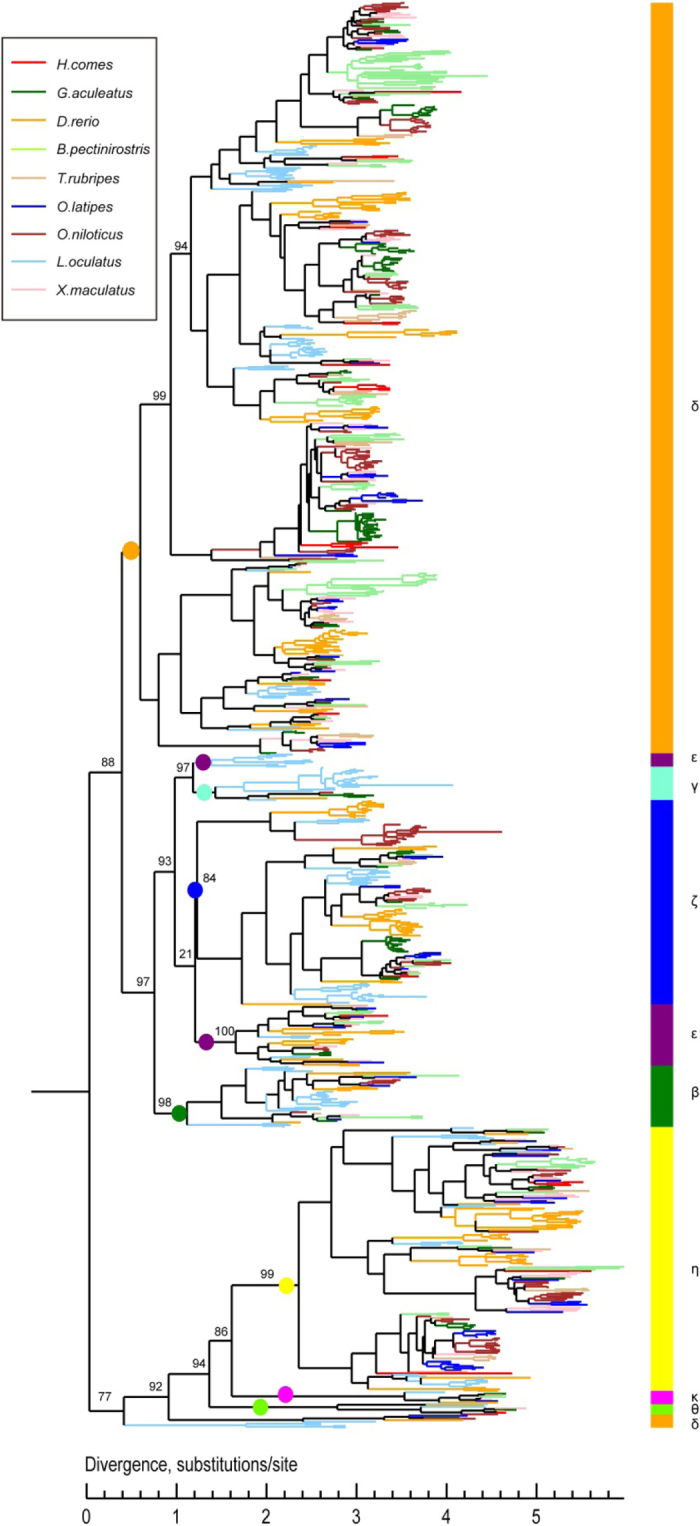
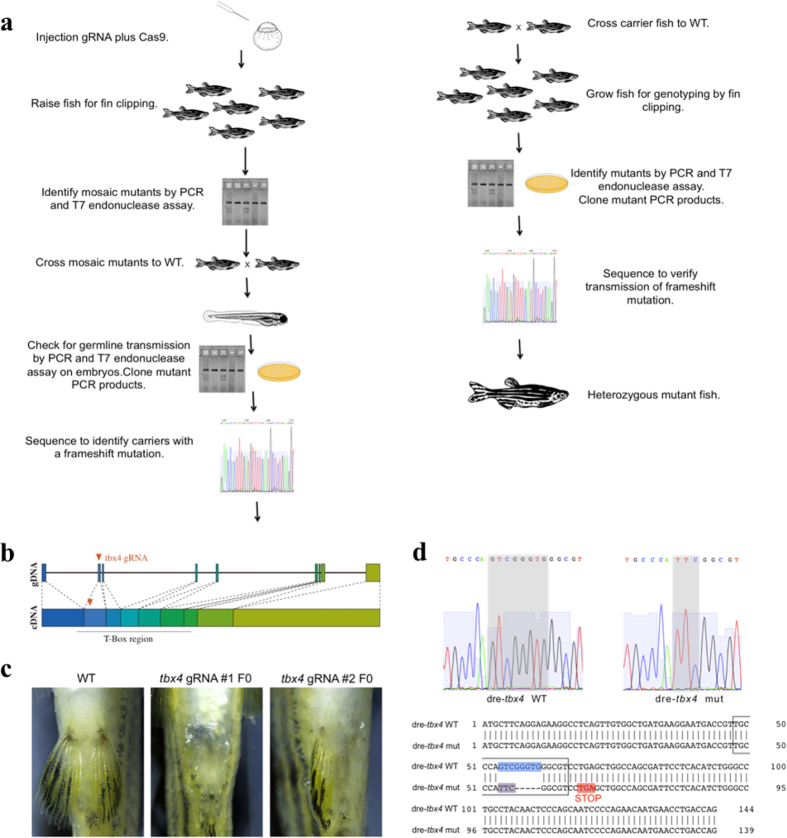
Seahorses have a specialized morphology that includes a toothless tubular mouth, a body covered with bony plates, a male brood pouch, and the absence of caudal and pelvic fins. Here we report the sequencing and de novo assembly of the genome of the tiger tail seahorse, Hippocampus comes. Comparative genomic analysis identifies higher protein and nucleotide evolutionary rates in H. comes compared with other teleost fish genomes. We identified an astacin metalloprotease gene family that has undergone expansion and is highly expressed in the male brood pouch. We also find that the H. comes genome lacks enamel matrix protein-coding proline/glutamine-rich secretory calcium-binding phosphoprotein genes, which might have led to the loss of mineralized teeth. tbx4, a regulator of hindlimb development, is also not found in H. comes genome. Knockout of tbx4 in zebrafish showed a 'pelvic fin-loss' phenotype similar to that of seahorses.


Conflict of interest statement

The authors declare no competing financial interests.

Figures

Figure 1
Figure 1. Adaptations and evolutionary rate of H. comes.
a, Schematic diagram of a pregnant male seahorse. b, The phylogenetic tree generated using protein sequences. The values on the branches are the distances (number of substitutions per site) between each of the teleost fishes and the spotted gar (outgroup). Spotted gar, Lepisosteus oculatus; zebrafish, Danio rerio. PowerPoint slide
Figure 2
Figure 2. OR genes in H. comes and other ray-finned fishes.
‘Air’ and ‘water’ refer to the detection of airborne and water-soluble odorants, respectively. The sizes of the orange circles represent the number of OR genes of a particular category. PowerPoint slide
Figure 3
Figure 3. Pelvic fin loss in H. comes is associated with loss of tbx4.
a, Vista plot of conserved elements in the tbx2b-tbx4-brip1 syntenic region in fugu (reference genome), seahorse (H. comes), stickleback and zebrafish showing that tbx4 is missing from this locus in seahorse. The blue and red peaks represent conserved exonic and non-coding sequences, respectively. b, Lateral (top) and ventral view (bottom) of wild-type (WT) and a representative (one out of five) F3 homozygous tbx4-null mutant (tbx4−/−) zebrafish. Bottom panel shows a close-up of the pelvic region (dashed lines indicate the approximate zoom region). Scale bar, 1 mm. Pelvic fins are indicated with black or white arrowheads in the wild-type fish. Homozygous tbx4-null mutants entirely lack pelvic fins without showing any other gross morphological defects. PowerPoint slide
Figure 4
Figure 4. Astacin metalloproteinase gene family in ray-finned fishes.
a, Astacin gene loci in various ray-finned fish genomes showing expansion of pastn genes in seahorse (H. comes) and c6ast genes in platyfish. Chr, chromosome. b, The phylogeny of the astacin gene family in ray-finned fishes. Only pastn or c6ast genes shown in a are labelled. Supplementary Fig. 10.1 shows an expanded version of the tree with all the genes labelled. c, Expression patterns of pastn genes in relation to 18S ribosomal RNA genes in the brood pouch of male H. erectus determined by qRT–PCR. All data are expressed as mean ± standard error of mean (n = 5) and evaluated by one-way analysis of variance (ANOVA) followed by Tukey’s honestly significant difference test for adjusting P values from multiple comparisons (see Methods and Supplementary Information for details of methods). The average duration of pregnancy (from fertilization to parturition) is 17 days. The y axis represents expression level in relation to 18S rRNA genes. pastn1 is expressed at low levels at the non-pregnant stage, which is not clearly visible in the figure due to the large scale used. Non-pregnant: no embryos in the brood pouch; early pregnant: 2–4 days post-fertilization; late pregnant: 12–14 days post-fertilization. *P < 0.05, **P < 0.01. Note that pastn4 is not expressed in these stages of brood pouch. PowerPoint slide
Extended Data Figure 1
Extended Data Figure 1. Phylogenetic relationships of ray-finned fishes discussed in this study.
Phylogenetic relationships of ray-finned fishes depicted here are based on the current study and ref. . Ray-finned fishes (Actinopterygii) are divided into basal ray-finned fishes (Polypteriformes, Acipenseriformes and Holostei) and teleosts. The latter comprise ~99% of the extant ray-finned fishes. The star represents the teleost-specific genome duplication (TGD) event that occurred in the common ancestor of all teleost fishes. Syngnathids (seahorse and pipefish) display the unique phenomenon of ‘male pregnancy’.
Extended Data Figure 2
Extended Data Figure 2. Number of gene families in various teleosts and the spotted gar.
a, Venn diagram of shared orthologous gene families in seahorse (H. comes), fugu, zebrafish and stickleback. b, The phylogeny and divergence times of seahorse and other teleost fishes based on analysis of genome-wide one-to-one orthologous protein sequences. The numbers at nodes indicate the number of gene families expanded and contracted at different evolutionary time points.
Extended Data Figure 3
Extended Data Figure 3. Divergence distribution of transposable elements compared to consensus in the transposable element library.
The divergence rate was calculated between the identified transposable elements (TEs) in the H. comes genome and the consensus sequence in the transposable element library.
Extended Data Figure 4
Extended Data Figure 4. SCPP genes in H. comes and other jawed vertebrates.
Gene loci for human, coelacanth and zebrafish were adapted from other publications,. sparcl1, which is the ancestral gene that gave rise to SCPP genes is shown in grey; P/Q-rich SCPP genes are shown in red; acidic SCPP genes are shown in blue. In seahorse, scpp5 is a pseudogene and is denoted by ψ. Owing to space constraints, the P/Q-rich SCPP genes encoding milk casein and salivary proteins in human have been omitted. Black circles mark the ends of scaffolds.
Extended Data Figure 5
Extended Data Figure 5. Maximum-likelihood phylogenetic tree of OR genes in H. comes and other ray-finned fishes.
Extended Data Figure 6
Extended Data Figure 6. CRISPR–Cas9 mediated knockdown of tbx4 in zebrafish.
a, CRISPR–Cas9 mutagenesis strategy. b, CRISPR–Cas9 sites targeted in zebrafish tbx4 gene. c, Loss of function tbx4 phenotypes in F0 mosaic mutants. Pelvic fin loss was observed with low frequency in F0 mosaic mutant fish. Frequency of animals with either single- or double-sided loss of pelvic fins was 3/42 for gRNA#1 and 1/34 for gRNA#2. d, Identification of zebrafish tbx4 mutant line. Top shows sequencing chromatograms of wild-type (left) and mutant (right) alleles. Bottom shows alignment of tbx4 exon 2 from wild-type and mutant. The region for which the chromatograms are shown is indicated with a box. In the mutant a deletion (indicated in blue in the wild-type sequence)/substitution (indicated in lilac in the mutant sequence) was identified. The deletion/substitution area is indicated with a grey box in the chromatograms.
Extended Data Figure 7
Extended Data Figure 7. Reporter gene expression pattern driven by zebrafish CNEs that are lost in H. comes.
Lateral and dorsal views of 72 h post-fertilization F1 transgenic zebrafish embryos. The lost CNEs (#6500, #6560, #hoxc-1 and #hoxd-1) were assayed for their reporter gene expression potential in transgenic zebrafish. FB, forebrain; FP, floor plate; H, heart; HB, hindbrain; L, lens; M, melanocytes; MB, midbrain; O, otic vesicle; SC, spinal cord.

Comment in

References

    1. Leysen H, et al. Musculoskeletal structure of the feeding system and implications of snout elongation in Hippocampus reidi and Dunckerocampus dactyliophorus. J. Fish Biol. 2011;78:1799–1823. - PubMed
    1. Stölting KN, Wilson AB. Male pregnancy in seahorses and pipefish: beyond the mammalian model. BioEssays. 2007;29:884–896. - PubMed
    1. Wilson AB, Vincent A, Ahnesjö I, Meyer A. Male pregnancy in seahorses and pipefishes (family Syngnathidae): rapid diversification of paternal brood pouch morphology inferred from a molecular phylogeny. J. Hered. 2001;92:159–166. - PubMed
    1. Teske PR, Cherry MI, Matthee CA. The evolutionary history of seahorses (Syngnathidae: Hippocampus): molecular data suggest a West Pacific origin and two invasions of the Atlantic Ocean. Mol. Phylogenet. Evol. 2004;30:273–286. - PubMed
    1. Near TJ, et al. Phylogeny and tempo of diversification in the superradiation of spiny-rayed fishes. Proc. Natl Acad. Sci. USA. 2013;110:12738–12743. - PMC - PubMed

Publication types

MeSH terms