Comment
. 2016 Dec 22;540(7634):588-592.
doi: 10.1038/nature20609. Epub 2016 Dec 14.

Mechanism of early dissemination and metastasis in Her2+ mammary cancer

Affiliations
Comment

Mechanism of early dissemination and metastasis in Her2+ mammary cancer

Kathryn L Harper et al. Nature. .

Erratum in

Abstract

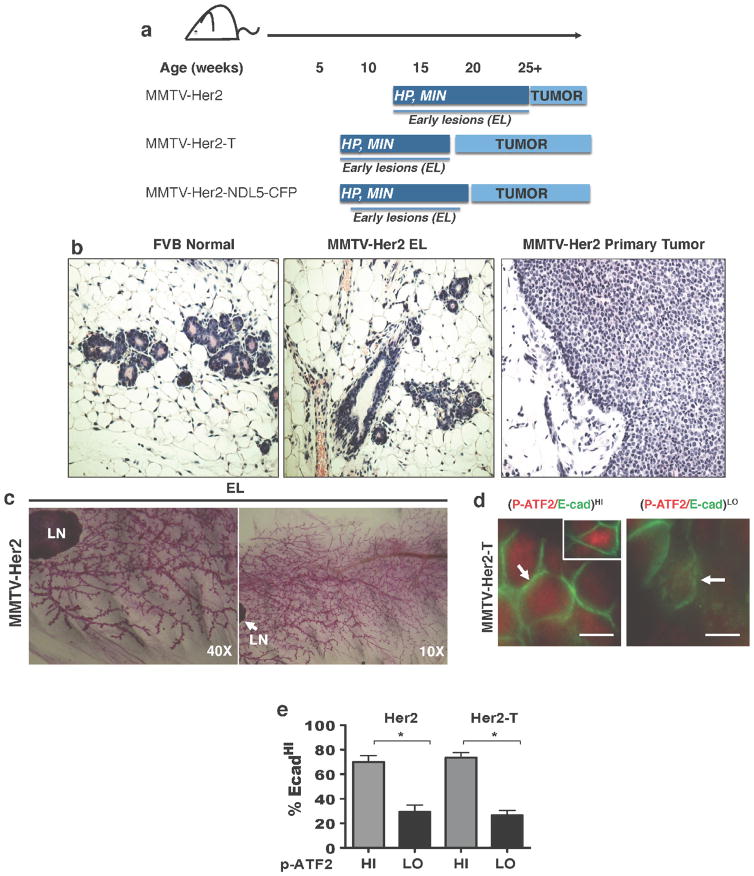
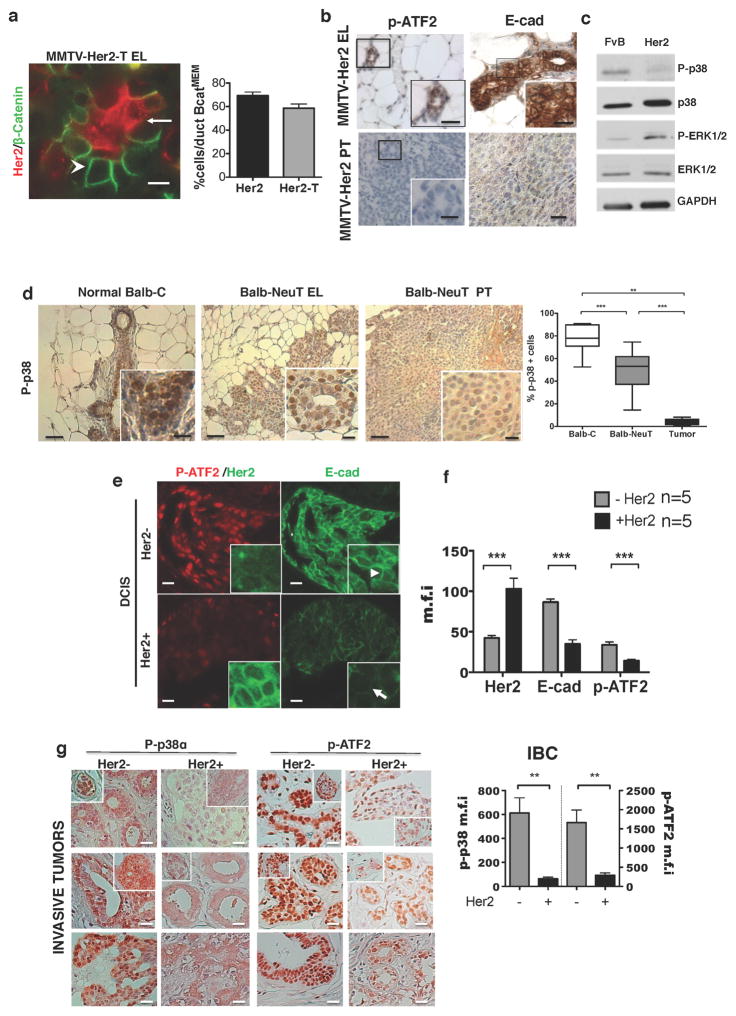
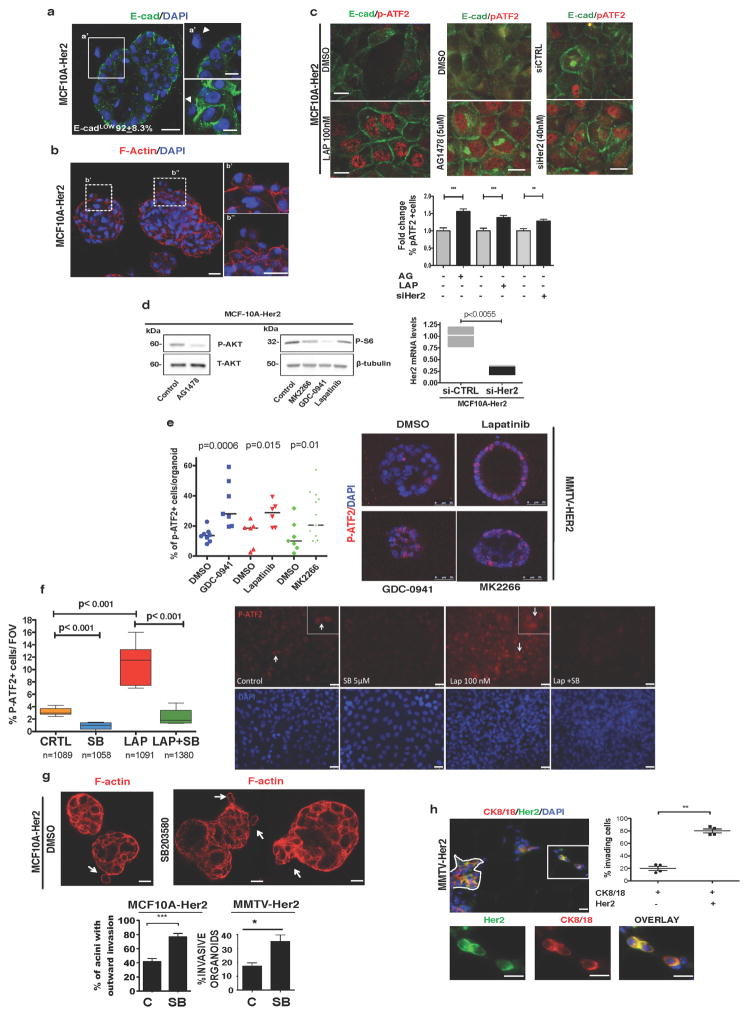
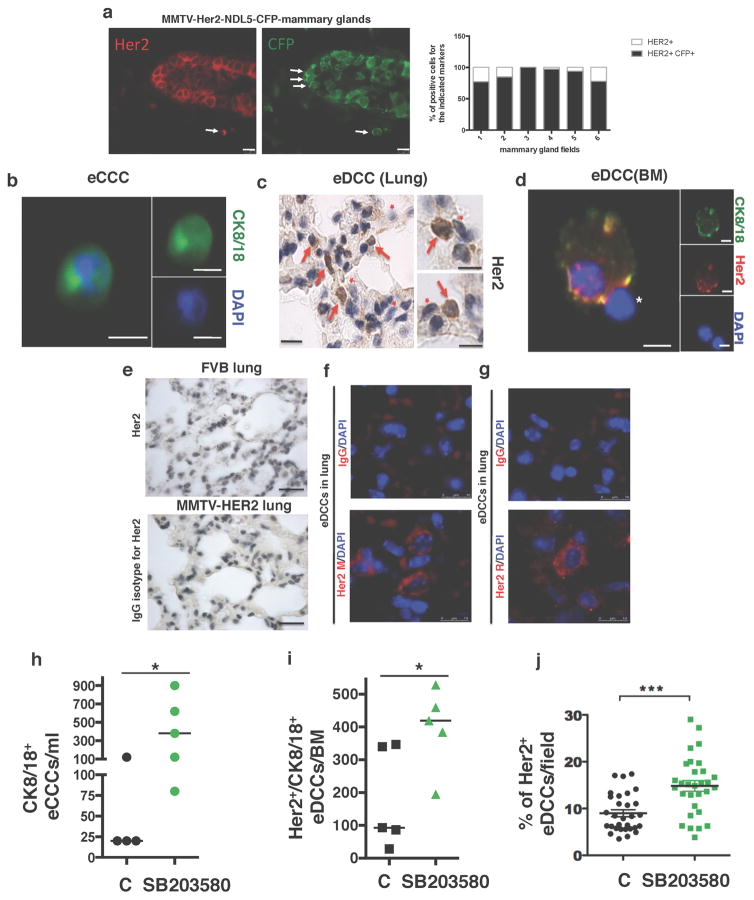
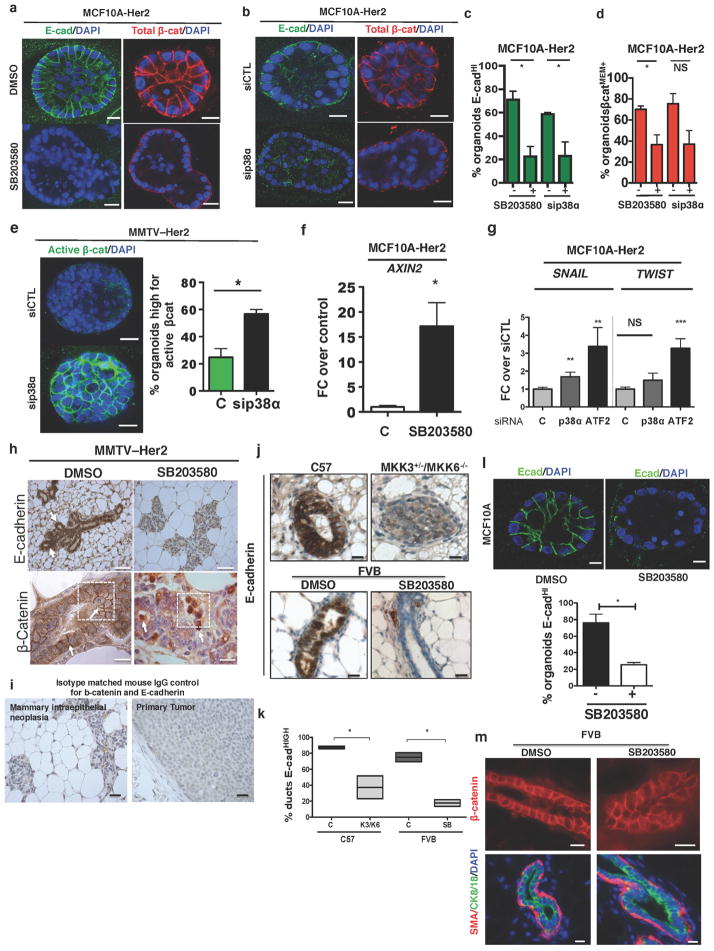
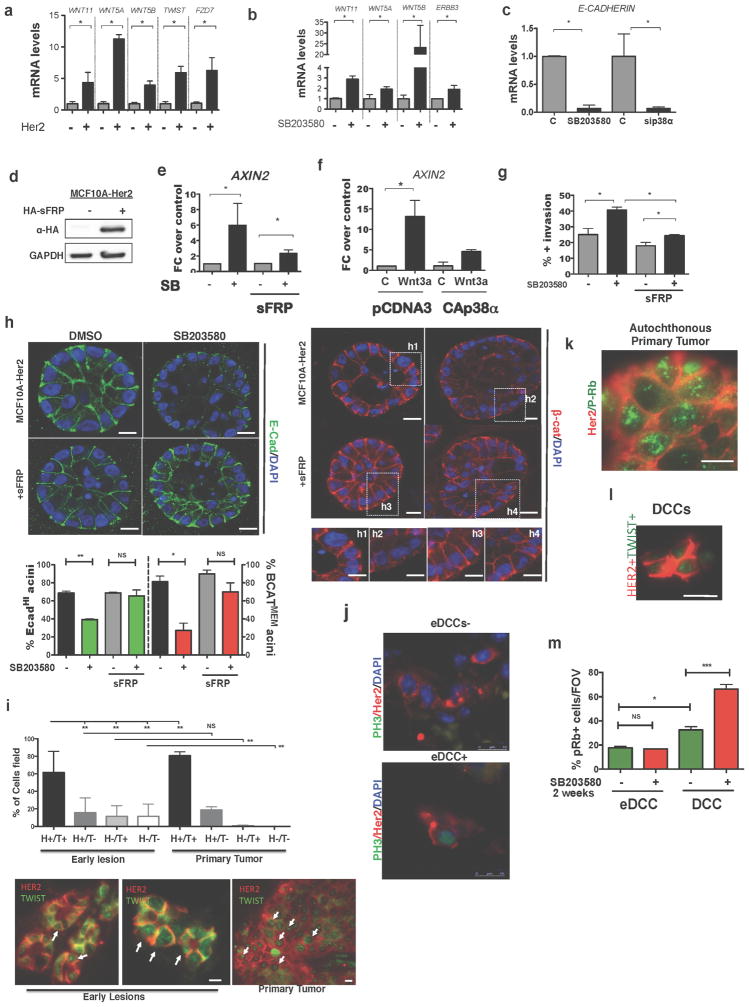
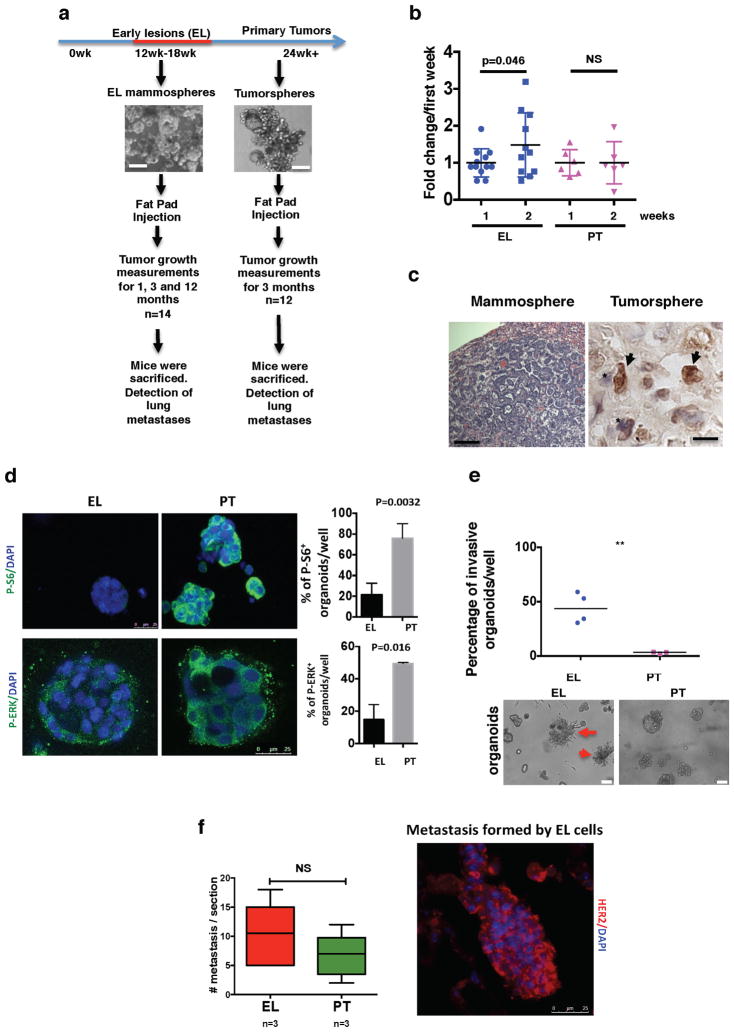
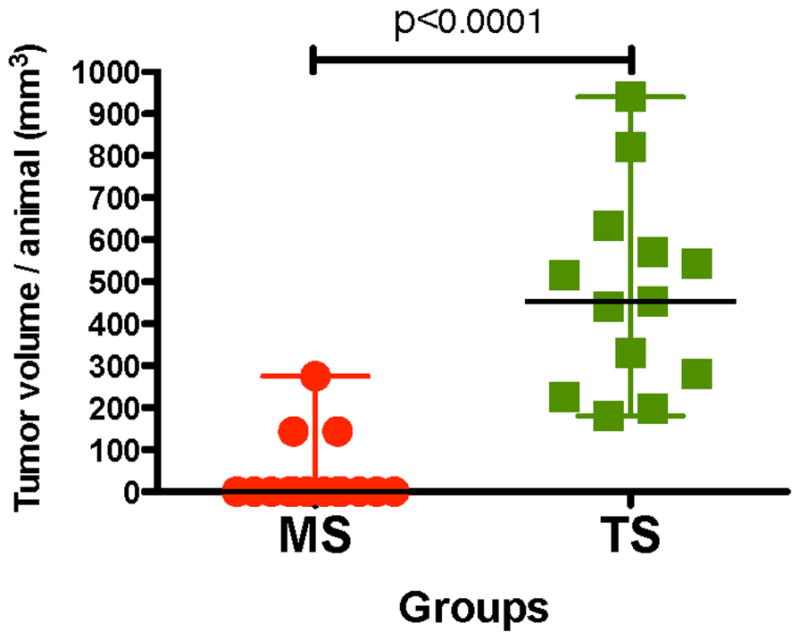
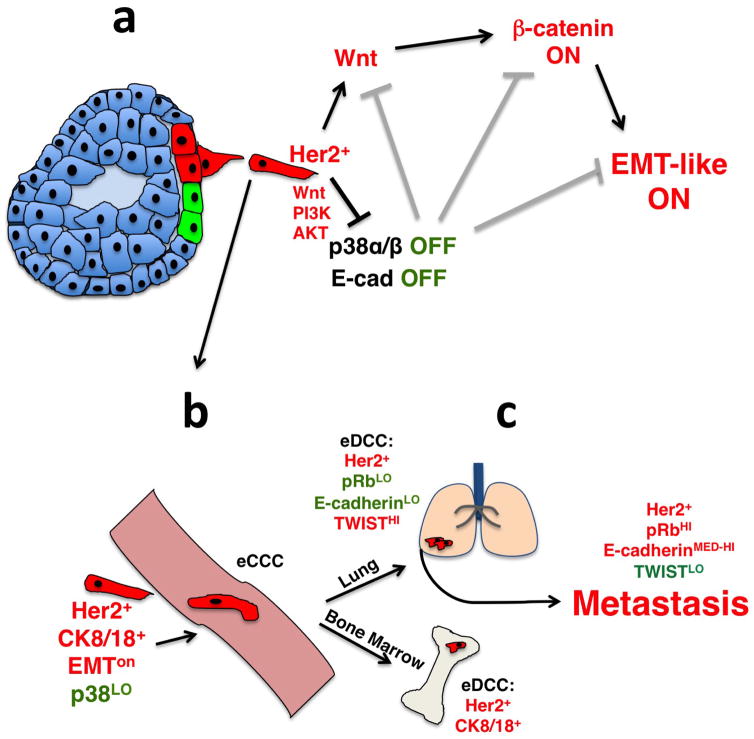
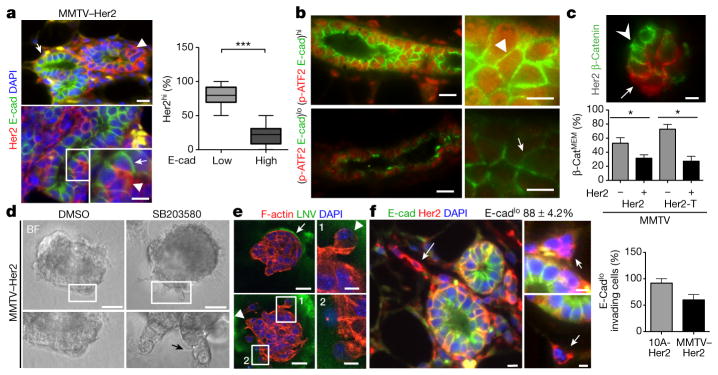
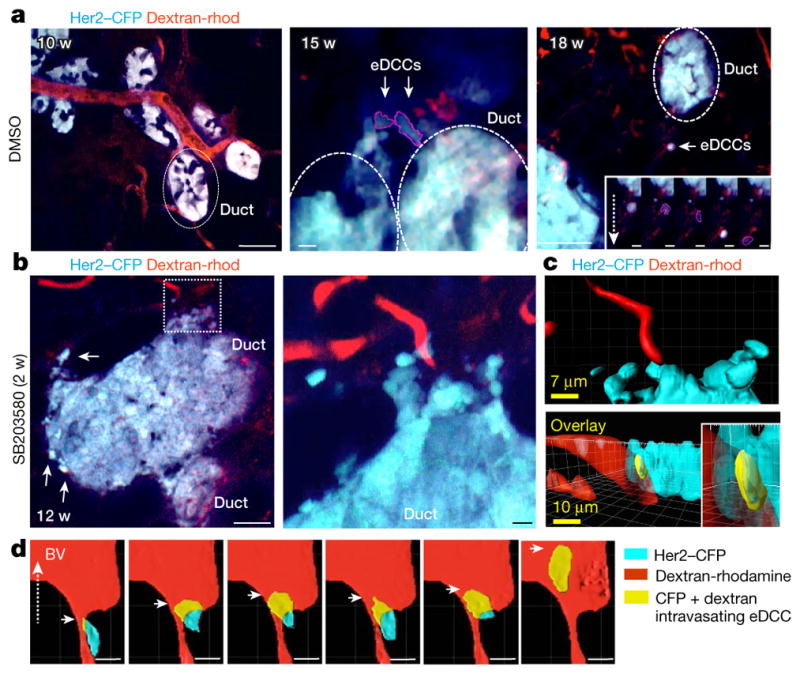
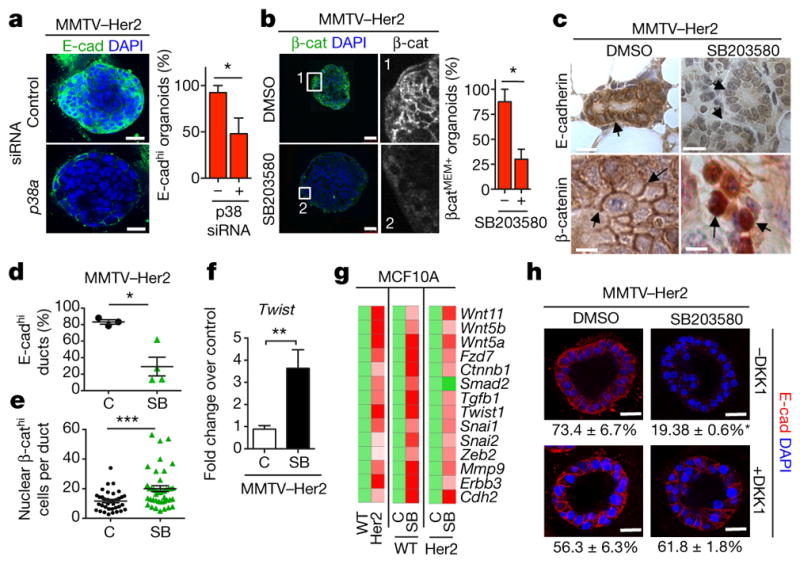
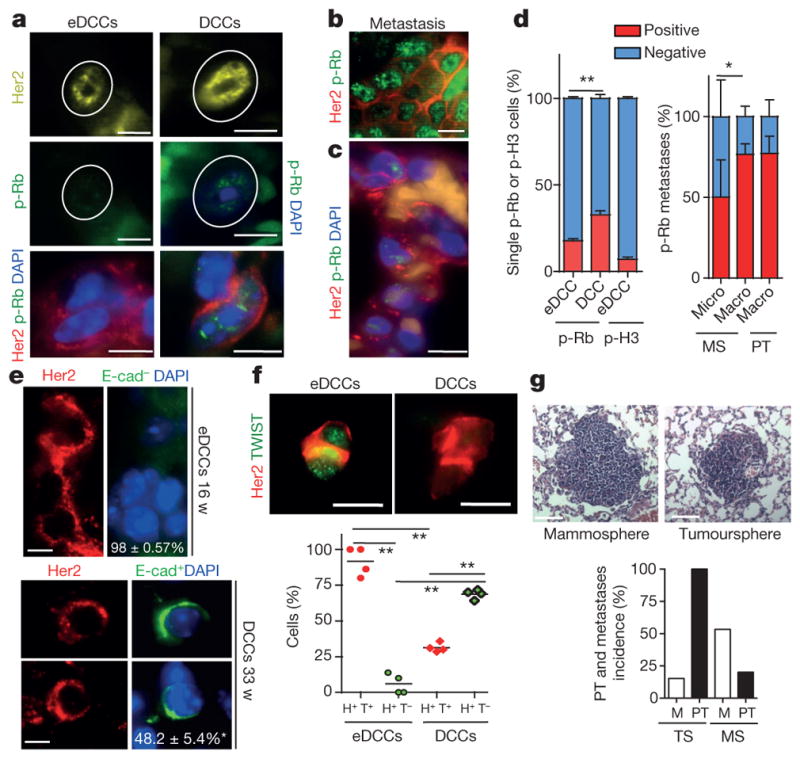
Metastasis is the leading cause of cancer-related deaths; metastatic lesions develop from disseminated cancer cells (DCCs) that can remain dormant. Metastasis-initiating cells are thought to originate from a subpopulation present in progressed, invasive tumours. However, DCCs detected in patients before the manifestation of breast-cancer metastasis contain fewer genetic abnormalities than primary tumours or than DCCs from patients with metastases. These findings, and those in pancreatic cancer and melanoma models, indicate that dissemination might occur during the early stages of tumour evolution. However, the mechanisms that might allow early disseminated cancer cells (eDCCs) to complete all steps of metastasis are unknown. Here we show that, in early lesions in mice and before any apparent primary tumour masses are detected, there is a sub-population of Her2+p-p38lop-Atf2loTwist1hiE-cadlo early cancer cells that is invasive and can spread to target organs. Intra-vital imaging and organoid studies of early lesions showed that Her2+ eDCC precursors invaded locally, intravasated and lodged in target organs. Her2+ eDCCs activated a Wnt-dependent epithelial-mesenchymal transition (EMT)-like dissemination program but without complete loss of the epithelial phenotype, which was reversed by Her2 or Wnt inhibition. Notably, although the majority of eDCCs were Twist1hiE-cadlo and dormant, they eventually initiated metastasis. Our work identifies a mechanism for early dissemination in which Her2 aberrantly activates a program similar to mammary ductal branching that generates eDCCs that are capable of forming metastasis after a dormancy phase.


Conflict of interest statement

The authors declare competing financial interests: details are available in the online version of the paper. Readers are welcome to comment on the online version of the paper.

Figures

Extended Data Figure 1
Extended Data Figure 1. Progression and staging of MMTV–Her2 mouse models
a, Cartoons depicting the three MMTV–Her2 models used in this study and the different time frames for early lesions (EL) and overt primary tumour (PT) development. HP, hyperplasia; MIN, mammary intraepithelial neoplasia. b, Haematoxylin and eosin staining for sections of normal FVB mouse mammary tissue, and FVB MMTV–Her2 early lesions or primary tumours. c, Whole mounts from mammary glands of FVB MMTV–Her2 mice at the time early lesions were studied. LN, lymph node. d, Representative images of E-cadhip-ATF2hi (left and inset) and E-cadlop-ATF2lo (right) ducts in the MMTV–Her2-T model. Scale bar, 10 μm. Arrow in left image, intact E-cadherin junction; arrow in right image, dismantled E-cadherin junction. e, Quantification of the percentage of E-cadhi cells per duct that showed high or low p-ATF2 expression in MMTV–Her2 and MMTV–Her2-T models. *P <0.01; one-sided, unpaired t-test; mean ±s.e.m. (Her2, n = 30 ducts; Her2-T, n =10 ducts).
Extended Data Figure 2
Extended Data Figure 2. p38 signalling in MMTV–Her2 models and DCIS patient samples
a, Early stage MMTV–Her2-T (BALB-NeuT 15 weeks of age ) early lesion sections stained for Her2 and β-catenin. Arrows, Her2+β-catMEM-lo early lesion cells; arrowheads, Her2β-catMEM-hi cells. Scale bars, 10 μm. The digital dye separation module (Leica) was used on the images. Graph, quantification of the percentage of cells per duct with β-catMEM for both MMTV–Her2 and MMTV–Her2-T models. (n =7 ducts). b, Immunohistochemistry for p-ATF2 and E-cadherin in MMTV–Her2 early lesion tissues (age, 14–18 weeks) and primary tumour sections. Boxed regions are magnified in the bottom right panel. Note the loss of both p-ATF2 and E-cadherin in primary tumour samples. Scale bar, 25 μm. c, Western blot for the indicated antigens in lysates of mammary epithelial cells isolated from normal mammary glands (FVB) and tumour cells isolated from MMTV–Her2 overt primary tumours (Her2). GAPDH was used as a loading control. For gel source data, see Supplementary Fig. 1. d, Immunohistochemistry for p-p38 in normal epithelium (BALB/c), early lesion tissues (BALB-NeuT early lesions, 7 weeks) and overt primary tumours (BALB-NeuT primary tumours). Graph, percentage of p-p38 positive cells in each stage. n = 11–15 ducts, 5 tumours. Scale bars, 20 μm (inset) and 50 μm; **P <0.01; ***P < 0.0001; one-tailed Mann–Whitney U-test. e, Representative images of parallel sections from DCIS patient samples stained for p-ATF2 (red), Her2 (green in insets lower row), or E-cadherin (green in large panels and insets upper row). Samples were Her2-positive (n = 5) or -negative (n = 5) by immunofluorescence microscopy analysis for Her2 (insets top and bottom row left, green). Inset right column, detail of E-cadherin junctions in Her2+ and Her2 samples. Arrowhead, strong E-cadherin junctions; arrow, weak E-cadherin staining. Scale bars, 25 μm and 10 μm (inset). f, Metamorph software was used to quantify Her2, E-cadherin and p-ATF2 fluorescence signal intensity in 10 DCIS samples shown in panel e. Mean fluorescence intensity (m.f.i.) ± s.e.m. per cell per field from Her2+ (black bars, n = 5) compared to Her2 (grey bars, n = 5) samples from patients with DCIS. ***P < 0.05; two-way ANOVA. g, Immunohistochemistry for p-p38α and p-ATF2 performed on invasive breast cancer (IBC) tumours from patients (n = 20). Samples were classified as Her2+ (n = 10) or Her2 (n = 10) by the pathology service. Note the significant reduction in both p-p38α and p-ATF2 in Her2+ tumours. Insets show additional patient samples for each group. Graph, metamorph was used to determine the mean signal intensity ±s.e.m. per field for p-p38 and p-ATF2. p-p38 intensity, left axis and first two columns of the graph. p-ATF2 intensity, right axis and last two columns of the graph. **P <0.05; unpaired t-test. Scale bars, 25 μm.
Extended Data Figure 3
Extended Data Figure 3. Characterization of invasive and signalling properties of Her2+ early lesions
a, MCF10A-HER2 organoids stained for E-cadherin (green) and DAPI (blue). Left, a representative organoid. Scale bar, 25 μm. Right, details of invading E-cadlo cells (top and bottom). Arrowheads, outward invading E-cadlo cells. Scale bar, 10 μm. Approximately 35–40% of MCF10A-HER2 organoids show outward invasion of one cell per organoid in equatorial sections; 92 ± 8.3% of those invading cells are E-cadlo. b, MCF10A-HER2 organoids were stained for F-actin (red) and DAPI (blue). Note the extensions of F-actin from invading cells (boxed areas and right top and bottom insets) still in contact with the organoid. Scale bars, 20 μm. c, Detection of E-cadherin and p-ATF2 in MCF10A-HER2 cells treated with or without lapatinib (100 nM), AG1478 (5 μM) and siRNA targeting HER2 (40 nM) for 24 h; E-cadherin (green), pATF2 (red). Graph, fold change of the percentage of p-ATF2+ cells. Data are mean ±s.e.m.; **P <0.01; ***P < 0.001; one-sided, unpaired t-test; n =3 experimental replicates, 10 images per treatment. d, MCF10A-Her2 cells were treated for 24 h with AG1478 (1 μM) left, or with the AKT inhibitor MK2266 (5 μM), pan-PI3K inhibitor GDC-0941 (1 μM) or lapatinib (1 μM), right. Western blots for p-AKT and total AKT (T-AKT) (left) or p-S6 and β-tubulin (right). Gel source data in Supplementary Fig. 1. Graph, control for Her2 knockdown in MCF10A-HER2 cells; one-sided, unpaired t-test; median and range are shown. e, MMTV–Her2 early lesion organoids were treated with GDC-0941 (1 μM), lapatinib (1 μM) or MK2266 (5 μM) for 24 h. Organoids were fixed and stained for p-ATF2. Graph, percentage of p-ATF2+ cells per organoid. Scale bars, 25 μm. Median ± s.e.m.; one-sided, unpaired t-test. f, Left, quantification of the percentage of nuclear p-ATF2+ MCF10A-HER2 cells treated for 24 h with vehicle (CRTL), 5 μM SB203580 (SB), 100 nM lapatinib (LAP) or the combination of the two drugs. Right, representative immunofluorescence images of the p-ATF2 signal (red); DAPI (blue) was used to count total cell numbers. Insets and arrows show a detail of nuclear p-ATF2 levels in the respective groups. One-sided Mann–Whitney U-test at 95% confidence; median and range are shown, n = 2 independent wells per condition; n > 150 cells scored per condition. Scale bars, 25 μm. g, MCF10A-HER2 organoids treated for 6 days with SB203580 or DMSO and stained for F-actin (red). Bottom left graph, percentage ± s.e.m. of MCF10A-HER2 organoids with outward invasion (DMSO n =109; SB203580 n =87) ***P < 0.001; one-sided, unpaired t-test. Scale bars, 10 μm. Bottom right graph, percentage of invasive MMTV–Her2 organoids (DMSO n =11; SB203580 n =9). P = 0.01; one-sided, unpaired t-test; mean ±s.d. Representative of 3 biological replicates. h, MMTV–Her2 early lesion sections (age, 14–18 weeks) stained for CK8/18 (red), Her2 (green) and nuclei (DAPI, blue). Top image, a duct is outlined. The boxed region and bottom images showCK8/18+ and Her2+ singlets or doublets within the stroma near ducts. Graph, percentage of stroma-invading cells that were either double positive for both CK8/18 and Her2 or single CK8/18+. Mean ±s.e.m.; **P < 0.01; one-sided Mann–Whitney U-test; n =4 mice, 60–80 cells per mouse. Scale bars, 10 μm.
Extended Data Figure 4
Extended Data Figure 4. Quantification of early dissemination by Her2+ early cancer cells
a, MMTV–Her2–NDL5–CFP early lesion mammary gland tissues (seven-week-old females) co-stained for CFP (green) and Her2 (red). Arrows, co-distribution of Her2 and CFP. Graph, percentage of positive cells for the single Her2 staining (white bars) or double co-staining for Her2 and CFP (black bars) per field. Approximately 88% of early lesion cells are positive for Her2 and CFP. Scale bars, 10 μm. b, Early circulating cancer cells (eCCCs) were detected in cytospin preparations by staining for CK8/18 (green) and nuclei with DAPI (blue) after a Ficoll gradient and negative selection (see Methods). Scale bar, 10 μm. c, Detection of eDCCs in lung sections from MMTV–Her2 mice by immunohistochemistry for Her2 (rabbit anti-Her2 antibody (Abcam, ab2428)). Scale bar, 25 μm. Right, augmented images from additional sections. Red arrowheads, Her2-positive DTCs; red asterix, host Her2-negative cells. Scale bars, 10 μm. Staining controls are shown in e. d, eDCCs in the bone marrow of MMTV–Her2 mice detected in cytospin preparations of whole bone-marrow samples after a Ficoll gradient and staining for CK8/18 (green), Her2 (red) and DAPI (blue). CK8/18+, Her2+ or double-positive cells were considered eDCCs. Right, individual channel signals. Left, merged channels on the right detecting a bone-marrow CK8/18+Her2+ DCC (arrow) next to a CK8/18Her2 bone-marrow cell (asterix). Scale bars, 10 μm. e, Top, Immunohistochemistry for Her2 in non-transgenic FVB lung sections. Her2+ cells were undetectable in FVB lung sections. Bottom, IgG isotype for the Her2 antibody used in c in lungs of MMTV–Her2 mice. Scale bars, 50 μm. f, g, Top, IgG control images for eDCC detection in MMTV–Her2 lung sections. Bottom, example of Her2+ (red) staining using the Calbiochem (OP15L) (f) and Abcam (ab2428) (g) anti-Her2 antibodies. M, mouse; R, rabbit. Scale bars, 10 μm. h, eCCCs detected by CK8/18+ as in b in blood of MMTV–Her2 mice (age, 14–18 w) treated for 2 weeks with DMSO (C) or the p38α/β inhibitor SB203580 (DMSO n =4; SB n =5 mice). i, eDCCs detected by CK8/18+ as in d in bone marrow of MMTV–Her2 mice treated as in h (n = 5 mice per group). j, eDCCs detected in the lung of MMTV–Her2 mice carrying only early lesions as in c and treated as in h. Graph, percentage of Her2+ eDCCs per field in each group (n = 30 fields, 3 mice per treatment). For hj, median and individual fields (j) or mice (h, i); *P <0.05; ***P <0.001; one-sided Mann–Whitney U-test.
Extended Data Figure 5
Extended Data Figure 5. EMT markers in Her2+ early lesion cells
a, MCF10A-HER2 organoids treated for 6 days with SB203580 or control (DMSO) were stained for E-cadherin (green) and β-catenin (red) or DAPI (blue); MCF10A-HER2, n = 20 organoids per treatment. Scale bars, 10 μm (top), 20 μm (bottom). b, MCF10A-HER2 organoids treated with siRNAs targeting p38a or a non-targeting control (siCTL); n = 20 organoids per treatment. Scale bars, 10 μm (top), 20 μm (bottom). c, Quantification of a and b. *P < 0.048; NS, not significant; one-sided, unpaired t-test. d, Graph, percentage ±s.e.m. β-cateninMEM in MCF10A-HER2 with/without SB203580 and with/without p38a siRNA. *P =0.0047; one-sided, unpaired t-test. e, MMTV–Her2 organoids treated with p38a or control siRNA (48 h) and stained to detect active β-catenin (see Methods). Graph, percentage ± s.e.m. of organoids stained for active β-catenin (n = 10 organoids per treatment). Scale bars, 25 μm. P =0.0059; one-sided, unpaired t-test. f, AXIN2 mRNA expression in MCF10A-HER2 cultures treated for 24 h with DMSO control (C) or SB203580 (5 μM). Technical triplicate determinations were normalized to GAPDH and fold change (FC) over control was determined for five biological replicates. P <0.05; one-sided, unpaired t-test, mean ±s.e.m. g, mRNA levels for SNAI1 and TWIST1 normalized to GAPDH in MCF10A-HER2 3D cultures treated with siRNA targeting the p38α isoform or ATF2 from day 6–12. Graph, fold change over control in three biological replicates. **P <0.01; ***P < 0.0001; one-sided, unpaired t-test; mean ±s.e.m. h, Sections of MMTV–Her2 early lesions in mice treated for 2 weeks with SB203580 (see Methods) stained for E-cadherin (top) and β-catenin (bottom). Scale bars, 15 μm. Arrows, membrane E-cadherin, or β-catenin (bottom left) or nuclear β-catenin (bottom right). Boxed area is shown in Fig. 3c. i, Isotype-matched mouse IgG control immunohistochemistry for β-catenin and E-cadherin in mammary intraepithelial neoplasia and a primary tumour. Scale bars, 25 μm. j, E-cadherin immunohistochemistry in C57BL/6 (WT) and Mkk3−/− Mkk6+/− mice or FVB mice treated with SB203580 (see Methods). k, Quantification of j. Mean ±s.e.m.; *P < 0.01; one-sided, unpaired t-test. l, MCF10A organoids were treated for 6 days with control (DMSO) or SB203580 (5 μM), and fixed and stained for E-cadherin (green). Graph, percentage of E-cadhi organoids in two experiments; 15 organoids per treatment per trial. Scale bars, 10 μm. Mean ±s.e.m.; *P < 0.01; one-sided, unpaired t-test. m, Top, immunofluorescence for β-catenin (red) on mammary gland sections of DMSO- or SB203580-treated FVB mice(see Methods). Scale bars, 25 μm. Bottom, immunofluorescence for α-smooth muscle actin (SMA, red), CK8/18 (green) and DAPI (blue) on the same tissues. Scale bars, 20 μm.
Extended Data Figure 6
Extended Data Figure 6. Wnt signalling in Her2+ organoids and eDCC characterization
a, qPCR confirmation of EMT genes identified in Fig. 3g comparing MCF10A and MCF10A-HER2 organoids. Mean ±s.e.m. shown as fold change over control. Values normalized to GAPDH from triplicate samples. *P < 0.05; one-sided, unpaired t-test. b, qPCR confirmation of genes identified in Fig. 3g in MCF10A-HER2 organoids treated with DMSO or SB203580. Mean ± s.e.m. shown as fold change over control. Values normalized to GAPDH from triplicate samples. *P <0.05; one-sided, unpaired t-test. c, qPCR for CDH1 mRNA in MCF10A-HER2 organoids treated for 6 days with SB203580 (5 μM) or p38a siRNA (20 nM). Fold change over control for biological triplicates. DMSO, control for SB203580 and scrambled siRNA, control for p38a siRNA. Mean ±s.e.m.; *P < 0.05; one-sided, unpaired t-test. d, Western blot for haemagglutinin (HA)-tagged SFRP1 constructs in MCF10A-HER2-SFRP1 cell lines. Gel source data, see Supplementary Fig. 1. e, Axin2 mRNA levels in MCF10A-HER2 and MCF10A-HER2-SFRP1 cells treated with or without SB203580 (5 μM) for 24 h. Fold change over control; error bars denote s.e.m. for biological sextuplicates. *P <0.05; one-sided, unpaired t-test. f, Axin2 mRNA levels measured in MCF10A cultures transfected with pcDNA3 (empty vector) or CA-p38α (D176A and F372S mutant) plasmids and then treated with or without WNT3A for 24 h. Fold change over control is shown; error bars denote s.e.m. for biological triplicates. *P < 0.02; one-sided, unpaired t-test. g, Percentage of outward-invading cells from MCF10A-HER2 and MCF10A-HER2-SFRP1 organoids treated for 6 days with DMSO or SB203580 (5 μM). n =20 organoids per treatment, biological duplicates; data are shown as mean ±s.e.m.; *P < 0.05; one-sided, unpaired t-test. h, Left, E-cadherin (green) in MCF10A-HER2 and MCF10A-HER2-SFRP1 organoids treated for 6 days with SB203580 (5 μM). Right, β-catenin (red) in organoids treated as on the left. Insets (h1–h4) show magnified boxed regions. Graph, percentage of E-cadhi (green bars, left axis) and β-cateninMEM (red bars, right axis) organoids. Error bars denote s.e.m.; NS, not significant; *P <0.003; **P < 0.02; one-sided, unpaired t-test; n =20 organoids per treatment, biological duplicates. Scale bars, 10 μm. i, Quantification of early-lesion or primary-tumour cancer cells with the indicated profiles; 4 animals per group. **P < 0.01; one-sided Mann–Whitney U-test; mean ± s.e.m. Bottom, immunofluorescence for Twist1hi (T+) protein in HER2+ (H+) cancer cells in early lesions (n =883 cells) or primary tumours (n ≥3,000 cells). j, Immunofluorescence for p-H3 (green) and Her2 (red) in eDCCs from MMTV–Her2 lung sections. Scale bars, 10 μm. k, Immunofluorescence for Her2 (red) and p-Rb (green) in spontaneous primary MMTV–Her2 tumours. Scale bar, 10 μm. l, Representative image of Her2+Twist1+ lung DCCs from 33-week-old MMTV–Neu mice. n = 500 cells, 4 animals per group. Quantification shown in Fig. 4f. Scale bar, 10 μm. m, Percentage of Her2+ and p-Rb+ cells per field of view (FOV) in MMTV–Her2 mice treated as in Fig. 3c. Lungs sections from 3 animals. *P <0.02; ***P < 0.0001; one-sided, unpaired t-test; error bars represent ±s.e.m.
Extended Data Figure 7
Extended Data Figure 7. Metastasis-initiating potential of HER2+ early lesion cells
a, Experimental approach for testing tumorigenic and metastatic potential. Early lesions cells from mouse mammary glands (age, 12–18 weeks) and primary tumour cells were seeded in mammosphere medium (see representative images). Approximately 300 mammospheres were injected into the fat pad of nude mice. Primary tumour formation and metastasis was monitored for 1, 3 and 12 months (mammospheres group) or for 3 months (tumourspheres group). Primary tumour and metastasis incidence are shown in Fig. 4g. b, Sphere-forming efficiency for early lesion cancer cells (age, 16 weeks) and primary tumour cancer cells. After one week (1) in culture, spheres were disaggregated and replated to test self-renewal capacity for another week (2). n =6 replicates; one-sided, unpaired t-test; data are mean ±s.d. Representative of 3 biological replicates. c, Left, haematoxylin and eosin staining of lung macro-metastasis in nude mice injected with MMTV–Her2 early lesion mammospheres. Scale bar, 200 μm. Right, immunohistochemistry for Her2+ DCCs in mice injected with tumourspheres. Scale bar, 10 μm. Arrows, Her2+ DCCs; asterisks, Her2 cells. d, Left, immunofluorescence detection of p-ERK1/2 and p-S6 in organoids produced by MMTV–Her2 early lesion or primary tumour cells. Right, percentage of p-S6 or p-ERK+ organoids per well. n = triplicates; one-sided, unpaired t-test; mean ±s.e.m. e, Mammosphere from early lesion cells or tumourspheres from primary tumour cells were directly embedded in 3D Matrigel to monitor organoid behaviour for 3 days. Top, percentage of invasive organoids in each group. EL, early lesion; PT, primary tumour. Bottom, representative images used to quantify the invasive nature of early lesion mammospheres (left) compared to primary tumour tumourspheres (right). P < 0.0021; one-sided, unpaired t-test; mean ±s.e.m. f, Early lesion and primary tumour single-cell suspensions were injected intravenously (tail vein) in nude mice (50,000 cells per animal). Lungs were collected (after 4 weeks) and processed for haematoxylin and eosin, and immunofluorescence for Her2 detection (right). Graph, number of metastatic nodules per section per animal lung (n = 3 mice in each group). NS, not significant; Mann–Whitney U-test; median and range are shown.
Extended Data Figure 8
Extended Data Figure 8. Final tumour volume of early lesions or primary spheres after orthotopic injection into nude mouse mammary fat pads
Animals were randomized and approximately 300 spheres from early lesions or primary tumours were injected per site into nude mice (BALB/cnu/nu, Charles River) with Matrigel (Corning 356231) at a 1:1 ratio. Spheres were injected into the both fourth inguinal gland fat pads using a 27-gauge needle. In the case of mice injected with tumour-derived spheres, mice were euthanized when tumours reached 1,000 mm3, according to IAUCU regulations. Tumour volumes were measured at 3 months. Mammospheres, n = 15 animals, tumourspheres, n = 13 animals. One-sided Mann–Whitney U-test with 95% confidence intervals.
Extended Data Figure 9
Extended Data Figure 9. Cartoon depicting the mechanism of early dissemination by Her2+ early lesion cells
a, Early Her2+ early lesion cancer cells (red) turn on Wnt, PI3K and AKT signalling, inhibit p38 activation and E-cadherin-junction formation allowing for a Twist1hi EMT-like invasive program; p38 and E-cadherin inhibit the Wnt- and β-catenin-driven EMT-like program and invasion (grey inhibitory symbols). b, Her2+p-p38loTwist1hiE-cadlo early lesion cancer cells, which retain CK8/18 expression can intravasate and disseminate. c, In lungs more than 85% of eDCCs (red) were Her2+E-cadlo(p-Rb or p-H3)lo, suggesting a large population of dormant cells. Most eDCCs are also Twist1hiE-cadlo. Nevertheless, eDCCs can initiate metastasis, which correlated with the acquisition of a Twist1loE-cadmed–hi phenotype. In the bone marrow, eDCCs were Her2+CK8/18+ and remain dormant for the duration of the experiments, as bone lesions were never observed.
Figure 1
Figure 1. E-cadherin, Her2 and p-ATF2 levels and function in early lesion cells
a, Top, MMTV–Her2 early lesion tissue sections co-stained for the indicated antigens. Bottom, intra-ductal heterogeneity of Her2hiE-cadlo cells. Inset, magnified view of the boxed region. Arrowheads, Her2hiE-cadlo cells; arrows, Her2loE-cadhi cells. Right, percentage of Her2hi cells that were E-cadlow or E-cadhigh (n =20 ducts; n =2 mice). ***P <0.0001. b, Representative images of E-cadhip-ATF2hi (top) and E-cadlop-ATF2lo (bottom) ducts in MMTV–Her2 early lesion tissues. Arrowhead, p-ATF2hiE-cadhi cell, arrow, p-ATF2loE-cadlo cell. Scale bars, 25 μm and 10 μm (inset) (a and b). c, MMTV–Her2 early lesion tissue sections stained for Her2 and β-catenin. Arrow, Her2+ cells with low membrane-associated β-catenin (β-catMEM-lo); arrowhead, Her2β-catMEM-hi cells. Scale bar, 10 μm. Graph, percentage of early lesion cells with β-catMEM that were Her2 or Her2+ (Her2, *P =0.035 and Her2-T, *P =0.0008). MMTV–Her2 n = 30 ducts per mouse, n =3 mice; MMTV–Her2-T n = 10 ducts per mouse, n =2 mice. d, MMTV–Her2 early lesion organoids treated for 48 h with DMSO or 5 μM SB203580. BF, bright field. Bottom imagees indicate magnified, boxed regions. Scale bars, 15 μm (left), 40 μm (right). e, MMTV–Her2 organoids stained for the indicated antigens. Arrowheads, invasive cells; arrow, intact laminin-V layer. Scale bars, 25 μm (e), 10 μm (insets 1 and 2). f, MMTV–Her2 early lesion sections co-stained for the indicated antigens. Arrows, Her2+E-cadlo invading cells. Top numbers, percentage of Her2+ E-cadlo invading cells in early lesion sections, n = 58 cells per section, n = 2 mice. Graph, percentage E-cadlo invading cells in MCF10A-HER2 (10A-Her2; see also Extended Data Fig. 3a) or MMTV–Her2 organoids. n = 20 MCF10A-HER2 organoids. a, c, one-sided Mann–Whitney U-test. Data are median ±s.e.m.
Figure 2
Figure 2. Intra-vital imaging of eDCC precursor intravasation
a, Her2–CFP (blue) ducts from 10- (left, Supplementary Video 2), 15- (middle, Supplementary Video 3) and 18- (right, Supplementary Video 4) week-old early lesions; scale bars, 38, 5 and 56 μm, respectively. Red, rhodamine-dextran-labelled vasculature. Dotted ellipses, ducts. Right inset: direction of movement of an eDCC at 5 time points (2 min per panel). Dotted arrow, direction of movement; scale bars in insets, 7.8 μm. b, Her2–CFP early lesion ducts from Supplementary Video 5 and Supplementary Video 6 (inset) treated with SB203580 for 2 weeks. Middle image, Higher resolution intra-vital video of the area boxed in the left image. Scale bar, 25.5 μm and 5.2 μm (boxed area). c, Top, 3D computer reconstruction of the video in b (boxed area). Bottom, rotated projection showing invasion (yellow) of early lesion cells (CFP, cyan) into blood vessels (red) (Supplementary Video 7). Scale bars, 7 μm (top) and 10 μm (bottom). d, Sequence following an early lesion cell (Supplementary Video 8) as it intravasates in mice treated with SB203580 for 4 weeks (yellow cell inside the red blood vessel (BV); 2.2 min per panel).
Figure 3
Figure 3. An EMT-like program in Her2+ early lesion cells
a, E-cadherin staining in early lesion MMTV–Her2 organoids transfected with control or p38a-targeting siRNA. Scale bars, 25 μm. Graph, percentage E-cadhi organoids; n = 30 organoids per treatment; *P =0.038. b, Early lesion MMTV–Her2 organoids treated for 48 h with SB203580 and stained for total β-catenin and the nuclei were counterstained with DAPI. Grey-scale panels (1, 2) denote zoomed images of boxed areas showing membrane- and cytosolic-localized β-catenin. Scale bars, 50 μm. Graph, percentage β-catMEM+ organoids; n = 10 organoids per treatment; *P =0.034. c, Early lesion tissue sections from MMTV–Her2 mice treated for 2 weeks with SB203580 stained for E-cadherin and β-catenin. Scale bars, 20 μm (top) and 10 μm (bottom). Arrows, E-cadherin (top left) and lack of signal (top right), membrane-bound β-catenin (bottom, left, arrows) or nuclear β-catenin (bottom, right, arrows). d, e, Quantification of images in c. C, control. SB, SB203580. d, Percentage of E-cadhi ducts. n =3 animals; *P =0.028. e, Percentage of nuclear β-cathi cells per duct. n = 36 ducts per 3 animals; ***P =0.0002. f, Twist1 mRNA levels in MMTV–Her2 early lesion tissues obtained from mice treated as in c. Values, fold change over control (DMSO) normalized to Gapdh. n = 3 mice per treatment; **P =0.0042. g, Heat map of EMT-related genes upregulated >2-fold (biological triplicate) in MCF10A and MCF10A-HER2 organoids treated for 6 days with or without SB203580 (5 μM). Green, control values set to 1; red, fold change over control. h, Early lesion MMTV–Her2 organoids were treated for 2 days with SB203580 (5 μM) as well as 500 ng ml−1 DKK1 and stained for E-cadherin. Bottom numbers, percentage of E-cadhi organoids; n = 10 organoids per treatment, biological duplicates. *P <0.01 (DMSO −DKK versus SB203580 −DKK and SB203580 −DKK1 versus SB203580 +DKK1); not significant (DMSO −DKK1 versus DMSO +DKK1; DMSO +DKK1 versus +DKK1 and SB203580). Scale bars, 25 μm. a, b, f, h, One-sided unpaired t-test; d, e, One-sided Mann–Whitney U-test. Data are mean ±s.e.m.
Figure 4
Figure 4. eDCC characterization and metastatic potential
a, Her2, p-Rb and DAPI immunofluorescence detection in eDCCs and DCCs in lung sections from MMTV–Her2 mice. Scale bars, 10 μm. b, Her2 and p-Rb levels in spontaneous metastasis in MMTV–Her2 mice carrying autochthonous primary tumours. Scale bars, 10 μm. c, Her2, p-Rb and DAPI detection in micro-metastasis generated from early lesion mammospheres. Scale bars, 10 μm. d, Left, percentage of positive or negative p-Rb or p-Ser10 histone 3(H3) and Her2+ solitary eDCCs or DCCs; n = 3 animals per group; mean ±s.e.m.; **P =0.0087; one-sided, unpaired t-test. Right, Percentage of positive or negative p-Rb cells within spontaneous macro-metastases (n = 3 lesions) in Her2 mice carrying overt autochthonous primary tumours (PT) or in metastases derived from MMTV–Her2 early lesions mammospheres (MS) (n =9 micro-, n =3 macro-metastasis). *P = 0.021, one-sided, unpaired t-test; mean ± s.d. from technical replicates. e, Her2, E-cadherin and DAPI signal in eDCCs or DCCs; bottom numbers, percentage of E-cad (top) or E-cad+ (bottom) DCCs, n ≥ 100 DCCs from 3 mice. Scale bars, 5 μm. f, Left, Her2+ (H+) and Twist1+ (T+) eDCCs; right, Her2+Twist1 (T) DCCs. Graph, percentage of cells with the indicated profiles. n =500 cells; 4 animals per group; **P < 0.05; one-sided Mann–Whitney U-test; median and values from individual animals. Scale bars, 10 μm. g, Haematoxylin and eosin staining of lung macro-metastasis produced by MMTV–Her2 mammospheres (MS) or tumourspheres (TS). Scale bars, 150 μm. Graph, primary tumour (PT) and metastasis (M) percentage incidence of early lesions, mammospheres and primary tumourspheres. n = 15 (MS) and 13 (TS) animals.

Comment on

  • Timing of Metastasis in Breast Cancer.
    Schwartz RS, Erban JK. Schwartz RS, et al. N Engl J Med. 2017 Jun 22;376(25):2486-2488. doi: 10.1056/NEJMcibr1701388. N Engl J Med. 2017. PMID: 28636861 No abstract available.

Similar articles

Cited by

References

    1. Sosa MS, Bragado P, Aguirre-Ghiso JA. Mechanisms of disseminated cancer cell dormancy: an awakening field. Nat Rev Cancer. 2014;14:611–622. - PMC - PubMed
    1. Hanahan D, Weinberg RA. Hallmarks of cancer: the next generation. Cell. 2011;144:646–674. - PubMed
    1. Schardt JA, et al. Genomic analysis of single cytokeratin-positive cells from bone marrow reveals early mutational events in breast cancer. Cancer Cell. 2005;8:227–239. - PubMed
    1. Klein CA, et al. Comparative genomic hybridization, loss of heterozygosity, and DNA sequence analysis of single cells. Proc Natl Acad Sci USA. 1999;96:4494–4499. - PMC - PubMed
    1. Schmidt-Kittler O, et al. From latent disseminated cells to overt metastasis: genetic analysis of systemic breast cancer progression. Proc Natl Acad Sci USA. 2003;100:7737–7742. - PMC - PubMed