. 2016 Dec 22;540(7634):552-558.
doi: 10.1038/nature20785. Epub 2016 Dec 14.

Early dissemination seeds metastasis in breast cancer

Affiliations

Early dissemination seeds metastasis in breast cancer

Hedayatollah Hosseini et al. Nature. .

Abstract

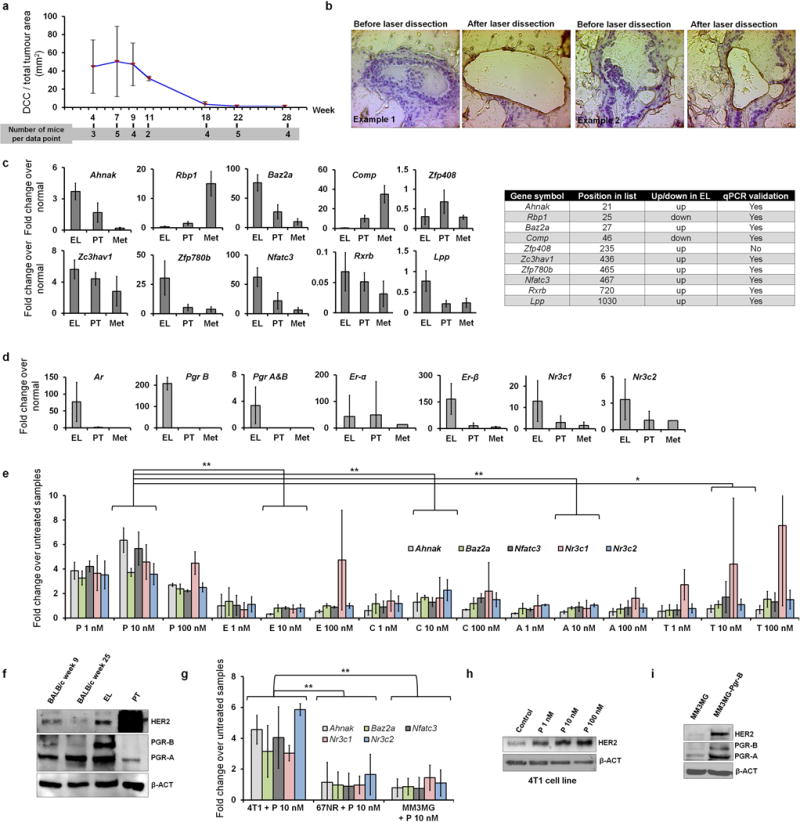
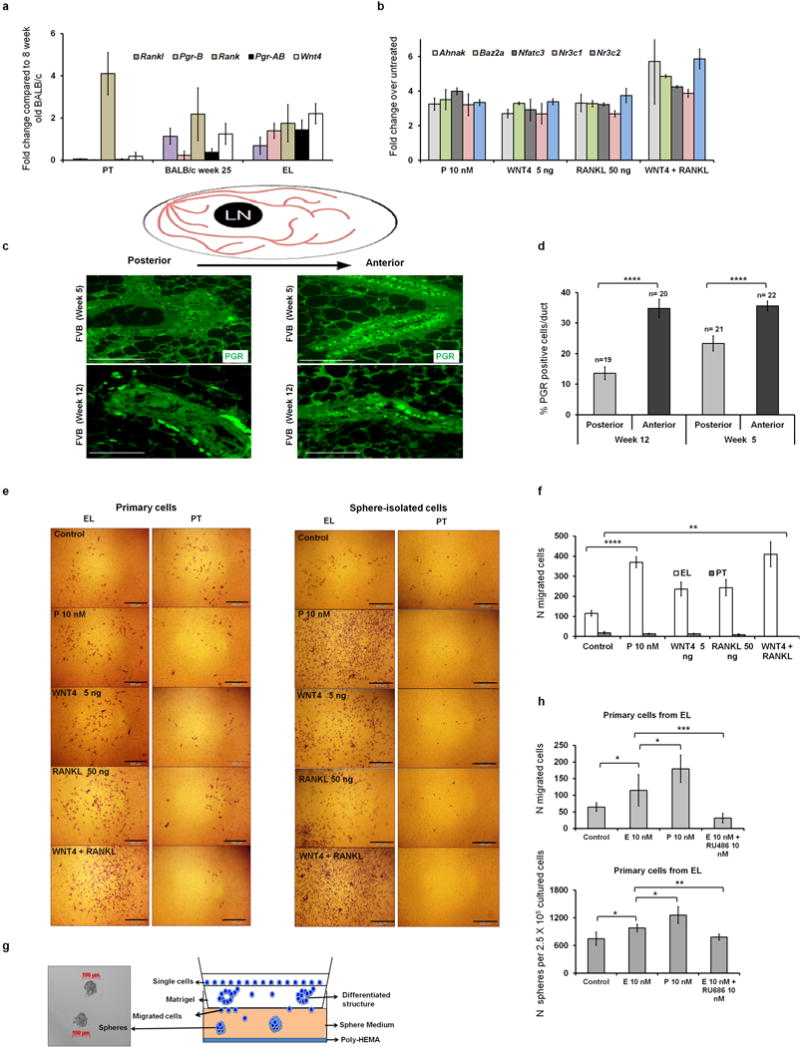
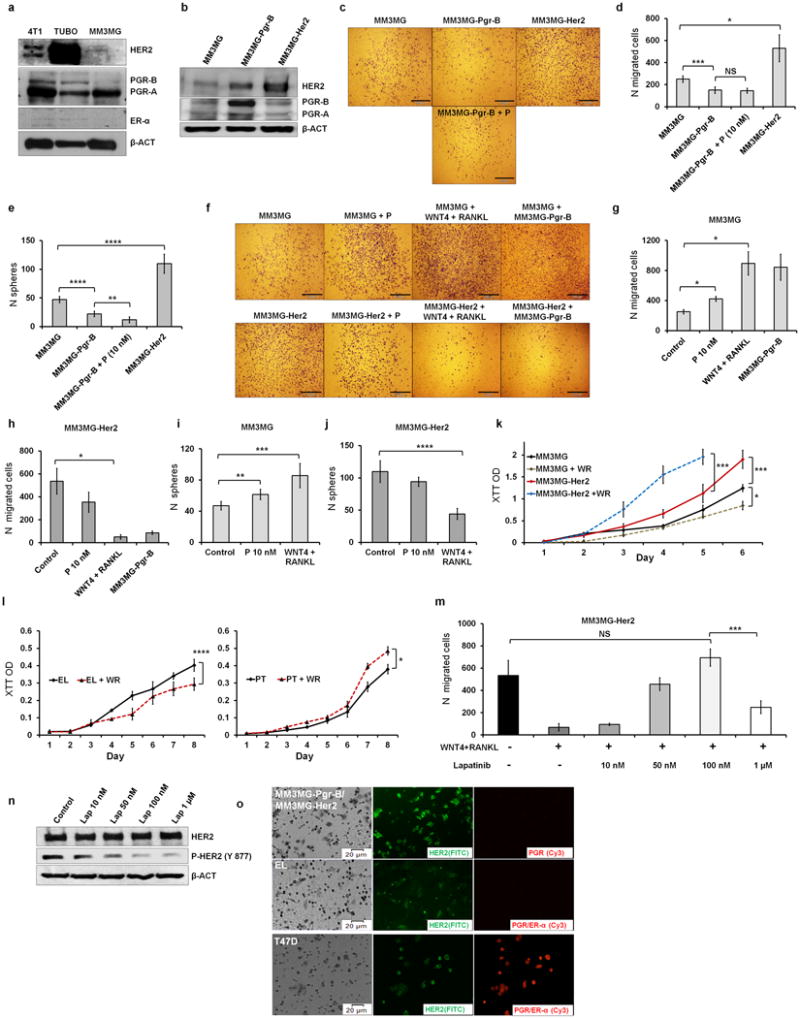
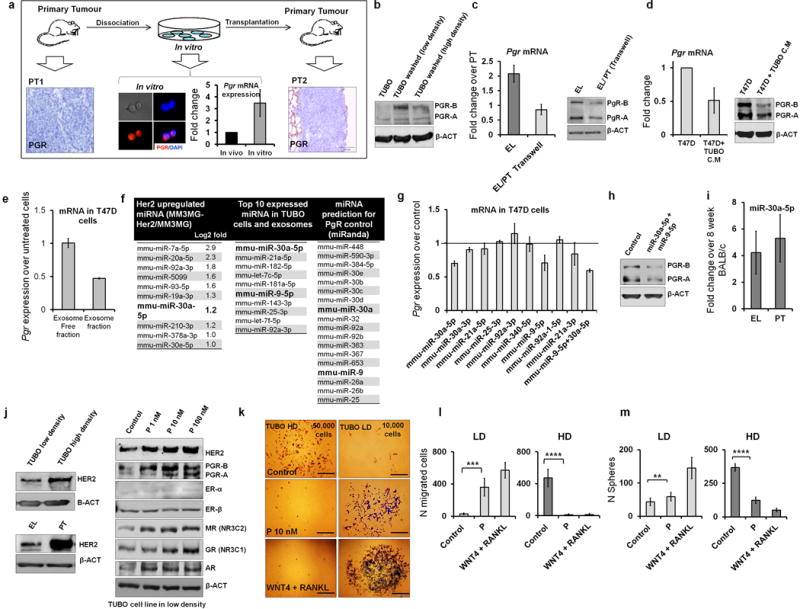
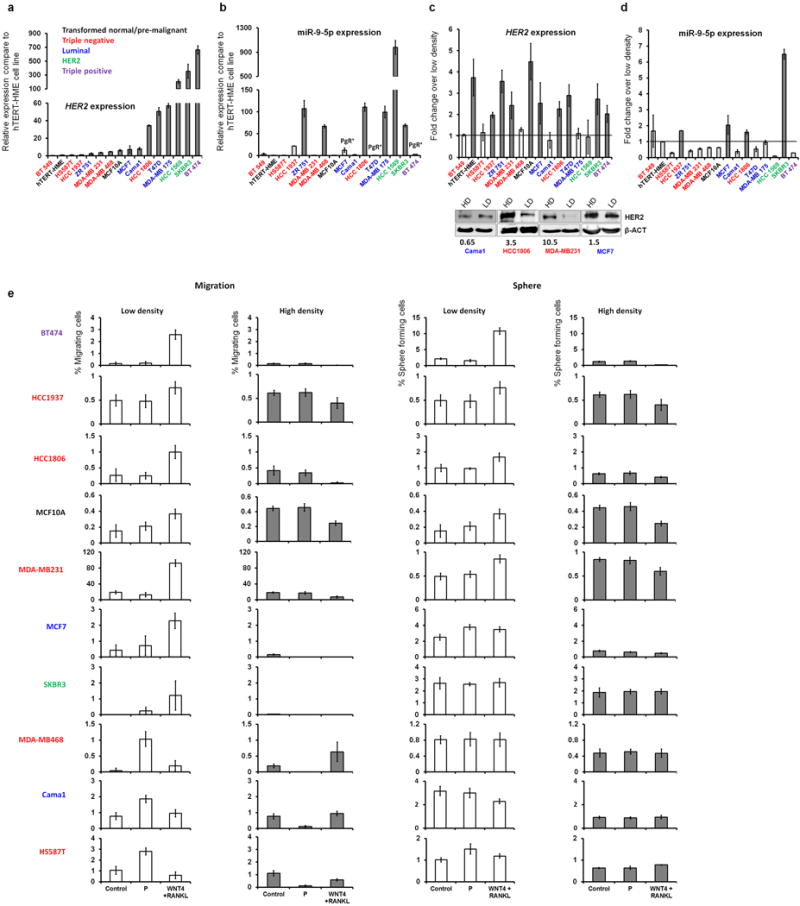
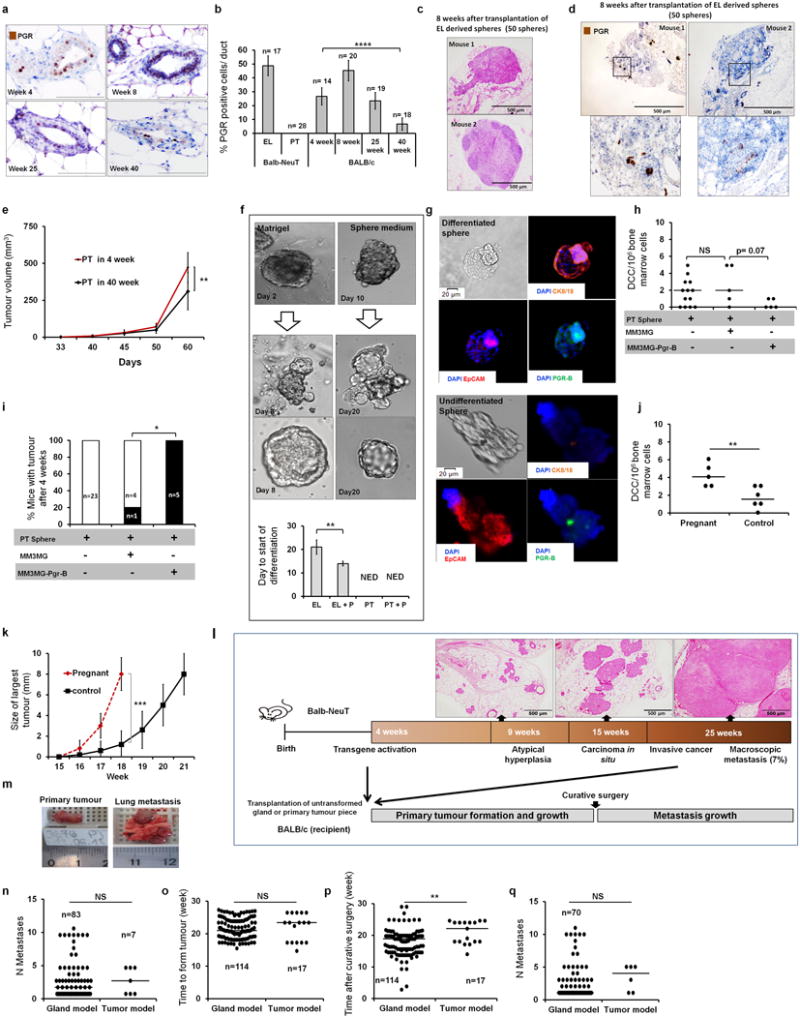
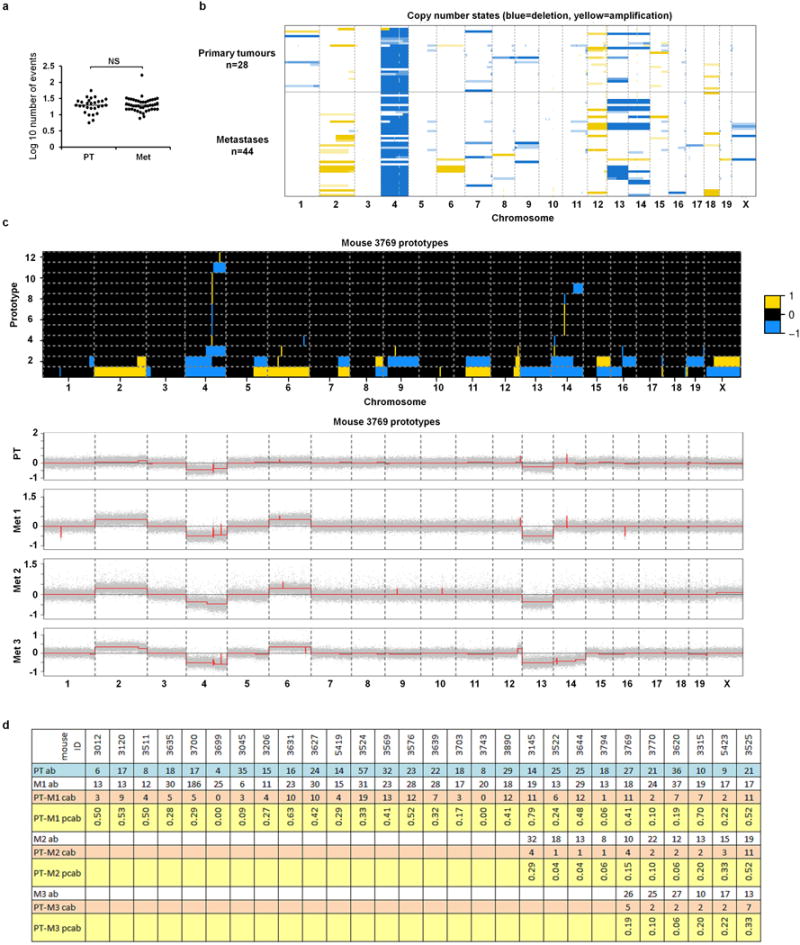
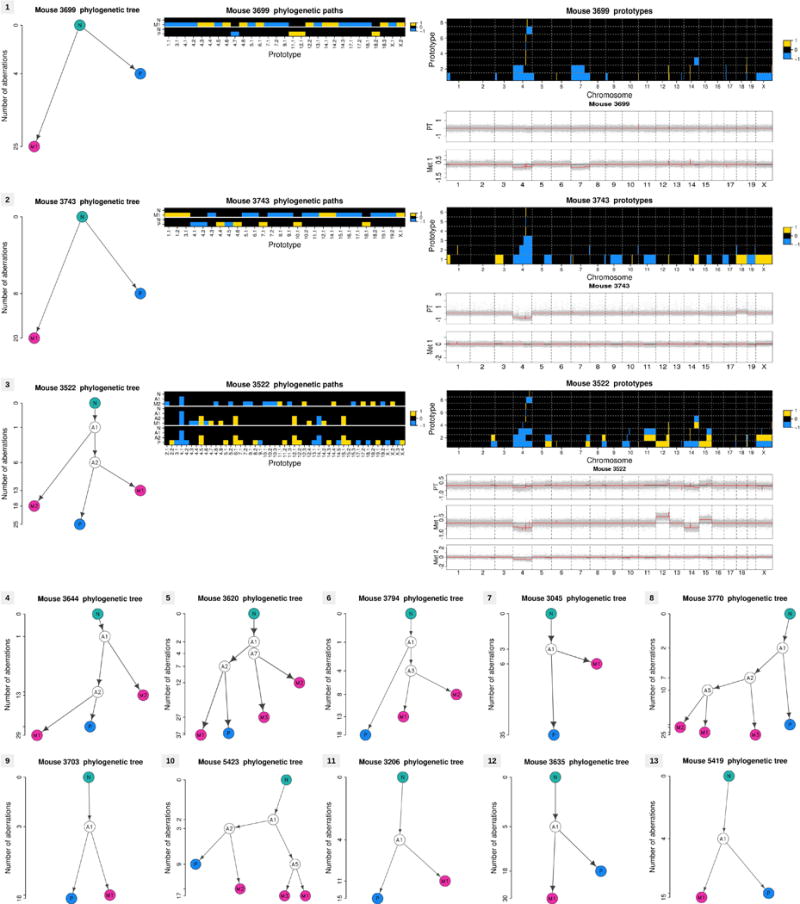
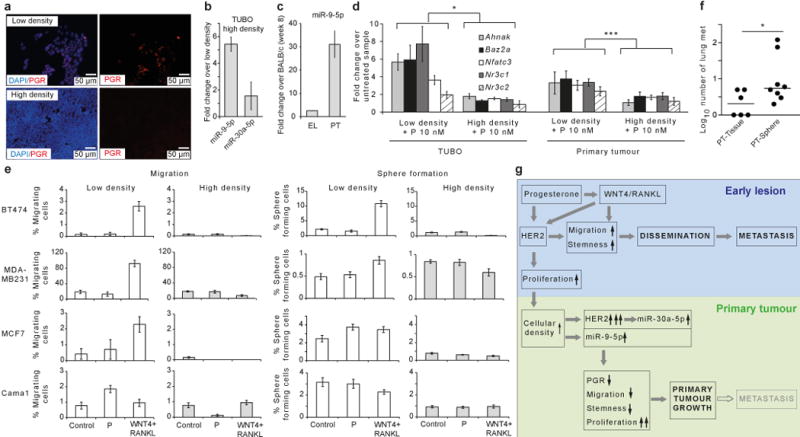
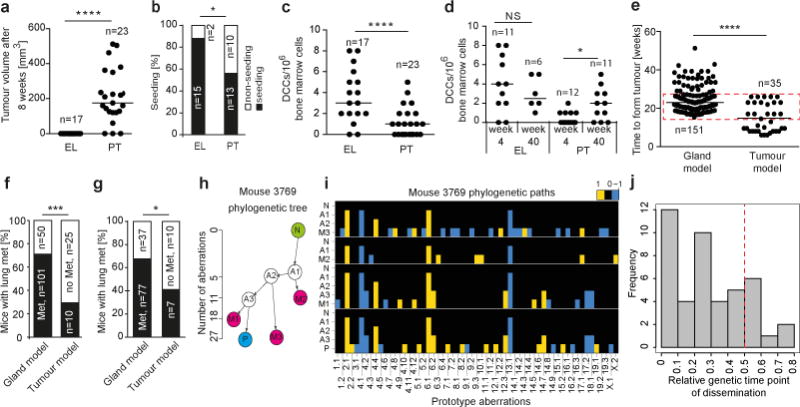
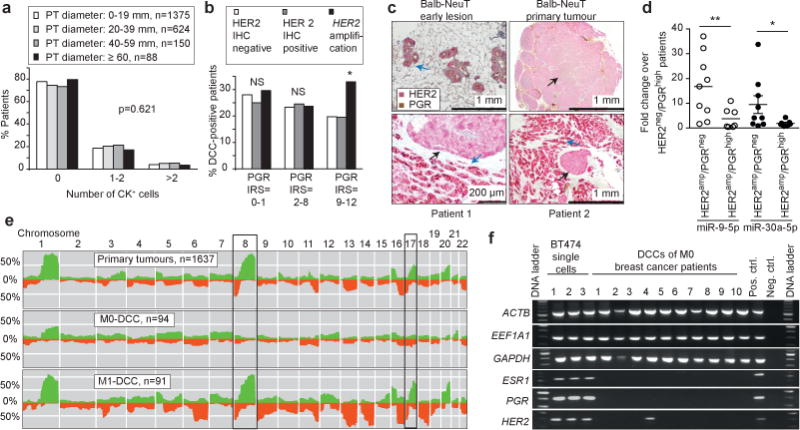
Accumulating data suggest that metastatic dissemination often occurs early during tumour formation, but the mechanisms of early metastatic spread have not yet been addressed. Here, by studying metastasis in a HER2-driven mouse breast cancer model, we show that progesterone-induced signalling triggers migration of cancer cells from early lesions shortly after HER2 activation, but promotes proliferation in advanced primary tumour cells. The switch from migration to proliferation was regulated by increased HER2 expression and tumour-cell density involving microRNA-mediated progesterone receptor downregulation, and was reversible. Cells from early, low-density lesions displayed more stemness features, migrated more and founded more metastases than cells from dense, advanced tumours. Notably, we found that at least 80% of metastases were derived from early disseminated cancer cells. Karyotypic and phenotypic analysis of human disseminated cancer cells and primary tumours corroborated the relevance of these findings for human metastatic dissemination.


Conflict of interest statement

The authors declare no competing financial interests.

Figures

Extended Data Figure 1
Extended Data Figure 1. EL signature induction and expression of Her2 and PgR
(a) The proportion of cancer cells disseminating to bone marrow (BM) in Balb-NeuT mice decreases with increasing primary tumour volume. Disseminated cancer cells (DCCs) were identified using anti-CK antibodies in BM. The y-axis displays the number of detected DCCs per 106 BM cells divided by the total tumour area in mm2. The number of mice used per data point is written below the graph. (b) Laser microdissection of epithelial structures: two examples of 7–9 week old Balb-NeuT mammary glands showing microdissection of regions with incipient epithelial hyperplasia. For all samples similar amounts of tissue (up to 100,000 μm2) were isolated. (c) qPCR validation of microarray profiles. Quantitative PCR performed for 10 genes upregulated (Up: upregulated in EL) or downregulated (Down: downregulated in EL) in microarray samples and all except one (Zfp408) were confirmed. (d) Quantitative PCR for the mRNA level of all steroid hormone receptors (EL, early lesions; PT, advanced primary tumour; Met, lung metastasis). (e) Primary cultures from mammary tissue of 7–9 week old Balb-NeuT mice, were treated with progesterone (P), estrogen (E), aldosterone (A), cortisol (C), and testosterone (T) in different concentrations (1, 10, and 100 nM) or vehicle (ethanol; untreated) for 75 hours. Only progesterone induces upregulation of the complete EL signature. (f) Elevated expression of PgR-B in young mammary glands (BALB/c week 9 and Balb-NeuT EL compared to BALB/c week 25) but not primary tumours correlates with elevated HER2 expression. (g) Progesterone induces the EL signature in 4T1 cells (highly aggressive and metastatic cell line derived from a spontaneous BALB/c mammary tumour), but not in 67NR (tumorigenic and non-metastatic cell line derived from spontaneous BALB/c mammary tumour) and MM3MG cells (normal mammary epithelial cell line derived from BALB/c mouse). (h) Progesterone treatment up-regulates HER2 in 4T1 cells. (i) Overexpression of PGR-B in MM3MG cells up-regulates HER2 expression. All p-values, Student’s t-test; *, p≤0.05; **, p≤0.01; all error bars correspond to standard deviation (Mean ±SD). For gel source data, see Supplementary Figure 1.
Extended Data Figure 2
Extended Data Figure 2. Progesterone regulates migration and is linked to branching morphogenesis
(a) qPCR analysis of Pgr, Rank, Rankl and Wnt4 in normal and transgenic mammary tissue or tumours. Note the elevated expression of Pgr, Wnt4, and Rankl in EL compared to PT. Only Rank (receptor of Rankl) is strongly expressed in primary tumours. (b) Primary cultures of EL treated with progesterone (P), WNT4, and RANKL. WNT4 and RANKL treatment induce the EL signature and act synergistically. (c–d) PGR (green) staining at 5 weeks and 12 weeks of age (FVB wild type mice; scale bar = 100 μm). The percentage of PGR+ cells per duct was quantified (two mice/age group) in the anterior and posterior portions of the gland (relative to lymph node, LN). PGR expressing cells were more abundant in anterior ducts (number of analysed ducts per group is displayed on top of each column). (e–f) Photomicrograph of migration assay (E) and quantification (F) of migrating cells derived from fresh tissue (e, left panel) or dissociated PT- and EL-spheres (e, right panel; f, quantification). Progesterone (P), WNT4, and RANKL induce migration of EL-derived but not PT-derived cells (see also Figure 2a). (g) Scheme of combined migration and sphere assay. The lower chamber is filled with serum-free sphere medium and its bottom is covered with poly-HEMA to prevent adhesion and enable sphere formation. After 72 h migration, the insert is removed and the lower chamber is monitored (after 11 days) for mammosphere formation. (h) Effect of estrogen and progesterone on migration and sphere formation of EL-derived mammary cells. Cells were exposed to either 10 nM estrogen (E) or progesterone (P) or 10 nM estrogen in the presence of 10 nM progesterone inhibitor RU486. All p-values, student’s t-test; *, p≤0.05; **, p≤0.01; ***, p≤0.001; ****, p≤0.0001; error bars in panel d correspond to standard error of the mean (Mean ±SEM); all other error bars correspond to standard deviation (Mean ±SD).
Extended data Fig 3
Extended data Fig 3. HER2 expression levels regulate migration and proliferation
(a) Parental MM3MG cells, a cell line derived from mammary epithelial cells of wild-type BALB/c mice, do not express ERα but low levels of HER2 and PGR-B when compared to 4T1 and TUBO cells (TUBO cells were grown at low density; see Figure 3 and Extended Data Fig 4–5 for reasoning). (b) Immunoblot confirming successful transduction of the MM3MG cell line with Her2 and Pgr-B. Note that transduction of Pgr B increases HER2 levels. (c–d) Overexpression of Pgr-B in MM3MG cells reduces migration, while Her2 overexpression (MM3MG-Her2) increases migration of cells. Addition of progesterone does not alter migration of PGR-B-overexpressing cells (MM3MG-Pgr-B). (e) Overexpression of Pgr-B in MM3MG cells reduces sphere-forming ability whereas Her2 overexpression increases it. These results (c–e) suggest that migrating/sphere forming cells are not among the PGR+ but among the PGR population responsive to PIPS. (f–j) To explore which PGR negative cells are the target population of progesterone signalling, we exposed parental MM3MG cells and Her2-transduced cells to progesterone, PIPS or mixed them with PGR+ cells (only for migration experiments). Progesterone, WNT4/RANKL, and co-culture with MM3MG-Pgr-B (only migration) induce sphere formation and migration of MM3MG cells but decrease these responses in MM3MG-Her2 cells. (k) Overexpression of Her2 increases proliferation of MM3MG cells (MM3MG-Her2). WNT4 plus RANKL (WR) further increase proliferation of MM3MG-Her2 cells, but decrease proliferation of parental (MM3MG) cells. Therefore based on expression of HER2, cells either migrate (HER2low/negative) or proliferate (HER2high). (l) WNT4 plus RANKL (WR) treatment induces proliferation of primary cultured PT cells, but reduces it in EL-derived cells. (m) Reduction of HER2 signalling by lapatinib overrides the inhibitory effect of WNT4 plus RANKL and increases migration in MM3MG-Her2 cells. However, strong inhibition of HER2 signalling reduces migration. (n) Lapatinib inhibits HER2 signalling by preventing phosphorylation. (o) Cells that migrated through the pores of the migration chamber insert were stained for HER2 (FITC, green) and PGR/ER-α (Cy3, red). In 1:1 co-culture of MM3MG-Pgr-B and MM3MG-Her2 (upper panel) only Her2-expressing cells migrate. Migrated EL-derived primary cells (lower panel) do not express PGR and display faint HER2 staining (brightness of HER2 and PGR staining in lower panel micrographs were increased by 50% for better visibility). HER2 and PGR double-positive T47D cells fixed onto the filters of migration chambers serve as positive control of staining. These results (m-o) indicate that cells with low/intermediate signalling of HER2 respond best to migration and sphere formation inducing PIPS. P-values for the migration and sphere assays represent Student’s t-test; p-values for the proliferation curves (k,l) were derived from F-tests for the slopes; *, p≤0.05; **, p≤0.01; ***, p≤0.001; ****, p≤0.0001; NS, Not Significant; all error bars correspond to standard deviation (Mean ±SD). For gel source data, see Supplementary Figure 1.
Extended Data Figure 4
Extended Data Figure 4. Cell density and regulation of progesterone and HER2 signalling
(a) PGR expression silenced in tumours can be re-activated in culture and re-silenced in vivo. (b) PGR re-expression in TUBO cells grown at low density and high density only after frequent medium change. (c) Down-regulation of PGR in EL cells cultured in a transwell assay next to primary tumour cells suggests the existence of a secreted factor passing through the membrane of the transwell insert and down-regulating Pgr mRNA (left) and protein (right). (d) T47D cells exposed to conditioned medium from TUBO cells display reduced Pgr mRNA (left) and protein (right). (e) Exosomes derived from the cell culture medium of TUBO cells grown at high density (exosome fraction) induce down-regulation of Pgr in T47D cells. (f) Results of miRNA sequencing to identify Pgr regulating miRNAs. The left table lists the top 10 up-regulated miRNAs in HER2-overexpressing cells (MM3MG-Her2) compared to control (MM3MG). The middle table presents the top 10 expressed miRNAs in TUBO cells and TUBO cell-derived exosomes. The right table displays miRNAs predicted by the miRanda web-software to regulate Pgr. (g) Among all candidate miRNAs only miR-30a-5p and 9-5p induce down-regulation of Pgr mRNA in T47D cells. (h) Down-regulation of PGR in T47D cells treated with miR-30a-5p and 9-5p. (i) Expression of miR-30-5p in EL and PT samples compared to 8 week BALB/c mammary glands. (j) Density induced up-regulation of HER2 in TUBO cells grown at low or high density and EL vs. PT samples (left panel) and progesterone-responsiveness of low-density TUBO cells. Note that levels of HER2, PGR, NR3C11, NR3C2, and AR are regulated by progesterone in a dose dependent manner. (k-m) TUBO cells grown at low density and exposed to progesterone (P) or PIPS migrated more (k–l) and produced more spheres (m), similar to EL-derived cells (See Figure 2). **, p≤0.01; ***, p≤0.001; ****, p≤0.0001; All error bars correspond to standard deviation (Mean ±SD). For gel source data, see Supplementary Figure 1.
Extended Data Figure 5
Extended Data Figure 5. Cell density and regulation of progesterone and HER2 signalling in human cell lines
To explore whether human breast cancer cells display similar regulatory circuits as found in murine cells, we selected 16 cell lines of different breast cancer subtypes. (a) Her2 mRNA expression levels in 15 human cell lines compared to the h-TERT-HME cells. Different colours of cell line names indicate subtype of breast cancer with the colour key for the breast cancer subtype of cell lines being shown in the figure. (b) The expression of miR-9-5p in human breast cancer cell lines compared to h-TERT-HME cells. Note that Her2 strong-expressing cell lines (see panel a) express more miR-9-5p similar to PTs of Balb-NeuT and TUBO cells (See Fig 3b–c), but two HER2high/PGRhigh cell lines, BT474 and T47D do not express miR-9-5p similar to human HER2high/PGRhigh samples (See Figure 5d). (c) High cell density up-regulates Her2 at mRNA (upper panel) or protein levels (lower panel) in several cell lines. Only four cell lines were checked for protein level (HER2 level not influenced by cell density – Cama1; HER2 level regulated by cell density – HCC1806, MDA-MB-231, and MCF7). Numbers below the blots indicate fold-change of HER2 in high density compared to low density normalized over beta actin. (d) Expression of miR-9-5p is up-regulated by cell density in SKBR3, HCC1937, HCC1806, and MCF7 cell lines. (e) Migration and sphere-forming potential of 10/16 cell lines grown at low and high densities, and treated with PIPS or progesterone. The first 7 cell lines regulate Her2 transcripts by density (See panel c) and their response to PIPS is similar to TUBO cells and primary mammary cell cultures of Balb-NeuT mice (See Figures 2, and Extended Data Fig 4l–m). The remaining three cell lines do not regulate Her2 transcripts by cell density but respond to progesterone similarly to TUBO cell line and primary mammary cell cultures of Balb-NeuT mice (See Figures 2, and Extended Data Fig 4l–m). We did not perform functional assays with BT549 (TN), T47D (luminal, MCF7-like), MDA-MB-175, ZR75-1 (luminal, CAMA1-like), hTERT-HME (transformed normal, similar to MCF-10A) because of breast cancer subtype redundancy or poor growth (HCC1569). Y-axes show the percentage of migrating cells (left) and observed spheres (right) relative to seeded cells. All error bars correspond to standard deviation (Mean ±SD). For gel source data, see Supplementary Figure 1.
Extended Data Figure 6
Extended Data Figure 6. Differentiation ability and metastasis formation
(a–b) PGR expression of mammary epithelial cells from wt-BALB/c mice at 4, 8, 25 and 40 weeks of age (scale bar = 100 μm). PGR expression was reduced by 75% in 40-week-old wild-type mammary gland compared to week-4 mice and disappeared in PT (See also Extended Data Fig 1f and Extended Data Fig 2a). N indicates number of ducts/glands (in EL and normal tissue) or visual fields in primary tumours. (c–d) Representative micrographs of lesions 8 weeks after transplantation of EL-spheres resembling DCIS (c) or less advanced EL (d) displaying PGR expression (PGR, brown nuclear staining). (e) Tumour growth from PT spheres in young and old recipients. (f) Differentiation of mammary epithelial cells from EL in matrigel (right panel) or in sphere culture (left panel) into acinus-like structures. PT cells did not generate acinus-like structures. Progesterone (P) stimulation accelerated formation of acinus-like structures by EL cells, under mammosphere conditions (NED, no evidence of differentiation). (g) Staining for CK8/18, PGR, and EpCAM reveals exclusive expression of PGR and CK8/18 in differentiated structures (upper panel) as compared to undifferentiated spheres (lower panel). (h–i) PT spheres were transplanted alone (n=23) or co-transplanted with MM3MG-Pgr-B (n=5) or MM3MG spheres (n=5). The number of DCCs in bone marrow (panel h) and the number of mice with tumour (panel i) were checked 4 weeks later. Pgr-B-transduced mammary epithelia (MM3MG) suppress metastatic dissemination (evaluated as BM-DCC counts) from PT spheres (h). PGR enriched environment induces tumour growth. One out of 5 in the PT+MM3MG transplanted group and 5 out of 5 in the PT+MM3MG-Pgr-B transplanted group formed tumours, while no mouse transplanted only with PT-spheres formed tumours within 4 weeks after transplantation (i). (j) Pregnancy at EL-stage induces dissemination. A group of young Balb-NeuT mice mated (n=5) at EL stage (week 7) and were sacrificed at the end of pregnancy. These mice did not formed palpable tumours, but had higher number of DCCs compared to unmated mice (n=6) as control. (k) Pregnancy at advanced tumour stage. A group of Balb-NeuT mice (n=5) were mated at the time of in situ carcinoma (week 15) and sacrificed at the end of pregnancy. All pregnant mice had faster growing tumours compared to unmated control mice. (l) Schematic of transplantation protocol for mammary gland or PT tissue pieces into wild type recipients. (m) Example of PT and macro-metastasis assessment. (n) Number of metastatic foci in transplanted mice. 18 mice from gland model, and 3 mice from tumour model were excluded from analyses due to the fusion of metastatic lesions making it difficult to count individual lesions. (o) Similar growth kinetics of primary tumours from gland and tumour piece model for samples from red box in Figure 4e. (p–q) Mice from (o) were compared for duration follow-up period after surgery. Mice from both groups were sacrificed at first signs of general health deterioration, which occurred earlier in gland-model mice (p). Longer follow-up time after curative surgery did not result in more metastases in recipients transplanted with PT pieces (q). p-value in panels b, f, h and j Student’s t-test; in panel i, Fisher’s exact test; in panel c, and k were derived from F-test for the slopes; in panels n, o, p, and q, Mann-Whitney test; *, p≤0.05; **, p≤0.01; ***, p≤0.001; ****, p≤0.0001; NS, Not Significant; error bars in panels b, e, f, and k correspond to standard deviation (Mean ±SD) and panels h, j, n, o, p, and q represent median.
Extended Data Figure 7
Extended Data Figure 7. Array CGH analysis of primary tumour – metastasis pairs
(a) Number of aberrations detected by aCGH in primary tumours and matched lung metastases (dot plot displays median; p-value, Mann-Whitney test). (b) Heatmap of copy number states for the 28 primary tumours and 44 matched metastases across chromosomes 1–19 and X. Light, medium and dark yellow/blue colours indicate weak, intermediate and strong amplification/deletion amplitudes, respectively (thresholds at ±0.1, ±0.2, ±0.3). (c) Prototype aberrations (top) constructed from segmented array CGH profiles (bottom) of the primary tumour (PT) and the matched metastases (Met 1–3) of mouse 3769 (phylogenetic tree and phylogenetic paths displayed in Figure 4h–i). Prototypes (top) are organized in stacked rows per chromosome and numbered according to chromosome and positional order of their first change point, e.g. 1.2 denotes the 2nd prototype of chromosome 1. These prototype aberrations are then used to construct the phylogenetic paths (e.g. Figure 4i) and trees. For better visibility, small focal aberrations were enlarged to have a minimal extension of 300 probes. Yellow colour indicates amplification (+1) while blue colour encodes deletion (−1). Corresponding segmentation profiles of the normalized and wavy-pattern-corrected array CGH data (grey dots) are indicated by red lines (bottom). For segmentation and prototype construction see Methods. (d) Table for calculating the relative time points of dissemination (Figure 4j). PT ab: number of aberrations in the primary tumour; Mk ab: number of aberrations in the matched metastases (k=1,2,3); PT-Mk cab: number of common aberrations between PT and Mk; PT-Mk pcab: proportion of common aberrations relative to the primary tumour, i.e. pcab = cab/PT ab.
Extended Data Figure 8
Extended Data Figure 8. Phylogenetic analysis of metastasis (part 1: early divergence)
Phylogenetic trees of the top 13 of the 28 primary tumours and matched metastases samples listed according to earliest time point of dissemination (for details see tables in Extended Data Figures 7 and 9). Normal cells are indicated by N, primary tumours by P and metastases by M1-3. Profiles A1-7 denote inferred common ancestors (intermediates) (see Methods). The ordinate indicates the number of aberrations per profile (on a square root scale). For the first three matched samples, also the tree paths (mid), prototype aberrations (top right) and segmented array CGH profiles (bottom right) are displayed in addition to the phylogenetic tree (left). Aberration profiles along phylogenetic paths run from N via A1-7 to P or M1-3. Aberration prototypes are named according to chromosome and positional order of their first change point, e.g. 2.2 denotes the 2nd aberration prototype of chromosome 2 (see Methods and Extended Data Figure 7c).
Extended Data Figure 9
Extended Data Figure 9. Phylogenetic analysis of metastasis (part 2: late divergence)
(a) Phylogenetic trees of the top 14 of the 28 primary tumour (PT) and matched metastasis (M) samples listed according to latest time point of dissemination. For the first three mice also the phylogenetic paths (mid), prototype aberrations (top right) and segmented array CGH profiles (bottom right) are shown next to the phylogenetic tree (left). See Methods and Extended Data Figures 7 and 8. (b) Summary table of all phylogenetic analyses indicates the position of the corresponding mouse phylogenetic tree in Extended Data Figure 8 (EDF8) and 9 (EDF9) for each primary tumour–metastasis-pair. The two bottom rows indicate the rank and the corresponding relative time point of dissemination as measured by the proportion of aberrations shared between PT and M (PT-M pcab; see Extended Data Figure 7 and Fig 4j). Note that only metastases ranked on position 36–44 diverged late as per our definition. The phylogenetic tree and phylogenetic paths for mouse 3769 are displayed in main Figure 4h–i. In the “pos-EDF8” and “pos-EDF9” rows the darker colours are those samples that all pieces of data including phylogenetic paths, prototype aberrations, segmented array CGH profiles, and phylogenetic trees are shown. Faint colours cells in “pos-EDF8” and “pos-EDF9” are samples those only phylogenetic trees are shown for them.
Extended Data Figure 10
Extended Data Figure 10. PGR, HER2 signalling, and dissemination in breast cancer patients
(a) Double staining of HER2high/PGRhigh human breast cancer sample (PGR: brown, nucleus; HER2: red/pink, membrane). Cells with varying expression levels of HER2 and PGR, as well as negative, single- or double-positive cells can be seen (scale bar = 100 μm). Arrows indicate DP, double-positive; DN, double-negative; SP, single-positive. (b) Lack of PGR expression in high-density areas of HER2high/PGRhigh classified tumour samples is directly linked to high miR-9-5p and miR-30a-5p expression. Panel b represents standard deviation (Mean ±SD).
Figure 1
Figure 1. Identification of a gene expression signature linked to early dissemination
(a) Heatmaps of genes differentially expressed between different sample types: normal mammary glands from BALB/c, early lesions (EL), primary tumours (PT) and metastases (MET) from Balb-NeuT mice; yellow, upregulation; blue, downregulation. (b) Five-gene surrogate signature (qPCR) for EL profile. (c) Progesterone (P) activates EL-signature in vitro (t-test; Mean ±SD). (d) TissueFAX cytometric quantification of HER2 and PGR protein expression. Mean HER2 staining intensity (red line, left histograms) in arbitrary units and percentage of PGR+ cells (right histogram) and box plots (One-way ANOVA). **, p≤0.01; ****, p≤0.0001.
Figure 2
Figure 2. Progesterone induces migration and sphere formation of EL cells
(a) EL and PT cells respond to progesterone or PIPS (WNT4, RANKL) with activation (EL) or suppression of migration (PT). (b) Mammosphere-formation depends on age and HER2 expression. (c) EL and PT cells respond to progesterone or PIPS with activation (EL) or suppression of sphere formation (PT). (d) Depletion of PIPS by IWP-2 (WNT inhibitor) or anti-RANKL (neutralizing antibody) reduces migration and sphere formation of EL cells. (e) PIPS-activated migrating cells form spheres (See also Extended Data Fig 2g). All p-values, Student’s t-test; *, p≤0.05; **, p≤0.01; ***, p≤0.001; ****, p≤0.0001; error bars depict Mean ±SD.
Figure 3
Figure 3. Cell density regulates PgR expression and EL phenotype
(a) TUBO cells re-express PGR at low cell density. (b) TUBO cells grown at high density up-regulate miR-9-5p. (c) Expression of miR-9-5p in early lesion (EL) and primary tumour (PT) samples. (d) PT and TUBO cells generate the EL-signature only when grown at low density. (e) Migration and sphere-formation of four human cell lines grown at low and high densities and treated with PIPS (WNT4+RANKL) or progesterone (See also Extended Data Fig 5; error bars are Mean ± SD). (f) Number of lung macro-metastases after tumour formation from transplanted tumour pieces (1 mm3; high density) or 50 spheres in 40 μl matrigel (low density) and PT surgery (Mann-Whitney test; median). (g) Mechanisms of local tumour and distant metastasis formation as derived from in vitro and in vivo (see Fig 4) data. *, p≤0.05; ***, p≤0.001.
Figure 4
Figure 4. Progesterone signalling regulates tumour formation and dissemination in vivo
(a) Tumour formation 8 weeks after transplantation of PT- or EL-derived spheres into mammary fat pads of wt-BALB/c siblings. (b) Percentage of mice with DCCs (detected by cytokeratin staining) in bone marrow (BM) 8 weeks after transplantation. (c) Number of DCCs in BM of mice 8 weeks after transplantation. (d) DCC counts in BM in recipients transplanted at different age. (e) Time to tumour formation after transplantation of mammary glands (week 4; gland model) or tumour pieces (week 20–22; tumour model). The red box highlights mice from both models with similar tumour growth kinetics, which are analysed separately in Extended Data Fig 6o–q. (f) Percentage of mice with lung macro-metastasis in gland vs. PT model. (g) Macro-metastasis formation in recipient mice with similar tumour growth kinetics (mice enclosed in red box of panel e; see Extended data Fig 6o). (h) Example of a phylogenetic tree (mouse 3769): N, normal cells; P, primary tumour; M1-3, metastases 1–3; A1-3, inferred common ancestors. The ordinate indicates the number of aberrations per profile on a square root scale. (i) Aberration profiles along tree paths from N via A1-3 to P or M1-3 in terms of aberration prototypes (see Extended data Fig 7–9 for details). (j) Distribution of relative “time points” of dissemination on a genetic scale for all 44 primary tumour-metastases pairs. The red line indicates dissemination after which 50% of primary tumour changes were acquired as an arbitrary threshold for early vs late dissemination; see Extended Data Fig 7c). P-values in panel a, c, and d: Student’s t-test; in b,: Fisher’s exact test; in f and g: chi square test; in e: Mann-Whitney test. *, p≤0.05; ***, p≤0.001; ****, p≤0.0001; NS, Not Significant. Panels a, c, d, and e represent medians.
Figure 5
Figure 5. PGR, HER2 signalling, and dissemination in breast cancer patients
(a) An increase in tumour diameter is not accompanied by an increase of DCCs in bone marrow. (b) PGR and HER2 expression identifies a HER2high/PGRhigh subgroup of patients with highest seeding rates. (c) Comparison of HER2high/PGRhigh human breast cancers and primary Balb-NeuT mouse tumours for HER2/PGR staining: (A–B) EL (A) and PT (B) from Balb-NeuT model. (C–D) High-density regions (strong HER2 and low PGR expression, black arrows) and regions of invasive cells (strong PGR and HER2 expression, blue arrows). (d) PGR-downregulating miRNAs are repressed in HER2high/PGRhigh human mammary carcinomas. (e) Copy number alterations in human primary breast cancers (from progenetix database) and DCCs isolated from bone marrow of breast cancer patients with and without metastasis (M0: n=94; M1: n=91). The y-axis depicts the percentage of samples with aberrations (green = gain; red = loss) for each chromosomal region. (f) Oestrogen receptor (ESR1) and progesterone receptor (PGR) transcript expression in human breast cancer DCCs (10/26 DCCs from 19 M0 patients are shown; see Supplementary Table 8). ACTb, EEF1a1, GAPDH: controls for sample quality. BT474 single cells: positive control. P-values in a, b: chi-square test; in d: Mann-Whitney test ; *, p≤0.05; **, p≤0.01; NS, Not Significant.

Comment in

  • Timing of Metastasis in Breast Cancer.
    Schwartz RS, Erban JK. Schwartz RS, et al. N Engl J Med. 2017 Jun 22;376(25):2486-2488. doi: 10.1056/NEJMcibr1701388. N Engl J Med. 2017. PMID: 28636861 No abstract available.

References

    1. Aguirre-Ghiso JA, Bragado P, Sosa MS. Metastasis awakening: targeting dormant cancer. Nature medicine. 2013;19:276–277. doi: 10.1038/nm.3120. - DOI - PMC - PubMed
    1. Polzer B, Klein CA. Metastasis awakening: the challenges of targeting minimal residual cancer. Nature medicine. 2013;19:274–275. doi: 10.1038/nm.3121. - DOI - PubMed
    1. Cole BF, Gelber RD, Gelber S, Coates AS, Goldhirsch A. Polychemotherapy for early breast cancer: an overview of the randomised clinical trials with quality-adjusted survival analysis. Lancet. 2001;358:277–286. - PubMed
    1. Gianni L, et al. Treatment with trastuzumab for 1 year after adjuvant chemotherapy in patients with HER2-positive early breast cancer: a 4-year follow-up of a randomised controlled trial. Lancet Oncol. 2011;12:236–244. doi: 10.1016/S1470-2045(11)70033-XS1470-2045(11)70033-X [pii] - PubMed
    1. Klein CA, et al. Genetic heterogeneity of single disseminated tumour cells in minimal residual cancer. Lancet. 2002;360:683–689. - PubMed