. 2016 Dec 15:6:38873.
doi: 10.1038/srep38873.

Roles of human POLD1 and POLD3 in genome stability

Affiliations

Roles of human POLD1 and POLD3 in genome stability

Emanuela Tumini et al. Sci Rep. .

Abstract

DNA replication is essential for cellular proliferation. If improperly controlled it can constitute a major source of genome instability, frequently associated with cancer and aging. POLD1 is the catalytic subunit and POLD3 is an accessory subunit of the replicative Pol δ polymerase, which also functions in DNA repair, as well as the translesion synthesis polymerase Pol ζ, whose catalytic subunit is REV3L. In cells depleted of POLD1 or POLD3 we found a differential but general increase in genome instability as manifested by DNA breaks, S-phase progression impairment and chromosome abnormalities. Importantly, we showed that both proteins are needed to maintain the proper amount of active replication origins and that POLD3-depletion causes anaphase bridges accumulation. In addition, POLD3-associated DNA damage showed to be dependent on RNA-DNA hybrids pointing toward an additional and specific role of this subunit in genome stability. Interestingly, a similar increase in RNA-DNA hybrids-dependent genome instability was observed in REV3L-depleted cells. Our findings demonstrate a key role of POLD1 and POLD3 in genome stability and S-phase progression revealing RNA-DNA hybrids-dependent effects for POLD3 that might be partly due to its Pol ζ interaction.


Figures

Figure 1
Figure 1. Effect of POLD1 and POLD3 depletion on DNA replication and S-phase progression.
(A) Representative cell cycle profiles of exponentially growing HeLa cells after the indicated siRNA-mediated depletions. (B) Percentage of S-phase cells and quantification of EdU average signal in S-phase cell. More than 1000 cells were scored for each experiment. Means ± SEM from five independent experiments are shown. Differences between distributions were assessed by the Mann-Whitney test. (C) FACS profile of HeLa cells at different time points after release from double thymidine block. (D) Percentage of cells that progress into S-phase based on panel C. A representative experiment is shown and quantified. (E) Immunoblot to assay the knockdown of the siRNA targeted proteins and relative protein quantification. β-Actin was used as a loading control. Densitometric quantification of the corresponding bands was performed using ImageJ analysis software. Values were normalized to β-Actin and expressed as relative to siCTR. Means ± SEM from three independent experiments are shown. (F) Diagram and representative picture of a DNA fiber labeled by IdU and CldU for single DNA molecule analysis on HeLa cells. (G) Distribution of RF velocity and interorigin distance. The data from two independent experiments were pulled together. Differences between distributions were assessed by the Mann-Whitney test.
Figure 2
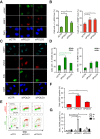
Figure 2. DNA damage markers and their cell cycle distribution in POLD1- and POLD3-depleted cells.
(A) Immunofluorescence of HeLa cells stained with antibodies against γH2AX and 53BP1. (B) Percentage of cells with more than 5 foci. Means ± SEM from at least five independent experiments are shown. (C) Immunofluorescence of HeLa cells stained with antibodies against γH2AX and 53BP1 and with EdU click-it labeling kit. (D) Percentage of cells with more than 5 foci in EdU positive and EdU negative cells. More than 100 cells were scored for each experiment. Means ± SEM from at least three independent experiments are shown. (E) FACS profile from one representative experiment of HeLa cells labeled for γH2AX, EdU and DNA. (F) Percentage of γH2AX positive cells. More than 1000 cells were scored for each experiment. Means ± SEM from five independent experiments are shown. (G) Percentage of γH2AX positive cells in the different cell cycle phases. More than 1000 cells were scored for each experiment. Means ± SEM from five independent experiments are shown. Differences between distributions were assessed by paired t-test (B) or by the Mann-Whitney test (D, F and G).
Figure 3
Figure 3. Effect of POLD1 and POLD3 depletion on SCE and chromosome abnormalities.
(A) Representative images of metaphase spreads with differentially stained chromatids. SCE events are pointed by arrowheads. (B) Frequency of SCE per metaphase. More than 20 metaphases were scored for each experiment. Means ± SEM from three independent experiments are shown. Differences between distributions were assessed by paired t-test. (C) Representative images of anaphase bridges, lagging chromosomes and micronuclei and their quantification. More than 50 anaphases or 100 cells (for micronuclei) were scored for each experiment. Means ± SEM from at least three independent experiments are shown. Differences between distributions were assessed by the one-tailed Mann-Whitney test.
Figure 4
Figure 4. Cytometer-based assay of progression through S-phase after genotoxic stress in POLD1- and POLD3-depleted samples.
(A and C) Outline of the experimental procedure and representative images of the cell cycle profile obtained by FACS. (B) Quantification of cells that stop DNA synthesis, based on FACS profiles alike the one shown in panel A. (D) Quantification of cells that begin or restore DNA synthesis based on FACS profiles alike the one shown in panel C. More than 1000 cells were scored for each experiment. Means ± SEM from four independent experiments are shown. Differences between distributions were assessed by the Mann-Whitney test.
Figure 5
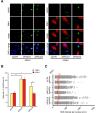
Figure 5. RNA-DNA hybrids-dependent γH2AX foci and S9.6 signal in POLD1- and POLD3-depleted cells.
(A) Immunofluorescence of HeLa cells stained with antibodies against γH2AX and RNase H1. HeLa cells were transfected with pcDNA3 (-RNH1) or pcDNA3-RNaseH1 (+RNH1) for RNase H1 overexpression. (B) Percentage of cells with more than 5 foci. More than 100 cells overexpressing RNase H1 (positive-stained) or more than 100 cells of mixed population transfected with the empty vector were counted in each experiment. Means ± SEM from at least three independent experiments are shown. Differences between distributions were assessed by the Mann-Whitney test. (C) Immunofluorescence of HeLa cells stained with antibodies against S9.6. The graph shows the median of the S9.6 signal intensity per nucleus after nucleolar signal removal in siCTR, siPOLD1 and siPOLD3 HeLa cells ± RNase H1 overexpression. More than 1000 cells from at least five independent experiments were considered, adjusting the intensity values to the average of the medians.
Figure 6
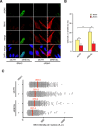
Figure 6. γH2AX foci and S9.6 signal in REV3L-depleted cells overexpressing RNase H1.
(A) Immunofluorescence of HeLa cells stained with antibodies against γH2AX and RNase H1. HeLa cells were transfected with pcDNA3 (−RNH1) or pcDNA3-RNaseH1 (+RNH1) for RNase H1 overexpression. (B) Percentage of cells with more than 5 foci. More than 100 cells overexpressing RNase H1 (positive-stained) or more than 100 cells of mixed population transfected with the empty vector were counted in each experiment. Means ± SEM from three independent experiments are shown. Differences between distributions were assessed by the one-tailed Mann-Whitney test. (C) Immunofluorescence of HeLa cells stained with antibodies against S9.6. The graph shows the median of the S9.6 signal intensity per nucleus after nucleolar signal removal in siCTR and siREV3L HeLa cells ± RNase H1 overexpression. More than 400 cells from three independent experiments were considered, adjusting the intensity values to the average of the medians.

Similar articles

Cited by

References

    1. Prindle M. J. & Loeb L. A. DNA polymerase delta in DNA replication and genome maintenance. Environ Mol Mutagen 53, 666–682 (2012). - PMC - PubMed
    1. Georgescu R. E. et al.. Reconstitution of a eukaryotic replisome reveals suppression mechanisms that define leading/lagging strand operation. Elife 4, e04988 (2015). - PMC - PubMed
    1. Nick McElhinny S. A., Gordenin D. A., Stith C. M., Burgers P. M. & Kunkel T. A. Division of labor at the eukaryotic replication fork. Mol Cell 30, 137–144 (2008). - PMC - PubMed
    1. Hubscher U., Maga G. & Spadari S. Eukaryotic DNA polymerases. Annu Rev Biochem 71, 133–163 (2002). - PubMed
    1. Lemoine F. J., Degtyareva N. P., Kokoska R. J. & Petes T. D. Reduced levels of DNA polymerase delta induce chromosome fragile site instability in yeast. Mol Cell Biol 28, 5359–5368 (2008). - PMC - PubMed

Publication types