. 2016:2016:4158698.
doi: 10.1155/2016/4158698. Epub 2016 Nov 15.

Association of Heme Oxygenase 1 with Lung Protection in Malaria-Associated ALI/ARDS

Affiliations

Association of Heme Oxygenase 1 with Lung Protection in Malaria-Associated ALI/ARDS

Marcelo L M Pereira et al. Mediators Inflamm. 2016.

Abstract

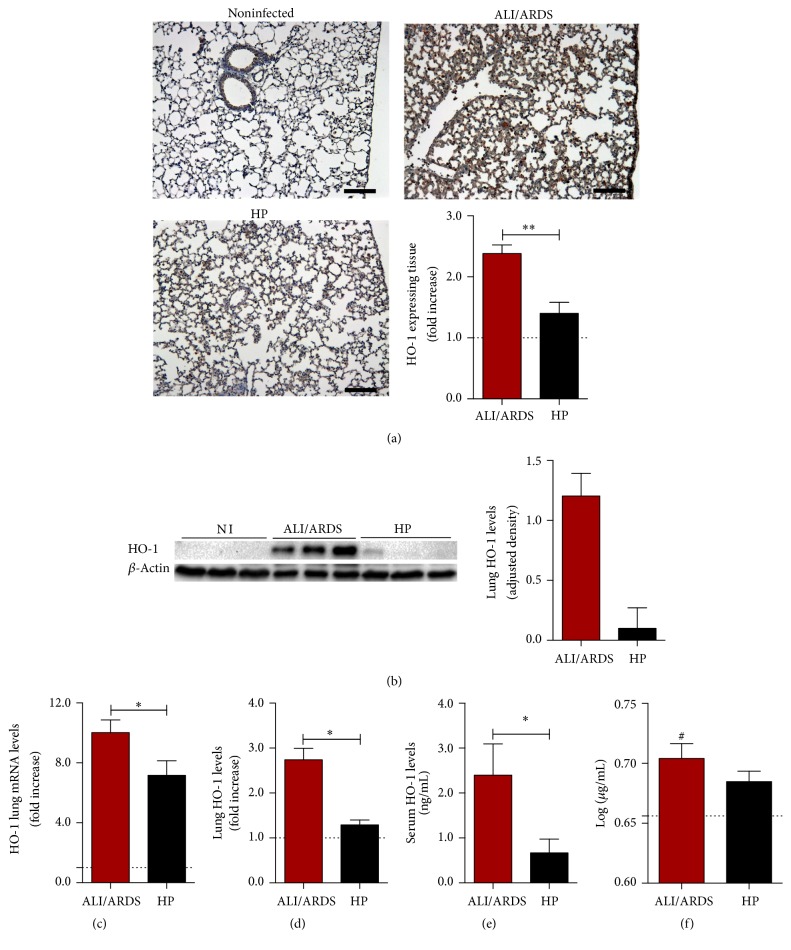
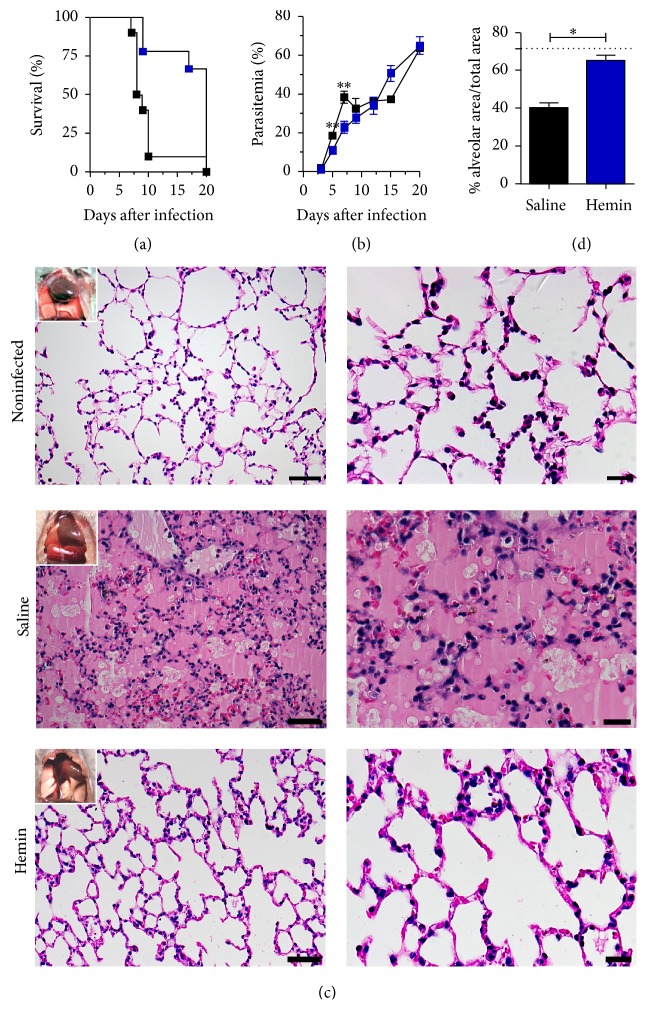
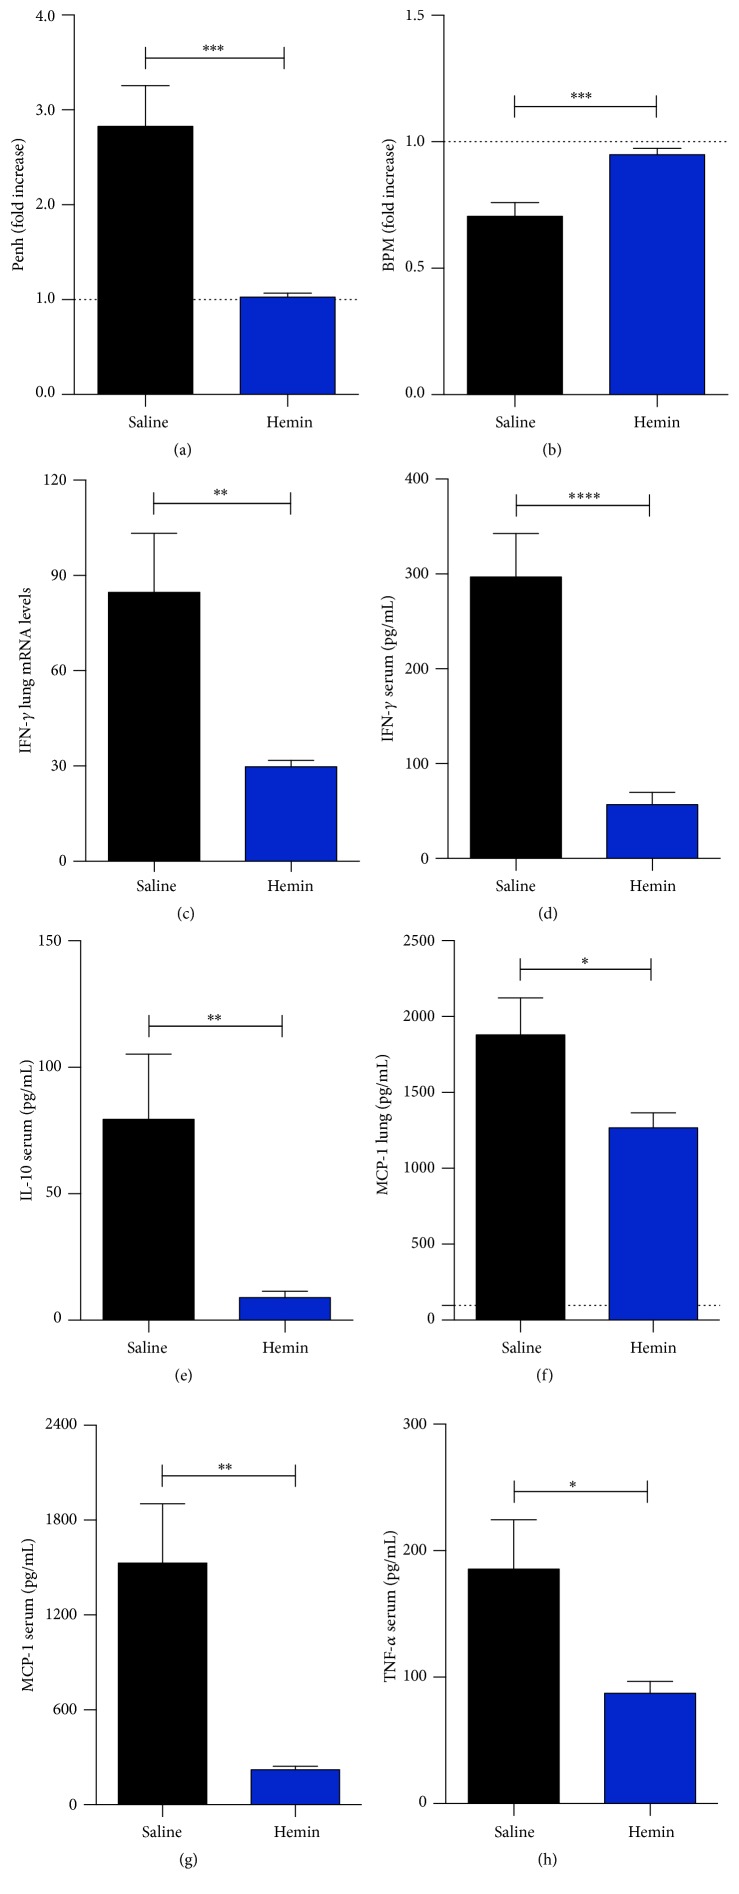
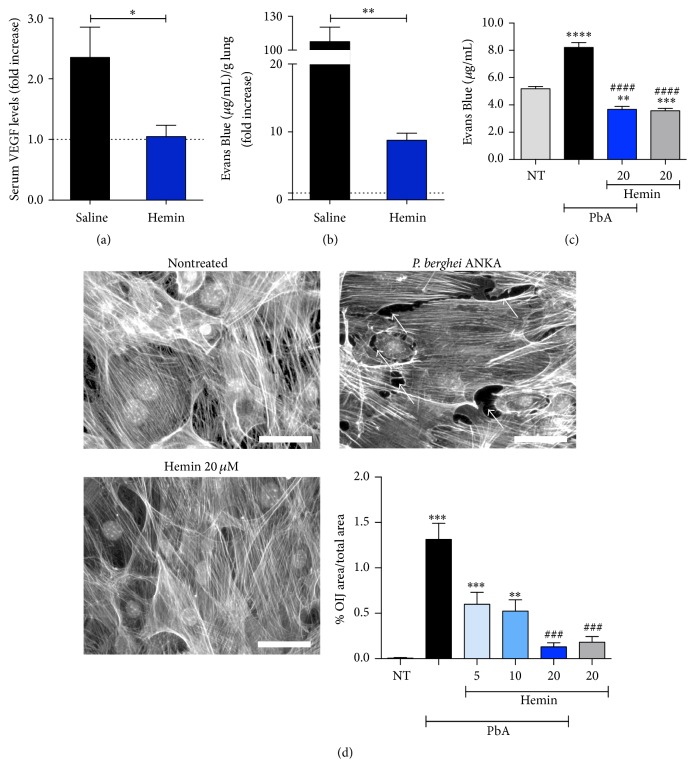
Malaria is a serious disease, caused by the parasite of the genus Plasmodium, which was responsible for 440,000 deaths in 2015. Acute lung injury/acute respiratory distress syndrome (ALI/ARDS) is one of the main clinical complications in severe malaria. The murine model DBA/2 reproduces the clinical signs of ALI/ARDS in humans, when infected with Plasmodium berghei ANKA. High levels of HO-1 were reported in cases of severe malaria. Our data indicated that the HO-1 mRNA and protein expression are increased in mice that develop malaria-associated ALI/ARDS (MA-ALI/ARDS). Additionally, the hemin, a HO-1 inducing drug, prevented mice from developing MA-ALI/ARDS when administered prior to the development of MA-ALI/ARDS in this model. Also, hemin treatment showed an amelioration of respiratory parameters in mice, high VEGF levels in the sera, and a decrease in vascular permeability in the lung, which are signs of ALI/ARDS. Therefore, the induction of HO-1 before the development of MA-ALI/ARDS could be protective. However, the increased expression of HO-1 on the onset of MA-ALI/ARDS development may represent an effort to revert the phenotype of this syndrome by the host. We therefore confirm that HO-1 inducing drugs could be used for prevention of MA-ALI/ARDS in humans.


Conflict of interest statement

The authors declare that they have no commercial or other associations that might pose competing interests.

Figures

Figure 1
Figure 1
The expression of HO-1 is higher in ALI/ARDS-developing mice compared to HP-developing mice. (a) Representative images of lung sections subject to immunohistochemistry for detection of HO-1 protein (brown), counterstained with hematoxylin. The graph represents the quantification of protein expression of HO-1 by immunohistochemistry on the 7th day after infection (DAI). Dashed line represents the average of values from noninfected mice. (Mann–Whitney test, n = 10, ∗∗ p ≤ 0.01). (b) Immunoblot of HO-1 and beta actin control (left). Protein levels of HO-1 measured by immunoblot densitometry (right). Values are expressed in HO-1 band densities adjusted by the beta actin control. (c) Expression of HO-1 mRNA levels in lungs of ALI/ARDS-developing mice and HP-developing mice (unpaired t-test, n = 28, p ≤ 0.05). (d) Values of HO-1 in lung cell lysates of ALI/ARDS versus HP-developing mice (Mann–Whitney test, n = 8, p ≤ 0.05). (e) Protein levels of HO-1 in the serum of ALI/ARDS-developing mice and HP-developing mice (Mann–Whitney test, n = 9, p ≤ 0.05). (f) Bilirubin levels in the serum of ALI/ARDS and HP infected mice. Bilirubin levels are significantly higher in ALI/ARDS than in noninfected mice (one-way ANOVA with Bonferroni's multiple comparison test n = 38, # p ≤ 0.05). The dashed lines represent the average values of noninfected mice (minimum n = 3). In graphs ((b) and (e)) the values of noninfected mice were equal or less than 0. In graphs with fold increase, the values of ALI/ARDS-developing and HP-developing mice are compared to the average values of noninfected mice.
Figure 2
Figure 2
Hemin treatment protects Plasmodium berghei-infected DBA/2 mice from ALI/ARDS. Mice were treated with hemin on days 2 and 4 after infection. (a) Parasitemias of mice treated with hemin or saline (unpaired t-test, n = 19, ∗∗ p ≤ 0.01). (b) Survival curve of mice treated with hemin or saline (log-rank test, n = 19, p ≤ 0.01). (c) Representative figures of necropsies and histological lung sections of noninfected mice (top); hemin treated mice, on the 7th day after infection (middle); and saline treated mice (bottom). Scale bars: left column: 50 μm; right column: 20 μm; (d) alveolar area percentage in hemin treated versus saline treated mice (Mann–Whitney test, n = 8, p ≤ 0.05).
Figure 3
Figure 3
Induction of HO-1 improves Plasmodium berghei-infected DBA/2 respiratory parameters and lowers inflammatory cytokines levels. Mice were treated with hemin on days 2 and 4 after infection. ((a) and (b)) Respiratory pause and respiratory frequency of the animals treated and untreated after 7th DAI (unpaired t-test, n = 20, ∗∗∗ p ≤ 0.001). (c) IFN-γ quantitative RT-PCR assay of mice lung tissue (unpaired t-test, n = 20, ∗∗ p ≤ 0.01). ((d) to (h)) Protein levels of the cytokines IFN-γ, IL-10, MCP-1, and TNF-α in the serum and lung determined by CBA (unpaired t-test, n = 20, p ≤ 0.05, ∗∗ p ≤ 0.01, and ∗∗∗∗ p ≤ 0.0001).
Figure 4
Figure 4
Induction of HO-1 defends the alveolar capillary barrier. (a) VEGF serum levels determined by ELISA (Mann–Whitney test, n = 10, p ≤ 0.05). (b) Lung endothelial permeability test (Mann–Whitney test, n = 10, ∗∗ p ≤ 0.01). (c) Permeability test of hemin treated (20 μM) and nontreated (NT) PLMC (PbA: PLMC stimulated with PbA lysate). Significant difference versus nonstimulated is represented by “” and significant difference versus extract is represented by “#” (Kruskal–Wallis test with Dunn's multiple comparisons test, n = 24, ∗∗ p ≤ 0.01, ∗∗∗ p ≤ 0.001, ∗∗∗∗ p ≤ 0.0001, and #### p ≤ 0.0001). (d) Pictures of PLMC by fluorescent microscopy (scale bars: 50 μm). Ten to twenty pictures were taken for each culture and the most representative are presented in (d) (white arrows are pointing to opening interendothelial junctions (OIJ)). The graph (bottom right) represents the ratio of the area of OIJ per total area of each picture (Kruskal–Wallis test with Dunn's multiple comparisons test, n = 74, ∗∗ p ≤ 0.01, ∗∗∗ p ≤ 0.001, and ### p ≤ 0.001). Hemin was given at 5, 10, and 20 μM.

Similar articles

Cited by

References

    1. WHO. World Malaria Report 2015. Geneva, Switzerland: World Health Organization; 2015.
    1. Centers for Disease Control and Prevention-Malaria. http://www.cdc.gov/malaria/about/disease.html.
    1. Aird W. C., Mosnier L. O., Fairhurst R. M. Plasmodium falciparum picks (on) EPCR. Blood. 2014;123(2):163–167. doi: 10.1182/blood-2013-09-521005. - DOI - PMC - PubMed
    1. Singh B., Daneshvar C. Human infections and detection of Plasmodium knowlesi . Clinical Microbiology Reviews. 2013;26(2):165–184. doi: 10.1128/cmr.00079-12. - DOI - PMC - PubMed
    1. Mohan A., Sharma S. K., Bollineni S. Acute lung injury and acute respiratory distress syndrome in malaria. Journal of Vector Borne Diseases. 2008;45(3):179–193. - PubMed

MeSH terms

LinkOut - more resources