. 2017 Apr;147(4):415-438.
doi: 10.1007/s00418-016-1515-7. Epub 2016 Dec 14.

Golgi apparatus dis- and reorganizations studied with the aid of 2-deoxy-D-glucose and visualized by 3D-electron tomography

Affiliations

Golgi apparatus dis- and reorganizations studied with the aid of 2-deoxy-D-glucose and visualized by 3D-electron tomography

Carmen Ranftler et al. Histochem Cell Biol. 2017 Apr.

Abstract

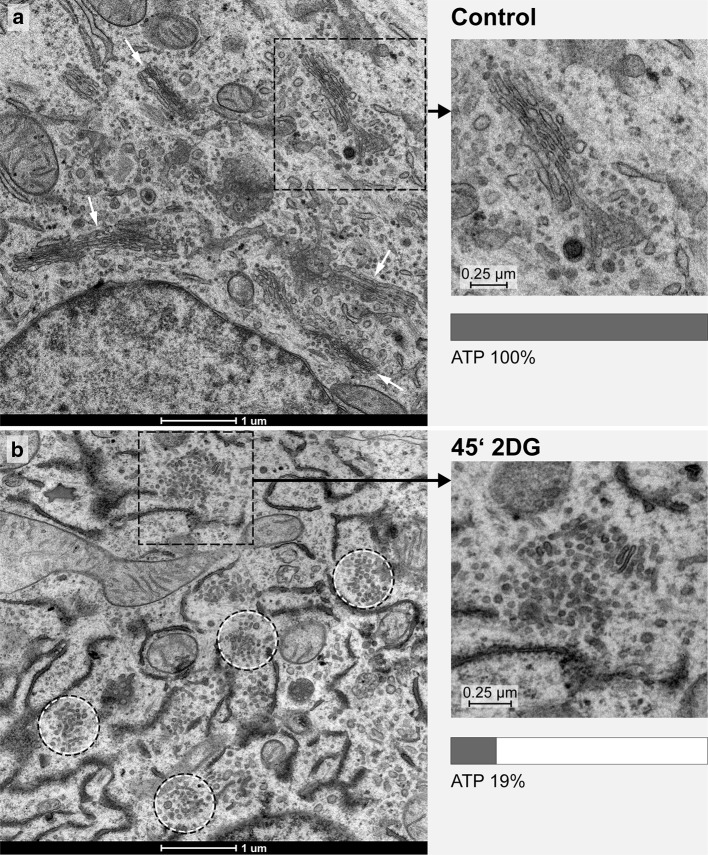
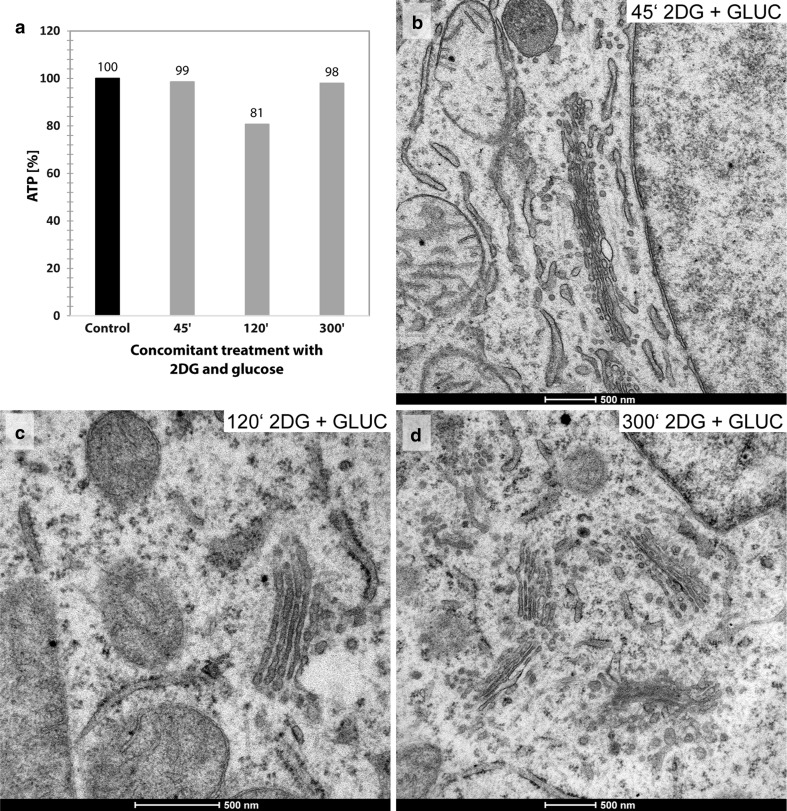
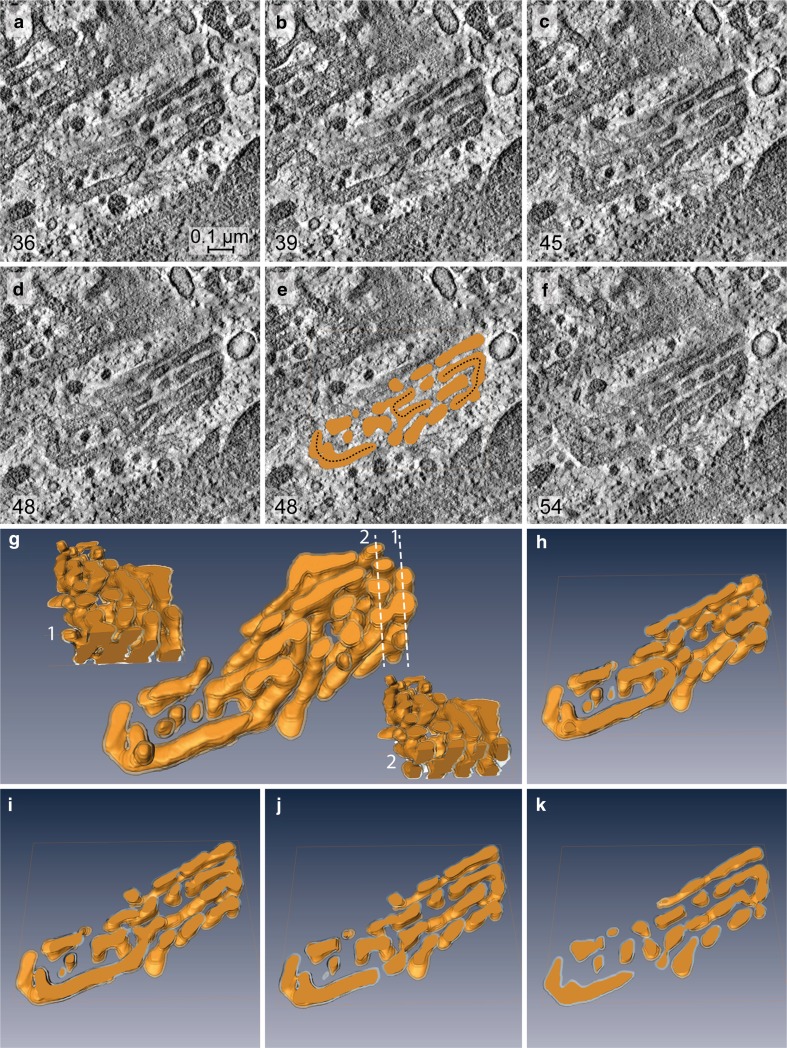
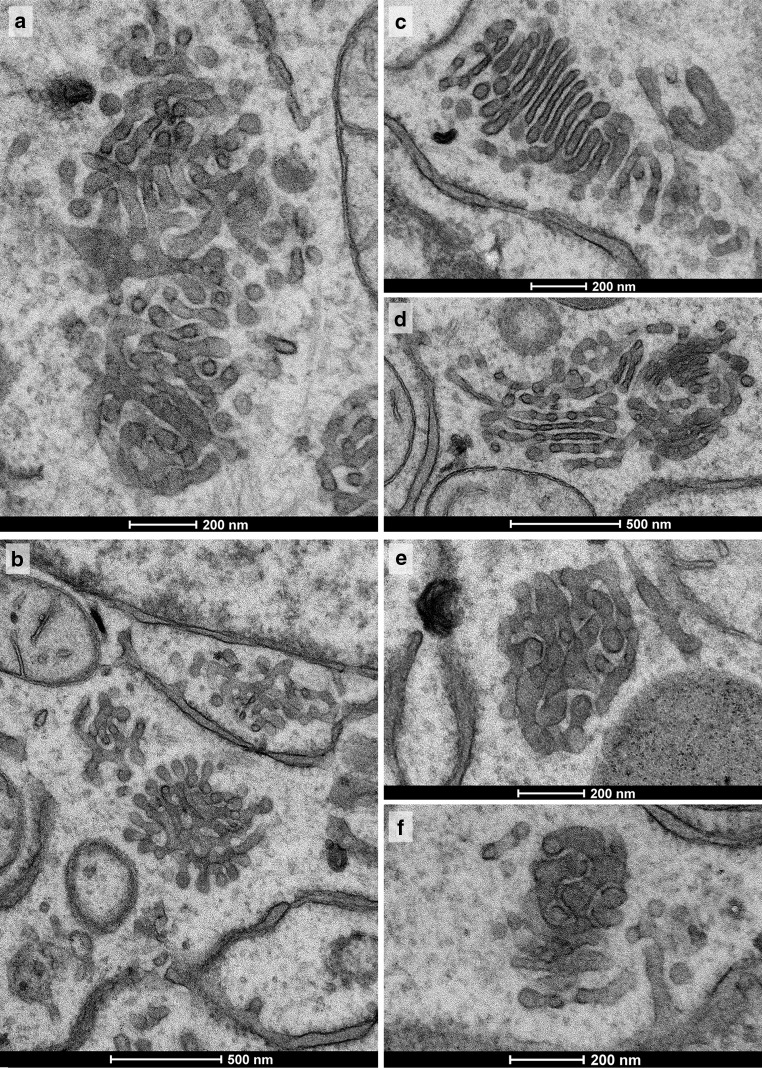
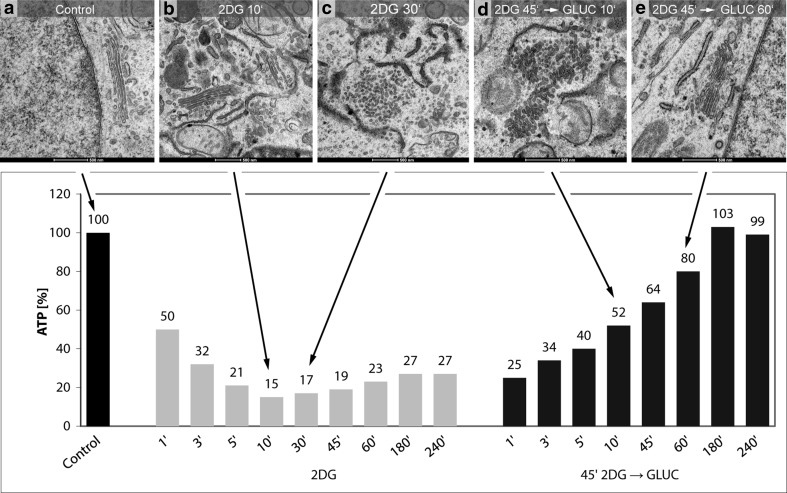
We studied Golgi apparatus disorganizations and reorganizations in human HepG2 hepatoblastoma cells by using the nonmetabolizable glucose analogue 2-deoxy-D-glucose (2DG) and analyzing the changes in Golgi stack architectures by 3D-electron tomography. Golgi stacks remodel in response to 2DG-treatment and are replaced by tubulo-glomerular Golgi bodies, from which mini-Golgi stacks emerge again after removal of 2DG. The Golgi stack changes correlate with the measured ATP-values. Our findings indicate that the classic Golgi stack architecture is impeded, while cells are under the influence of 2DG at constantly low ATP-levels, but the Golgi apparatus is maintained in forms of the Golgi bodies and Golgi stacks can be rebuilt as soon as 2DG is removed. The 3D-electron microscopic results highlight connecting regions that interlink membrane compartments in all phases of Golgi stack reorganizations and show that the compact Golgi bodies mainly consist of continuous intertwined tubules. Connections and continuities point to possible new transport pathways that could substitute for other modes of traffic. The changing architectures visualized in this work reflect Golgi stack dynamics that may be essential for basic cell physiologic and pathologic processes and help to learn, how cells respond to conditions of stress.

Keywords: 2-Deoxy-D-glucose (2DG); 3D-electron tomography; Golgi apparatus; Golgi dynamics.


Conflict of interest statement

The authors declare that they have no conflict of interest.

Figures

Fig. 1
Fig. 1
Ultrastructures of the Golgi apparatus in HepG2 hepatoma cells, high-pressure frozen, freeze substituted and embedded in Epon, are shown on thin sections of a control cell (a, inset) and after 45 min of treatment with 2DG (b, inset). In the control cell (a), several regular stacks of cisternae in parallel organization are apparent (white arrows); in the 2DG-treated cell (b), regular Golgi stacks are missing and instead Golgi bodies composed of irregular and loosely organized membranous compartments dominate (circles). In both panels, areas marked by a rectangle are shown in the inset at higher magnification and respective ATP-values are indicated. In all pictures, RER-cisternae are found close to the Golgi stacks and Golgi bodies; the RER luminal contents appear denser in the 2DG-treated cells (b) than in the controls (a)
Fig. 2
Fig. 2
Tomographic slices and three-dimensional models of a control cell Golgi apparatus stack in a and b, and a Golgi body of a cell treated with 2DG for 45 min in c are shown. In both cases, the cell cultures were high-pressure frozen, freeze substituted and embedded in Epon. In contrast to the parallel organization of the cisternae that build up a Golgi stack in the control cell (b), the 2DG-treated cell shows various, in part tubular, cisternal and small vesicular compartments, that form a loosely arranged Golgi body (c). Branched and bifurcated structures (white arrows) are common. Volumes of the calculated tomograms (x, y, z): a, b 3.535 × 2.919 × 205 pixels, pixel size 0,59 nm; c 4.073 × 3.943 × 140 pixels, pixel size 0,46 nm. d The percentage ATP-values after 45 min and 5 h of treatment of HepG2 cell cultures with 2DG of different, 10, 25 and 50 mM, concentrations. The graphic shows that a massive reduction of the ATP-levels is obtained with each of the 2DG-concentrations tested. The data shown are taken from one representative experiment; comparable results were obtained in repeated experiments
Fig. 3
Fig. 3
a, b Percentage ATP-values are shown as obtained after different times of culture in either glucose-pyruvate-free medium (GPF) containing 50 mM 2DG or in GPF lacking 2DG, respectively. The curve of declining ATP-values in a indicates that the main ATP-reduction occurs within the first 10 min of treatment. By contrast to the considerably reduced ATP-levels measured in the 2DG-treated cell cultures, the results obtained with the cultures grown in GPF without 2DG show ATP-values comparable to the controls or slightly reduced at the later times of treatment. The data are taken from one representative experiment; repeated experiments yielded comparable results. c, d The Golgi apparatus morphologies of cells cultured for 10, 30 and 180 min in GPF with or without 2DG, respectively; the respective ATP-values are additionally indicated in the right upper corner of the pictures. c Alterations of the Golgi apparatus stack are hardly visible after 10 min of 2DG-treatment; the stack appears disorganized and in part changed in a loosely arranged Golgi body after 30 min; a Golgi body composed of densely packed membrane compartments is seen after 180 min of treatment. d By contrast, cells cultured in GPF without 2DG show unchanged Golgi apparatus stacks comparable to those of control cells. In all pictures, RER-cisternae are found nearby the Golgi stacks exhibiting denser contents in the 2DG-treated cells (c) than in those cultured without 2DG
Fig. 4
Fig. 4
a Unchanged cellular percentage ATP-levels after 45, 120 and 300 min of concomitant treatment of the HepG2 cell cultures with 2DG (50 mM) and d-glucose (50 mM) indicating that the ATP-lowering effect of 2DG is inhibited. The likewise unchanged morphologies of the Golgi apparatus stacks, as they are found after 45, 120 and 300 min of concomitant treatment with 2DG and d-glucose, are shown in b, c and d
Fig. 5
Fig. 5
af Tomographic slices obtained from different levels of a Golgi stack reconstruction after 10 min of 2DG-treatment; the respective 3D-model is on display in gk. Both the slices and the model, in part sectioned vertically (g1 and g2) and horizontally (hk), provide views inside the stack. The image shows that a parallel organization of cisternae still exists but is interrupted by arches, branches and wide pores resulting in the occurrence of reticular regions within the stack. Regularly ordered cisternae and reticular areas are located side by side, as is particularly clearly shown in g. In e, slice 48 is shown together with the respective horizontal section through the model, and the connecting arches present within the stack are accentuated by dotted lines. The numbers in the left lower corner of af indicate the respective slice numbers within the reconstructed stack. Volume of the calculated tomogram (x, y, z): 989 × 976 × 61 pixels, pixel size 1.84 nm
Fig. 6
Fig. 6
Tomographic slices in ad obtained from different levels of a Golgi apparatus reconstruction at 15 min of 2DG-treatment show that different sites within a stack are interlinked by crossroads-like junctions, accompanied by frequent bifurcations. A representative area is on display in a, b and d and is further accentuated by means of drawings and by numbering some of the cisternae (c, eg). Two different sites within the stack are labeled in red and blue and their spatial relationship traced within the reconstructed volume. The colored regions are found apart from each other in slice 200 (a, e); in slices 131 and 142, they can be seen joined forming parts of a crossroads-like junction (b, c, f), and they are separated again in slice 80 (d, g). The numbers in the left lower corner of a-d indicate the respective numbers of the slices. Volume of the calculated tomogram (x, y, z): 3.585 × 3.604 × 242 pixels, pixel size 0.39 nm
Fig. 7
Fig. 7
Percentage ATP-values after different short- and long-time 2DG-treatments are shown. The data are taken from two representative experiments and show that the ATP-concentrations are persistently depressed throughout the entire times of the experiments. The electron micrograph shows parts of the cytoplasm of a HepG2 cell treated with 2DG for 5 h. Regular Golgi apparatus stacks are lacking; instead, Golgi bodies with densely packed membrane compartments dominate closely adjacent to cisternae of the RER filled with electron dense contents
Fig. 8
Fig. 8
Panels depict various views of 3D-models of compact Golgi bodies (numbered 1, 2 and 3) after 60 min of 2DG-treatment. b, h Indicate the close relationship to the ER (colored in green); an ER-bud protruding into the body is shown in panel h. All 3 bodies are similarly composed of convoluted tubules, the loops of which can be identified in the models and are particularly well visible in the sections through the models, exhibited in df and jl. The differentiated coloring of bodies 2 and 3 in c and i points to the connected parts of the bodies, the largest being highlighted in yellow. As seen in i, body 3 is almost completely composed of one continuous compartment. The numbers in the left lower corner of df and jl indicate the respective positions of the sections through the model. Volumes of the calculated tomograms (x, y, z): af 4.004 × 3.892 × 310 pixels, pixel size 0,39 nm; gl 3.977 × 3.887 × 370 pixels; pixel size 0.39 nm
Fig. 9
Fig. 9
a Rising cellular ATP-levels at different times ranging from 1 to 240 min after removal of 2DG and incubation in a 50 mM glucose- and 1% pyruvate-containing DMEM. b The respective ATP-values obtained after 2DG-removal and incubation of the cells in glucose-pyruvate-free medium (GPF). A comparison of the diagrams in panels a and b makes it clear that ATP-replenishment also takes place without addition of glucose but is delayed. The pictures in c, d show the Golgi apparatus morphologies 10, 30 and 45 min after 2DG-removal and incubation in either glucose-containing or glucose-free medium, respectively. With either protocol, an increased regularity of the membranes and short cisternae in parallel orientation can be seen within the Golgi bodies as early as after 10 min. Mini-stacks are formed that are particularly well visible in the rightmost picture of d
Fig. 10
Fig. 10
All panels show Golgi apparatus bodies after 2DG-removal following a 45 min treatment time and a 30 min subsequent incubation in GPF. Various types of Golgi bodies are on display, as they also may reside in cells side by side. The bodies shown in a, b are of tubular-reticular character; e, f particularly compact glomerular Golgi bodies with densely packed membranes, and c and d initial stack formations. c Multi-cisternal mini-stack, as is characteristic for this recovery period. The cisternae are conspicuously short, lack pores and are in a ladder-like arrangement. A combined body is shown in d consisting of a compact part with densely packed membranes on the right-hand side; in the stack on the left-hand side, pores can be seen and pairs of cisternae appear connected at their rims. Narrow, particularly regular inter-membrane spaces are apparent in the compact body shown in f
Fig. 11
Fig. 11
ai and jm Tomographic slices and pictures of the respective 3D-model of a re-forming Golgi stack located within a compact Golgi body. The investigated cells are obtained from a culture after removal of 2DG following 45 min of 2DG treatment and subsequent incubation in a glucose-pyruvate-free medium for 45 min. The body consists of a tubulo-glomerular and a cisternal part (in e highlighted by a dotted line and termed gl and ci, respectively). Almost all of the short cisternae of the mini-stack emerge from the tubulo-glomerular part of the body and are connected among each other via wide hanger-like arches in part extending from one to the other side of the stack. In the series of slices (ad, fi) and sections through the model (jm) some of the cisternae are accentuated by colors to be able to follow up their extensions throughout the body more easily. Volume of the calculated tomogram (x, y, z): 3.223 × 2.847 × 200 pixels, pixel size 0.39 nm
Fig. 12
Fig. 12
Artwork shows the results of correlative ATP-analyses and ultrastructural analyses highlighting the ATP-levels and the corresponding Golgi apparatus morphologies at 10 and 30 min of 2DG-treatment and 10 and 60 min after 2DG-removal and incubation in glucose-containing medium. a Regularly structured Golgi apparatus stack of a control cell. The results shown in b and c make evident that the processes leading to a replacement of the regular Golgi stacks by Golgi bodies occurs in a phase of low cellular ATP-concentrations. d The occurrence of mini-stacks within the Golgi bodies, indicating the beginning of Golgi apparatus re-formation, coincides with the ATP-level increase after removal of 2DG. The picture in panel e exhibits a control-like regularly structured Golgi stack after ATP-replenishment
Fig. 13
Fig. 13
Summary of the dynamics of a Golgi apparatus stack during ATP-decrease in response to 2DG-application, upon constantly low ATP-levels during continued 2DG-treatment, and during ATP-replenishment after 2DG-removal

Similar articles

Cited by

References

    1. Aden DP, Fogel A, Plotkin S, Damjanov I, Knowles BB. Controlled synthesis of HBsAg in a differentiated human liver carcinoma-derived cell line. Nature. 1979;282:615–616. doi: 10.1038/282615a0. - DOI - PubMed
    1. Aft RL, Zhang FW, Gius D. Evaluation of 2-deoxy-d-glucose as a chemotherapeutic agent: mechanism of cell death. Br J Cancer. 2002;87:805–812. doi: 10.1038/sj.bjc.6600547. - DOI - PMC - PubMed
    1. Ahadova A, Gebert J, von Knebel Doeberitz M, Kopitz J, Kloor M. Dose-dependent effect of 2-deoxy-d-glucose on glycoprotein mannosylation in cancer cells. IUBMB Life. 2015;67:218–226. doi: 10.1002/iub.1364. - DOI - PubMed
    1. Berger EG (1997) The Golgi apparatus: from discovery to contemporary studies. In: Berger EG, Roth J (eds) The Golgi apparatus. Birkhäuser Verlag, Basel, pp 1–35. doi:10.1007/978-3-0348-8876-9_1
    1. Bergmann M, Schotte H, Lechinsky W. Über die ungesättigten Reduktionsprodukte der Zuckerarten und ihre Umwandlungen, III.: Über 2-desoxyglucose (Glucodesose) Ber Dtsch Chem Ges. 1922;55:158–172. doi: 10.1002/cber.19220550122. - DOI

MeSH terms

LinkOut - more resources