

Ageing and brain white matter structure in 3,513 UK Biobank participants
- PMID: 27976682
- PMCID: PMC5172385
- DOI: 10.1038/ncomms13629
Ageing and brain white matter structure in 3,513 UK Biobank participants
Abstract
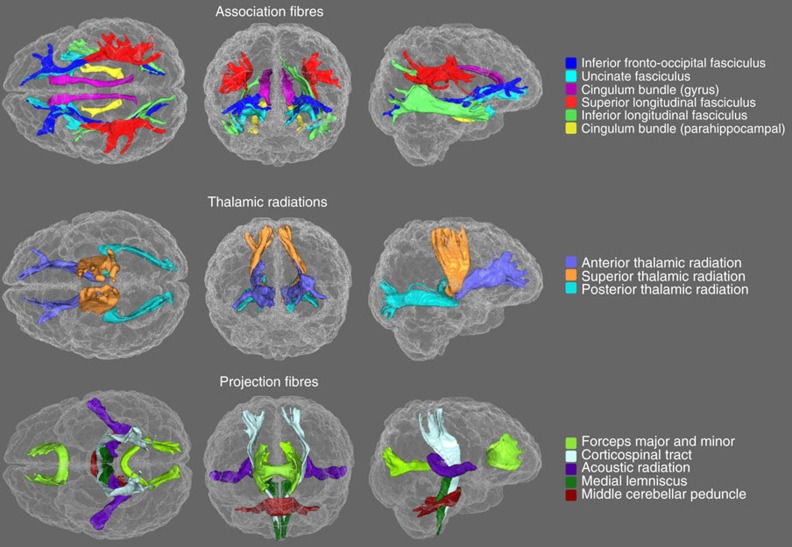
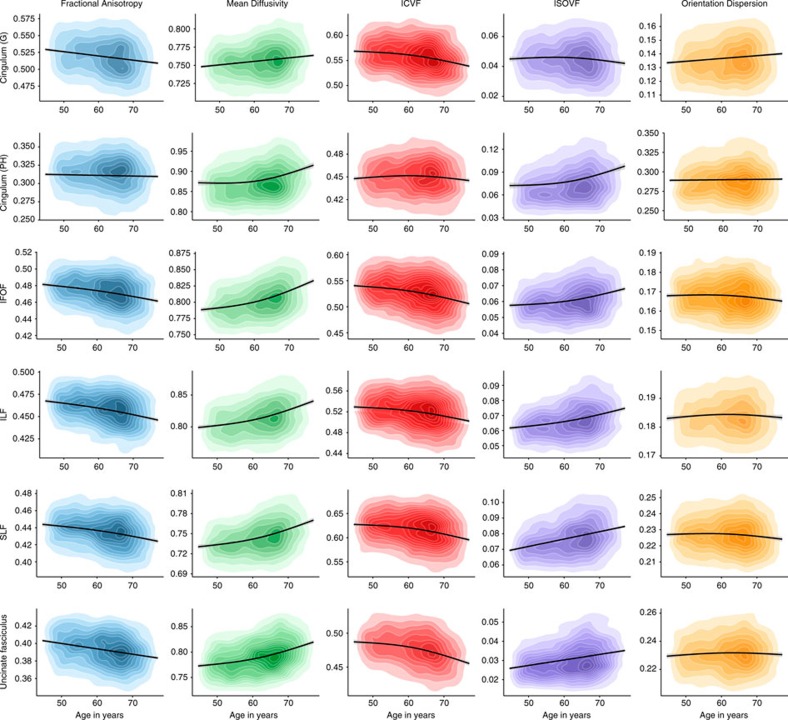
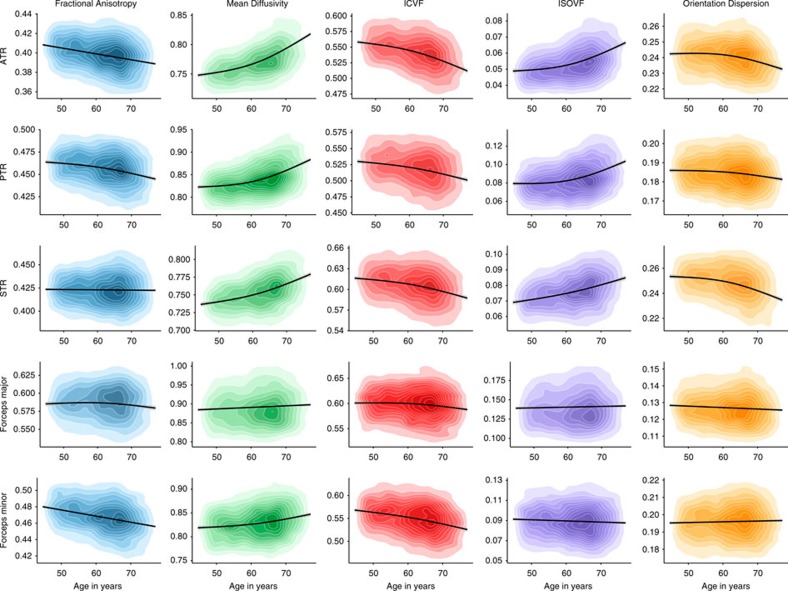
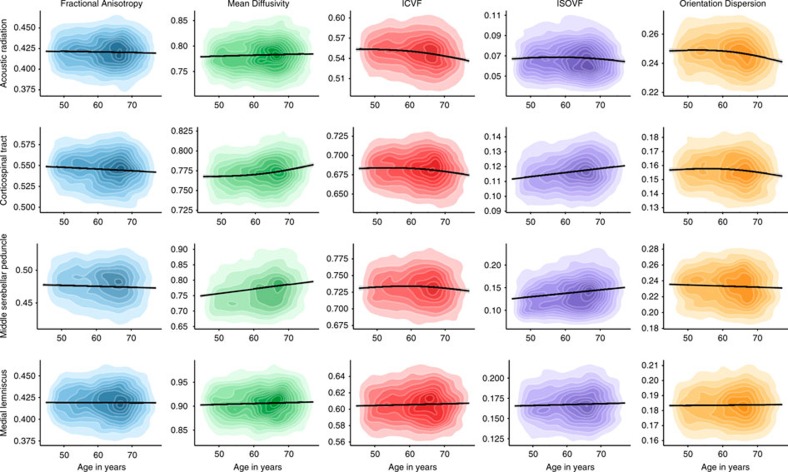
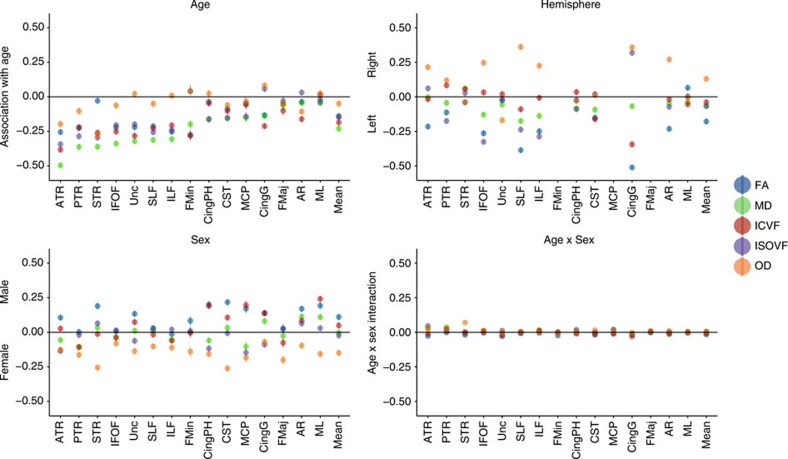
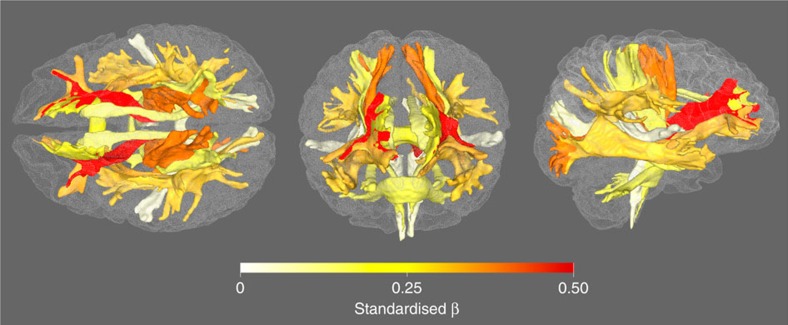
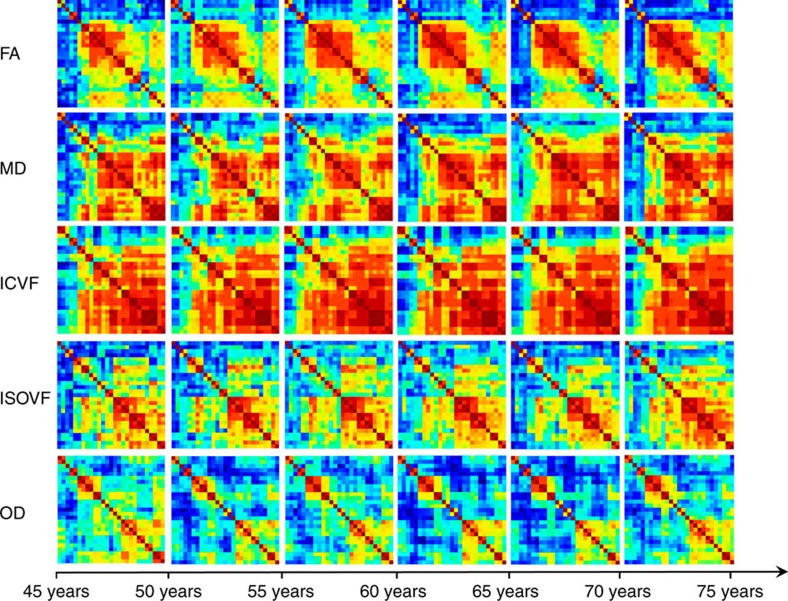
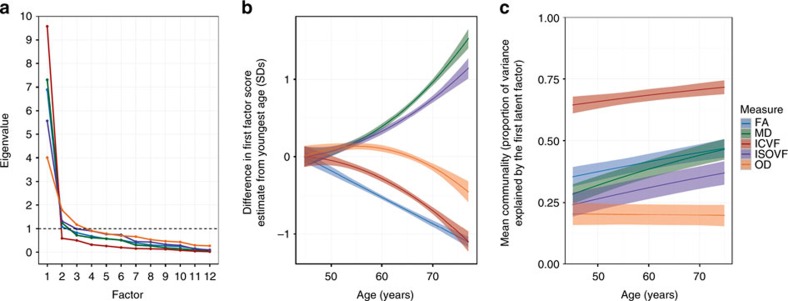
Quantifying the microstructural properties of the human brain's connections is necessary for understanding normal ageing and disease. Here we examine brain white matter magnetic resonance imaging (MRI) data in 3,513 generally healthy people aged 44.64-77.12 years from the UK Biobank. Using conventional water diffusion measures and newer, rarely studied indices from neurite orientation dispersion and density imaging, we document large age associations with white matter microstructure. Mean diffusivity is the most age-sensitive measure, with negative age associations strongest in the thalamic radiation and association fibres. White matter microstructure across brain tracts becomes increasingly correlated in older age. This may reflect an age-related aggregation of systemic detrimental effects. We report several other novel results, including age associations with hemisphere and sex, and comparative volumetric MRI analyses. Results from this unusually large, single-scanner sample provide one of the most extensive characterizations of age associations with major white matter tracts in the human brain.
Figures
References
-
- O'Sullivan M. et al.. Evidence for cortical ‘disconnection' as a mechanism of age-related cognitive decline. Neurology 57, 632–638 (2001). - PubMed
-
- Bartzokis G. et al.. Heterogeneous age-related breakdown of white matter structural integrity: implications for cortical ‘disconnection' in aging and Alzheimer's disease. Neurobiol. Aging 25, 843–851 (2004). - PubMed
-
- Geschwind N. Disconnexion syndromes in animals and man. I. Brain 88, 237–294 (1965). - PubMed
-
- Jones D. K., Knösche T. R. & Turner R. White matter integrity, fiber count, and other fallacies: the do's and don'ts of diffusion MRI. NeuroImage 73, 239–254 (2013). - PubMed
Publication types
MeSH terms
Grants and funding
- MC_UP_A620_1015/MRC_/Medical Research Council/United Kingdom
- MC_U147585827/MRC_/Medical Research Council/United Kingdom
- MC_U147574232/MRC_/Medical Research Council/United Kingdom
- MC_QA137853/MRC_/Medical Research Council/United Kingdom
- P2C HD042849/HD/NICHD NIH HHS/United States
- MR/K026992/1/MRC_/Medical Research Council/United Kingdom
- MC_UP_A620_1014/MRC_/Medical Research Council/United Kingdom
- MC_UU_12011/1/MRC_/Medical Research Council/United Kingdom
- R21 AA023322/AA/NIAAA NIH HHS/United States
- G0400491/MRC_/Medical Research Council/United Kingdom
- MC_U147585824/MRC_/Medical Research Council/United Kingdom
- MC_UU_12011/2/MRC_/Medical Research Council/United Kingdom
- R21 HD081437/HD/NICHD NIH HHS/United States
- MR/M013111/1/MRC_/Medical Research Council/United Kingdom
- MC_U147585819/MRC_/Medical Research Council/United Kingdom
- R01 HD083613/HD/NICHD NIH HHS/United States
- R24 HD042849/HD/NICHD NIH HHS/United States
LinkOut - more resources
Full Text Sources
Other Literature Sources
Medical
