

Arabidopsis myrosinases link the glucosinolate-myrosinase system and the cuticle
- PMID: 27976683
- PMCID: PMC5157024
- DOI: 10.1038/srep38990
Arabidopsis myrosinases link the glucosinolate-myrosinase system and the cuticle
Abstract
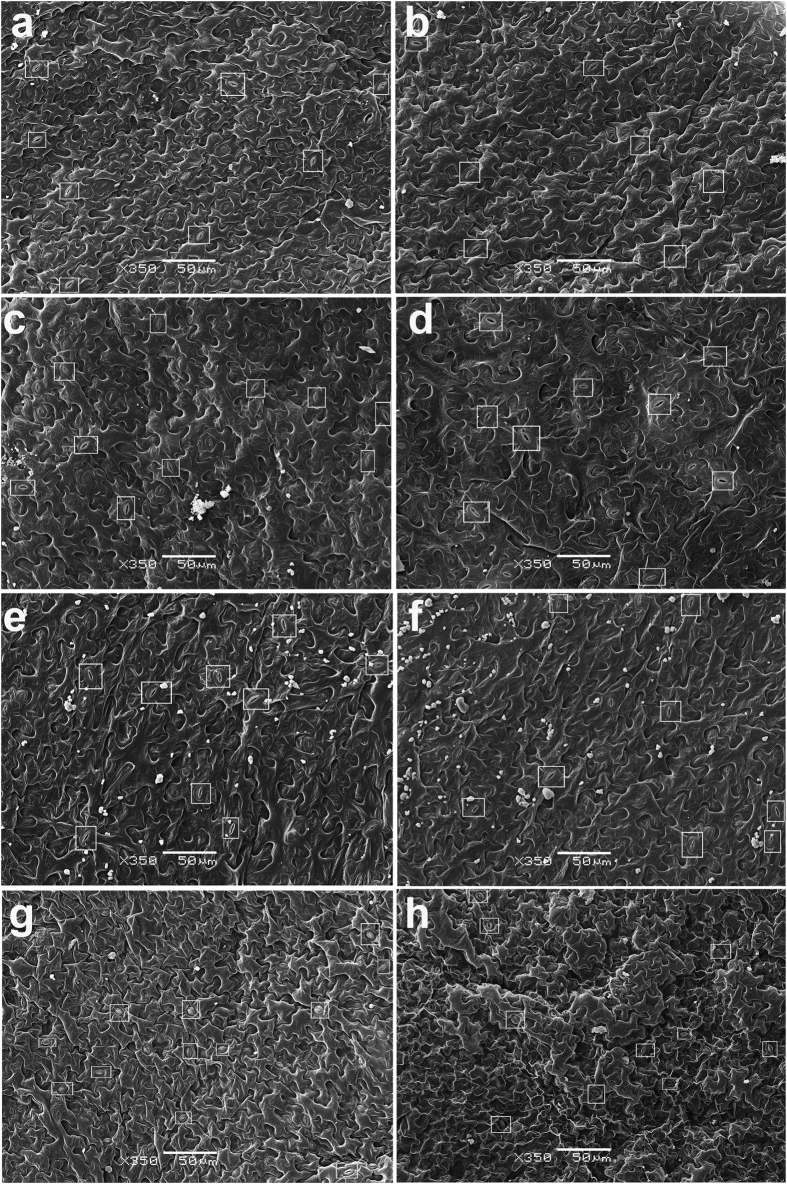
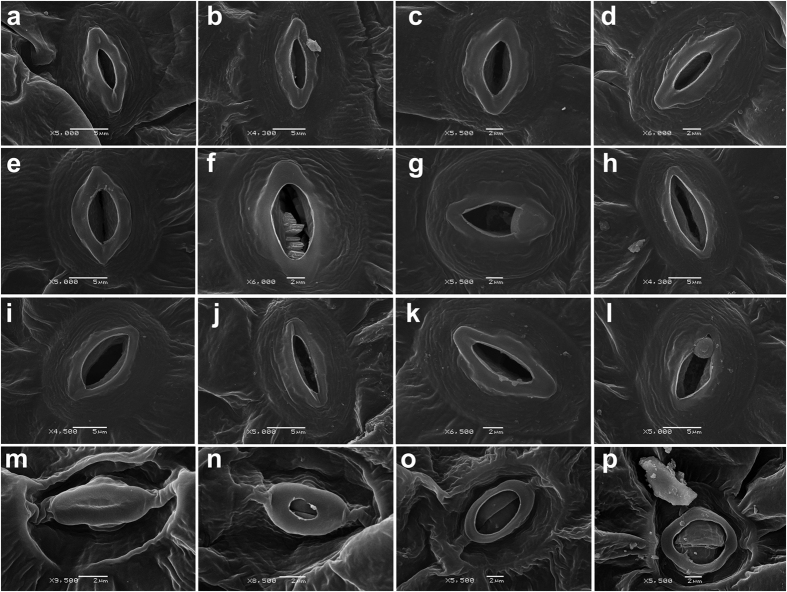
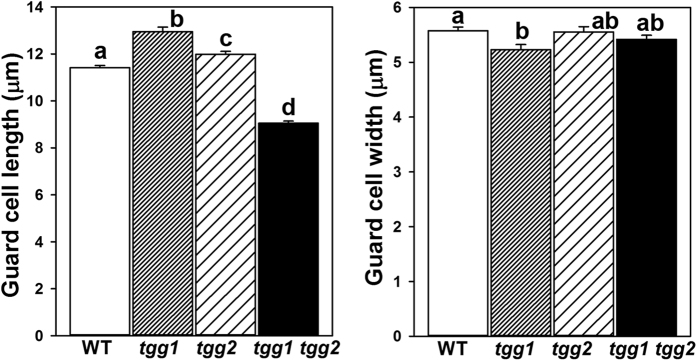
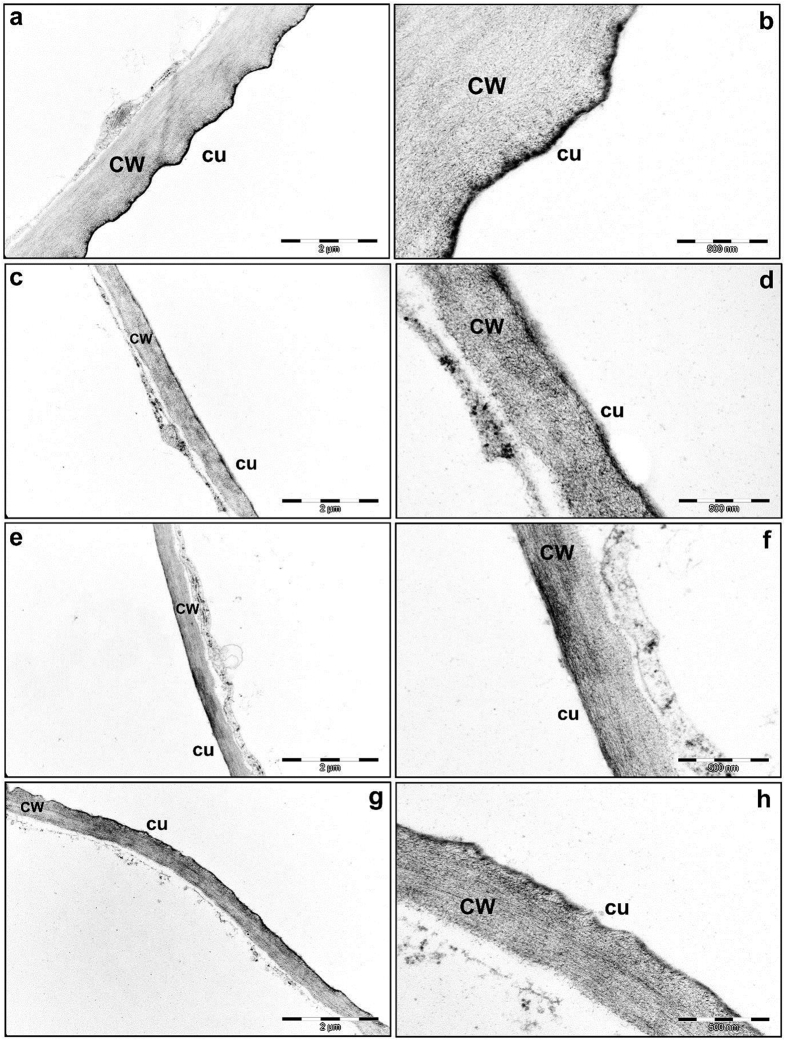
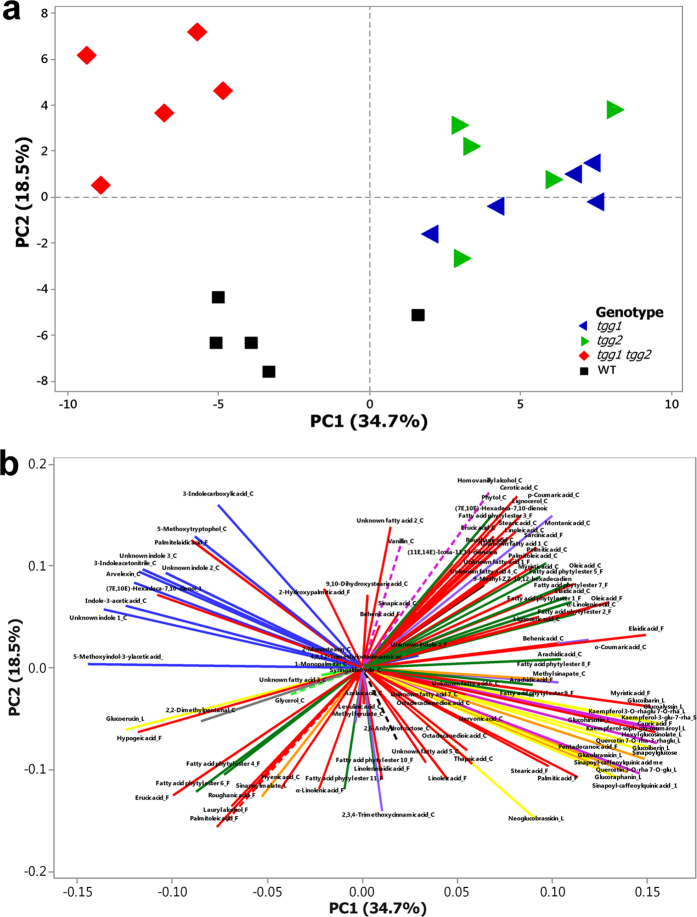
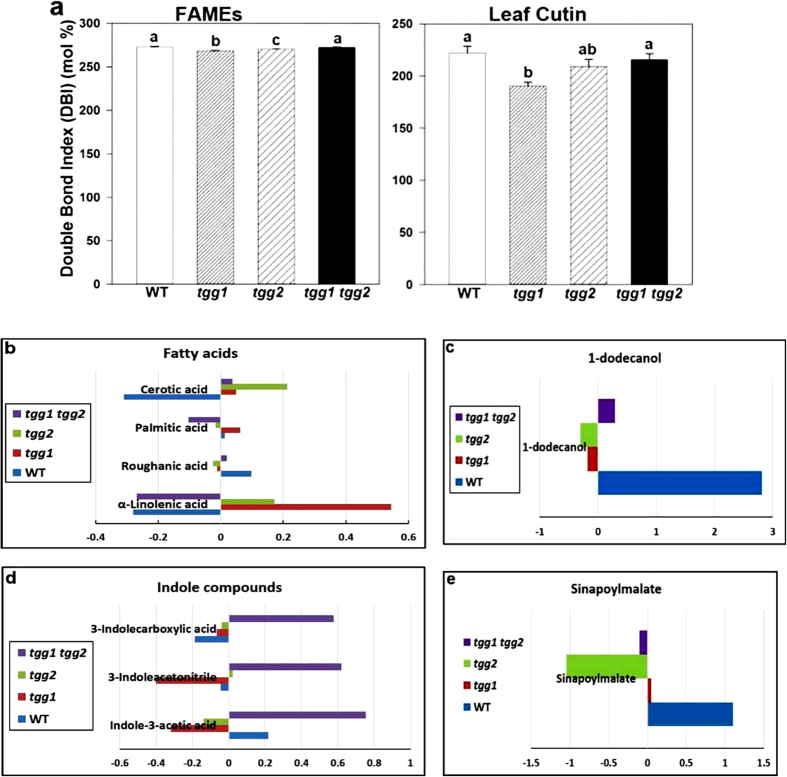
Both physical barriers and reactive phytochemicals represent two important components of a plant's defence system against environmental stress. However, these two defence systems have generally been studied independently. Here, we have taken an exclusive opportunity to investigate the connection between a chemical-based plant defence system, represented by the glucosinolate-myrosinase system, and a physical barrier, represented by the cuticle, using Arabidopsis myrosinase (thioglucosidase; TGG) mutants. The tgg1, single and tgg1 tgg2 double mutants showed morphological changes compared to wild-type plants visible as changes in pavement cells, stomatal cells and the ultrastructure of the cuticle. Extensive metabolite analyses of leaves from tgg mutants and wild-type Arabidopsis plants showed altered levels of cuticular fatty acids, fatty acid phytyl esters, glucosinolates, and indole compounds in tgg single and double mutants as compared to wild-type plants. These results point to a close and novel association between chemical defence systems and physical defence barriers.
Figures
 glucosinolates;
  sinapoyl esters;
  fatty alcohol;
  fatty acid ester;
  FAs;
FAs;  monoglycerides;
  phenolics;
  flavonol glycosides;
  hydroxycinnamic acids;
  indole compounds;
  diterpene alcohol;
  fatty acid phytyl esters;
  polyols;
  aldehydes;
  carbohydrate.
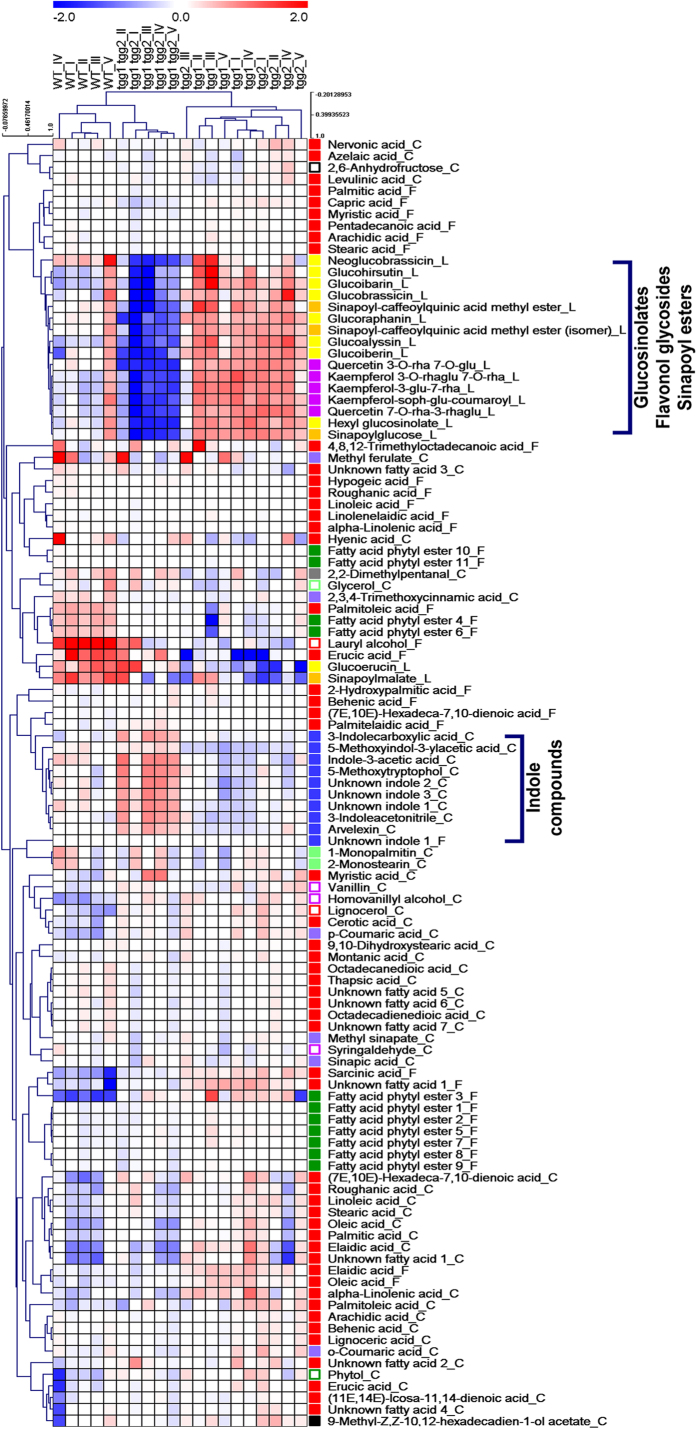
 glucosinolates;
  sinapoyl esters;
  fatty alcohol;
  fatty acid ester;
  FAs;
FAs;  monoglycerides;
  phenolics;
  flavonol glycosides;
  hydroxycinnamic acids;
  indole compounds;
  diterpene alcohol;
  fatty acid phytyl esters;
  polyols;
  aldehydes;
  carbohydrate.
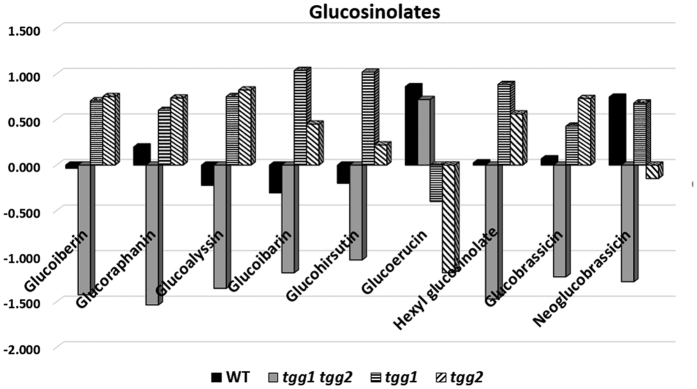
References
-
- Ahuja I., de Vos R. C. H., Bones A. M. & Hall R. D. Plant molecular stress responses face climate change. Trends in Plant Science 15, 664–674 (2010). - PubMed
-
- Ahuja I., Kissen R. & Bones A. M. Phytoalexins in defense against pathogens. Trends in Plant Science 17, 73–90 (2012). - PubMed
-
- Bones A. M. & Rossiter J. T. The myrosinase-glucosinolate system, its organisation and biochemistry. Physiologia Plantarum 97, 194–208 (1996).
-
- Islam M. M. et al.. Myrosinases, TGG1 and TGG2, redundantly function in ABA and MeJA signaling in Arabidopsis guard cells. Plant Cell Physiol. 50, 1171–1175 (2009). - PubMed
Publication types
MeSH terms
Substances
LinkOut - more resources
Full Text Sources
Other Literature Sources
