. 2016 Dec 15:6:38923.
doi: 10.1038/srep38923.

Disentangling the influence of earthworms in sugarcane rhizosphere

Affiliations

Disentangling the influence of earthworms in sugarcane rhizosphere

Lucas P P Braga et al. Sci Rep. .

Abstract

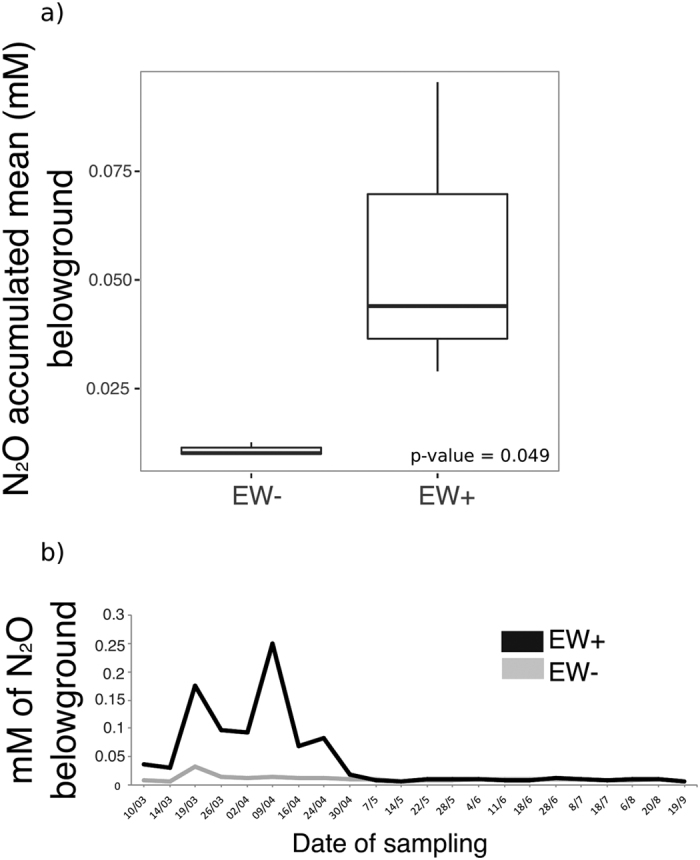
For the last 150 years many studies have shown the importance of earthworms for plant growth, but the exact mechanisms involved in the process are still poorly understood. Many important functions required for plant growth can be performed by soil microbes in the rhizosphere. To investigate earthworm influence on the rhizosphere microbial community, we performed a macrocosm experiment with and without Pontoscolex corethrurus (EW+ and EW-, respectively) and followed various soil and rhizosphere processes for 217 days with sugarcane. In EW+ treatments, N2O concentrations belowground (15 cm depth) and relative abundances of nitrous oxide genes (nosZ) were higher in bulk soil and rhizosphere, suggesting that soil microbes were able to consume earthworm-induced N2O. Shotgun sequencing (total DNA) revealed that around 70 microbial functions in bulk soil and rhizosphere differed between EW+ and EW- treatments. Overall, genes indicative of biosynthetic pathways and cell proliferation processes were enriched in EW+ treatments, suggesting a positive influence of worms. In EW+ rhizosphere, functions associated with plant-microbe symbiosis were enriched relative to EW- rhizosphere. Ecological networks inferred from the datasets revealed decreased niche diversification and increased keystone functions as an earthworm-derived effect. Plant biomass was improved in EW+ and worm population proliferated.


Figures

Figure 1
Figure 1. Plant and soil parameters determined after 217 days of greenhouse experiment.
Panel (a) indicates plant total biomass (Levene’s test, F > 0.05; Shapiro-Wilk’s test, p > 0.05; t-test, p-value = 0.01). Panel (b) indicates levels of silicon (Si) determined in bulk soil soil samples at the end of the experiment (Levene’s test, F > 0.05; Shapiro-Wilk’s test, p > 0.05; t-test, p-value = 0.11). Panel (c) indicates levels of total soil nitrogen (N) determined at the end of the experiment (Levene’s test, F > 0.05; Shapiro-Wilk’s test, p > 0.05; t-test, p-value = 0.28). Panel (c) indicates the levels of total soil organic carbon (OC) determined at the end of the experiment (Levene’s test, F > 0.05; Shapiro-Wilk’s test, p < 0.05; Kruskal-Wallis, p-value = 0.63). Empty boxes represent the values obtained in the pots without earthworms (EW−) and filled boxes represent the values obtained in the pots with earthworms (EW+).
Figure 2
Figure 2. N2O concentration belowground (15 cm depth) monitored along the experiment.
Panel (a) indicates the accumulated mean of N2O concentrations in pots with earthworm (EW+) and without earthworms (EW−) (Levene’s test, F > 0.05; Shapiro-Wilk’s test, p < 0.05; Kruskal-Wallis, p-value = 0.04). Panel (b) indicates 22 values (x-axis) of N2O means collected along the experiment (217 days) according to the date of sampling. The black line represents the values obtained in the pots with earthworms (EW+), and the gray line represents the values obtained in the pots without earthworms (EW−).
Figure 3
Figure 3. CO2 concentration belowground (15 cm depth) monitored along the experiment.
Panel (a) indicates the accumulated mean of CO2 concentrations in pots with earthworm (EW+) and without earthworms (EW−) (Levene’s test, F > 0.05; Shapiro-Wilk’s test, p > 0.05; t-test, p-value = 0.25). Panel (b) indicates 22 values (x-axis) of CO2 means collected along the experiment (217 days) according to the date of sampling. The black line represents the values obtained in the pots with earthworms (EW+), and the gray line represents the values obtained in the pots without earthworms (EW−).
Figure 4
Figure 4. Abundance of nitrous oxide reductase gene (nosZ) determined at the end of the experiment.
Panel (a) and (b) indicates the total number of nosZ gene copies quantified in bulk soil (Levene’s test, F > 0.05; Shapiro-Wilk’s test, p > 0.05; t-test, p-value = 0.07) and rhizosphere (Levene’s test, F > 0.05; Shapiro-Wilk’s test, p > 0.05; t-test, p-value = 7.4 × 10−4), respectively. Panel (c) and (d) indicates the ratio of nosZ gene within the prokaryotic community obtained in the bulk soil (Levene’s test, F > 0.05; Shapiro-Wilk’s test, p > 0.05; t-test, p-value = 0.67) and rhizosphere (Levene’s test, F > 0.05; Shapiro-Wilk’s test, p > 0.05; t-test, p-value = 0.05), respectively. The ratio values were obtained by dividing the total abundance of nosZ gene copies by the sum of the total abundance of 16 S rRNA genes from Archaea and bacteria. Empty boxes represent the values obtained in the pots without earthworms (EW−) and filled boxes represent the values obtained in the pots with earthworms (EW+).
Figure 5
Figure 5
Principal component analysis summarizing the variance of major categories of microbial functions as determined in the metagenomic profiles from bulk soil (a) and rhizosphere (b) at the end of the experiment. The major categories of functions are composed by more specialized pathways. The complete list of specific pathways of biological importance can be found in Supplementary Fig. S2.
Figure 6
Figure 6. Ecological interactions of microbial functions.
Significant (p-value > 0.05) and strong (−0.9> r >0.9) correlations among the most abundant microbial functions. Nodes represent functions and edges represent the correlation between them. Network (a) represents interactions built for bulk EW−, with 642 nodes and 1418 edges (53.88% positive correlations). Network (b) represents interactions built for bulk EW+, with 651 nodes and 3201 edges (52.17% positive correlations). Network (c) represents interactions built for rhizosphere EW−, with 579 nodes and 1737 edges (50.83% positive correlations). Network (d) represents interactions built for rhizosphere EW+, with 564 nodes and 2360 edges (51.91% positive correlations). Different colors indicate different clusters (i.e., modularity), and the nodes were sized according to their importance for the model (i.e., betweenness centrality).
Figure 7
Figure 7. Hypothetical model representing the mechanism by which earthworms may influence rhizosphere microbes in sugarcane.
The collective findings in the present study demonstrate that earthworm activity alters microbial functions in the soil (bulk soil and rhizosphere). We propose that the cause for that is the increase in the availability of nutrients and the elevated abundance of N2O, both known to be originated during the process of soil digestion inside worm guts, and therefore they may escape from the alimentary canal and be available to the soil microbial communities. Although the complete mechanism might be more complex than here represented, our dataset suggests that these factors may play an important role in enhancing microbial biosynthesis, cell proliferation and plant-microbe symbiosis in the rhizosphere under the influence of earthworms.

References

    1. Bouché M. B. Action de la faune sur les état de la matière organique dans les écosystèmes in Humification et Biodegradation (eds. Kilbertus G., Reisinger O., Mourey A. & Canela da Fonseca) 157–168 (Sarreguemines: Pierron, 1975).
    1. Lavelle P. Functional domains in soils. Ecol. Res. 17, 441–450 (2002).
    1. James S. W. Soil nitrogen, phosphorus, and organic matter processing by earthworms in tallgrass prairie. Ecology 72, 2101–2109 (1991).
    1. Lavelle P., Melendez G., Pashanasi B. & Schaefer R. Nitrogen mineralization and reorganization in casts of the geophagous tropical earthworm Pontoscolex corethrurus (Glossoscolecidae). Biol. Fert. Soils 14, 49–53 (1992).
    1. Subler S., Baranski C. M. & Edwards C. A. Earthworm additions increased short-term nitrogen availability and leaching in two grain-crop agroecosystems. Soil Biol. Biochem. 29, 413–421 (1997).

Publication types