

A hamster model for Marburg virus infection accurately recapitulates Marburg hemorrhagic fever
- PMID: 27976688
- PMCID: PMC5157018
- DOI: 10.1038/srep39214
A hamster model for Marburg virus infection accurately recapitulates Marburg hemorrhagic fever
Abstract
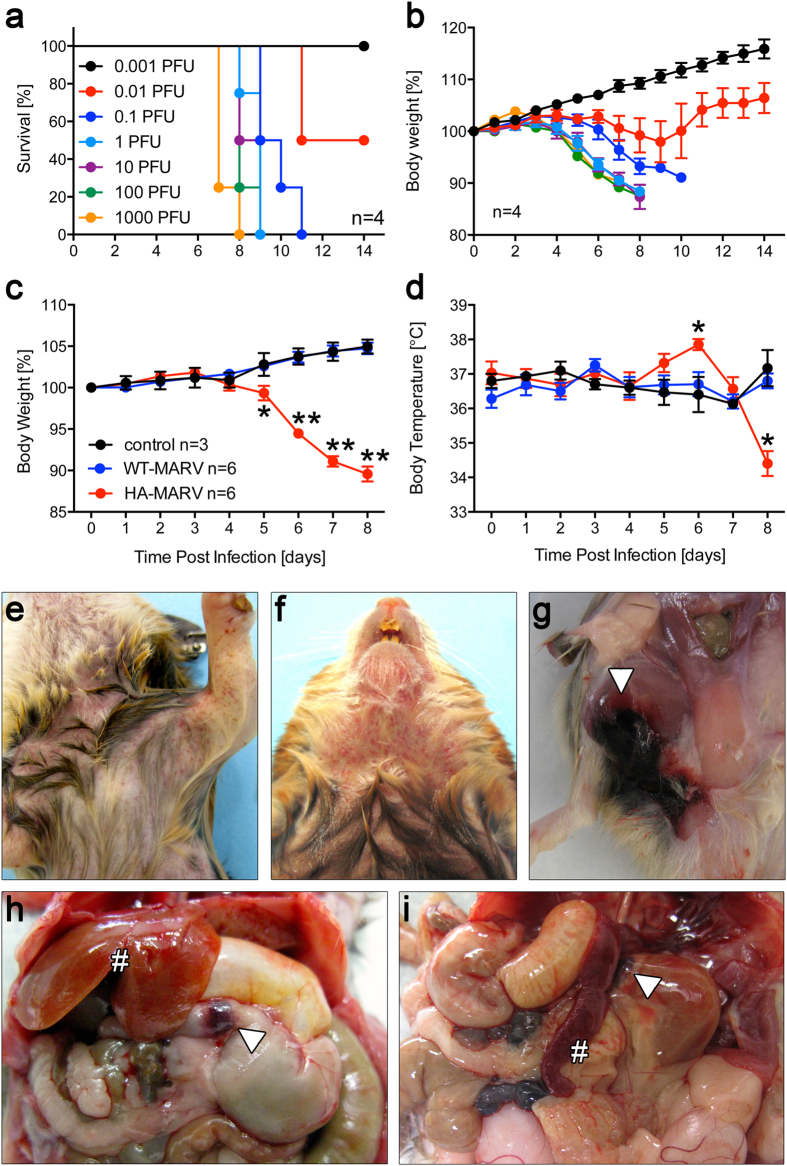
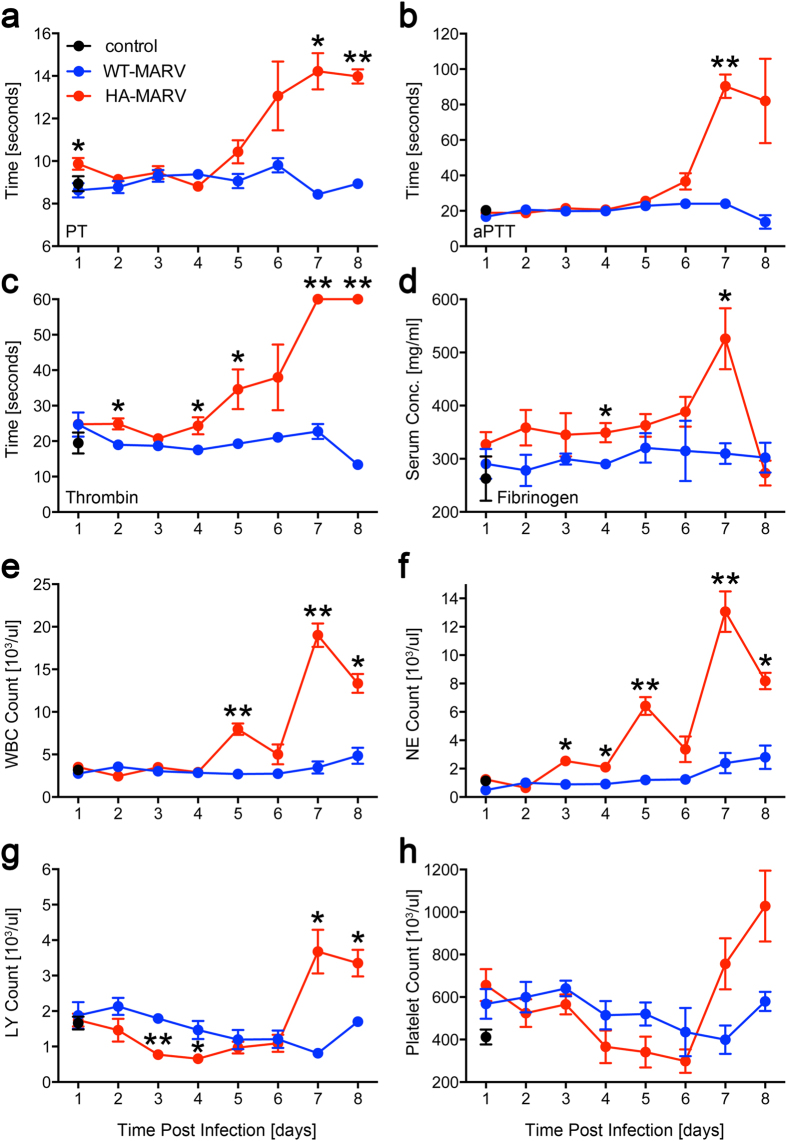
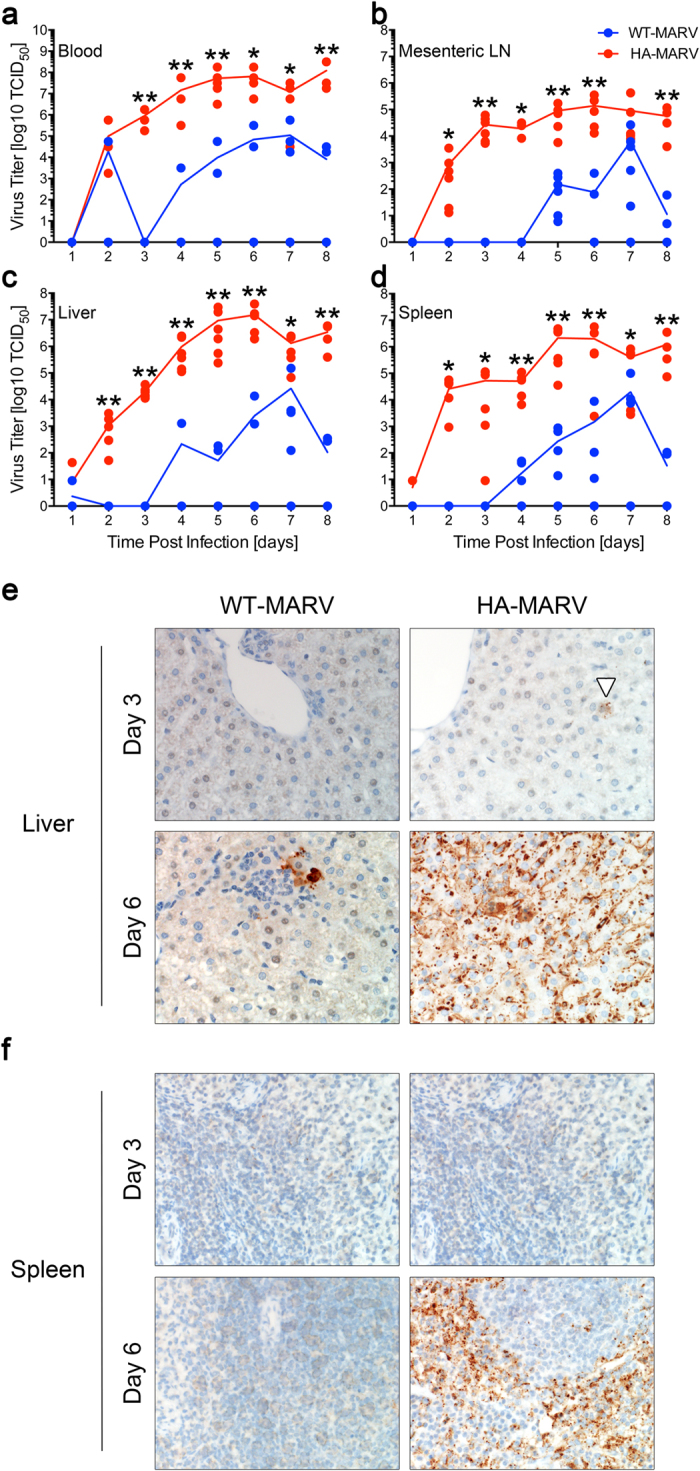
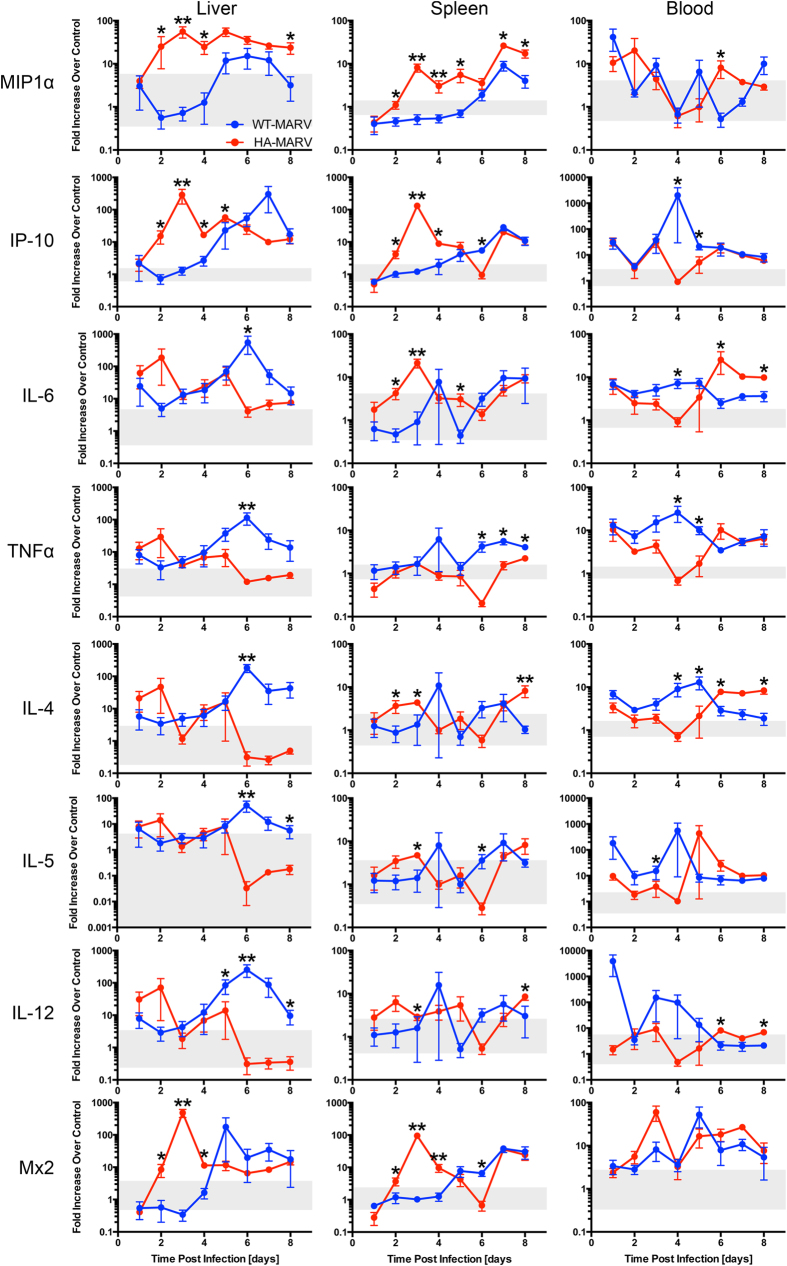
Marburg virus (MARV), a close relative of Ebola virus, is the causative agent of a severe human disease known as Marburg hemorrhagic fever (MHF). No licensed vaccine or therapeutic exists to treat MHF, and MARV is therefore classified as a Tier 1 select agent and a category A bioterrorism agent. In order to develop countermeasures against this severe disease, animal models that accurately recapitulate human disease are required. Here we describe the development of a novel, uniformly lethal Syrian golden hamster model of MHF using a hamster-adapted MARV variant Angola. Remarkably, this model displayed almost all of the clinical features of MHF seen in humans and non-human primates, including coagulation abnormalities, hemorrhagic manifestations, petechial rash, and a severely dysregulated immune response. This MHF hamster model represents a powerful tool for further dissecting MARV pathogenesis and accelerating the development of effective medical countermeasures against human MHF.
Figures
Similar articles
-
Development and characterization of a mouse model for Marburg hemorrhagic fever.J Virol. 2009 Jul;83(13):6404-15. doi: 10.1128/JVI.00126-09. Epub 2009 Apr 15. J Virol. 2009. PMID: 19369350 Free PMC article.
-
A Hamster Model for the Evaluation of Marburg Virus Countermeasures.Methods Mol Biol. 2025;2877:227-238. doi: 10.1007/978-1-0716-4256-6_16. Methods Mol Biol. 2025. PMID: 39585625
-
Comparison of the Pathogenesis of the Angola and Ravn Strains of Marburg Virus in the Outbred Guinea Pig Model.J Infect Dis. 2015 Oct 1;212 Suppl 2(Suppl 2):S258-70. doi: 10.1093/infdis/jiv182. Epub 2015 Jun 19. J Infect Dis. 2015. PMID: 26092858 Free PMC article.
-
Tissue and cellular tropism, pathology and pathogenesis of Ebola and Marburg viruses.J Pathol. 2015 Jan;235(2):153-74. doi: 10.1002/path.4456. J Pathol. 2015. PMID: 25297522 Review.
-
Animal models for Ebola and Marburg virus infections.Front Microbiol. 2013 Sep 5;4:267. doi: 10.3389/fmicb.2013.00267. Front Microbiol. 2013. PMID: 24046765 Free PMC article. Review.
Cited by
-
Vaccine Platform Comparison: Protective Efficacy against Lethal Marburg Virus Challenge in the Hamster Model.Int J Mol Sci. 2024 Aug 5;25(15):8516. doi: 10.3390/ijms25158516. Int J Mol Sci. 2024. PMID: 39126087 Free PMC article.
-
Zebrafish-based platform for emerging bio-contaminants and virus inactivation research.Sci Total Environ. 2023 May 10;872:162197. doi: 10.1016/j.scitotenv.2023.162197. Epub 2023 Feb 11. Sci Total Environ. 2023. PMID: 36781138 Free PMC article. Review.
-
Pathogenicity and virulence of Marburg virus.Virulence. 2022 Dec;13(1):609-633. doi: 10.1080/21505594.2022.2054760. Virulence. 2022. PMID: 35363588 Free PMC article. Review.
-
Screening and Identification of Marburg Virus Entry Inhibitors Using Approved Drugs.Virol Sin. 2020 Apr;35(2):235-239. doi: 10.1007/s12250-019-00184-3. Epub 2019 Dec 20. Virol Sin. 2020. PMID: 31863356 Free PMC article. No abstract available.
-
Structural and Dynamical Basis of VP35-RBD Inhibition by Marine Fungi Compounds to Combat Marburg Virus Infection.Mar Drugs. 2024 Jan 3;22(1):34. doi: 10.3390/md22010034. Mar Drugs. 2024. PMID: 38248659 Free PMC article.
References
-
- Feldmann H., Sanchez A. & Geisbert T. W. In Fields Virlogy (eds Bernard N. Fields, David M. Knipe & Peter M. Howley) p. 923–955 (Wolters Kluwer/Lippincott Williams & Wilkins Health, 2013).
-
- Centers for Disease, C. & Prevention. Imported case of Marburg hemorrhagic fever - Colorado, 2008. MMWR. Morbidity and mortality weekly report 58, 1377–1381 (2009). - PubMed
Publication types
MeSH terms
Substances
LinkOut - more resources
Full Text Sources
Other Literature Sources
Molecular Biology Databases
