. 2016 Dec 15:6:39225.
doi: 10.1038/srep39225.

Patient-specific structural effects on hemodynamics in the ischemic lower limb artery

Affiliations

Patient-specific structural effects on hemodynamics in the ischemic lower limb artery

Pengcheng Xu et al. Sci Rep. .

Abstract

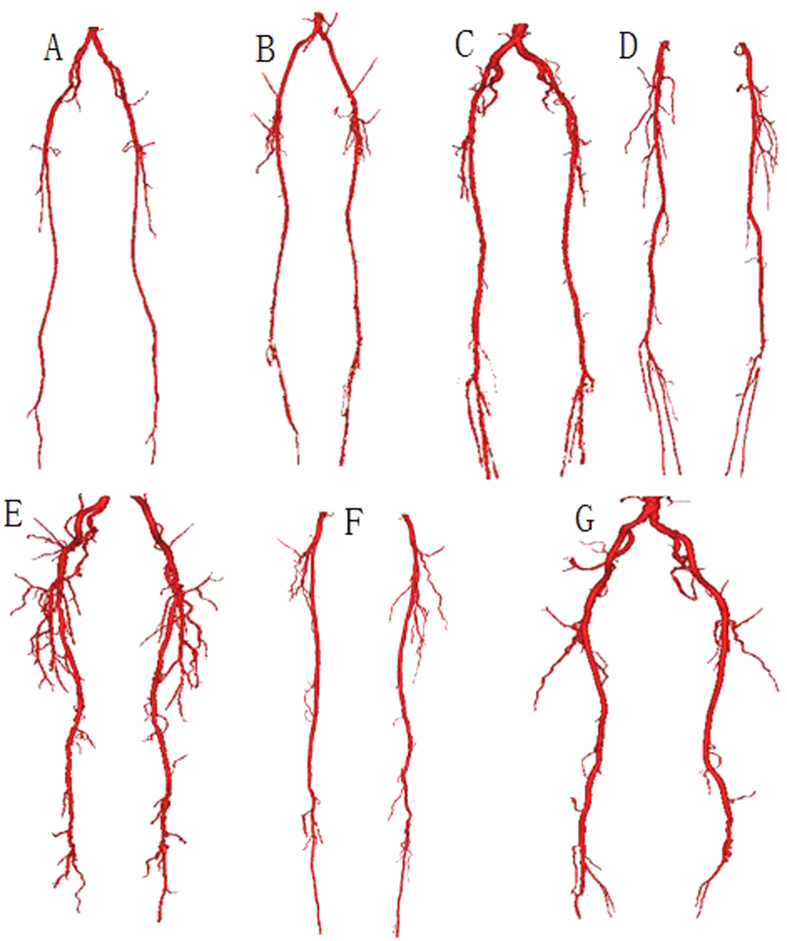
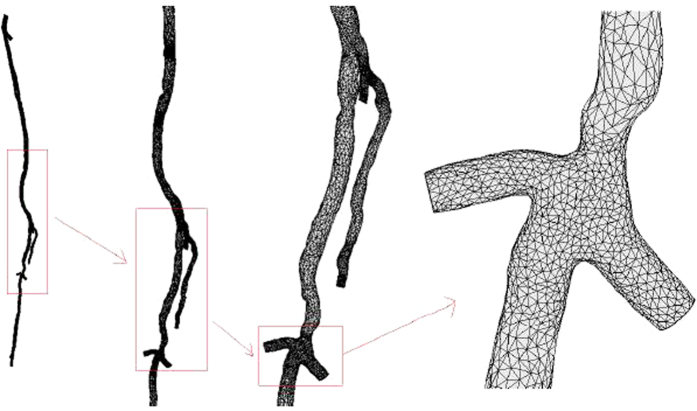
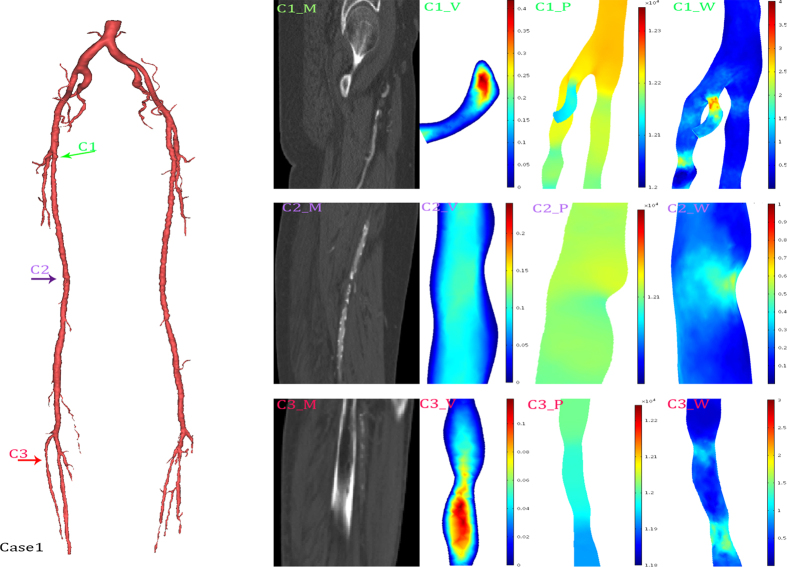
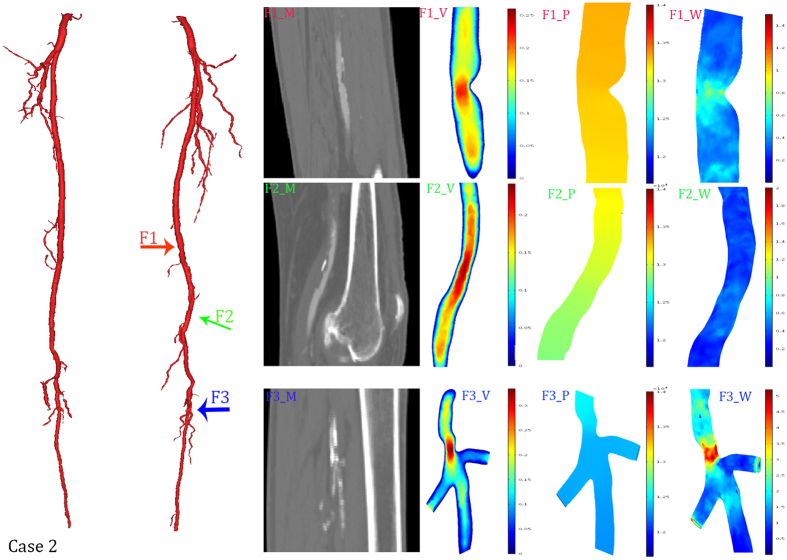
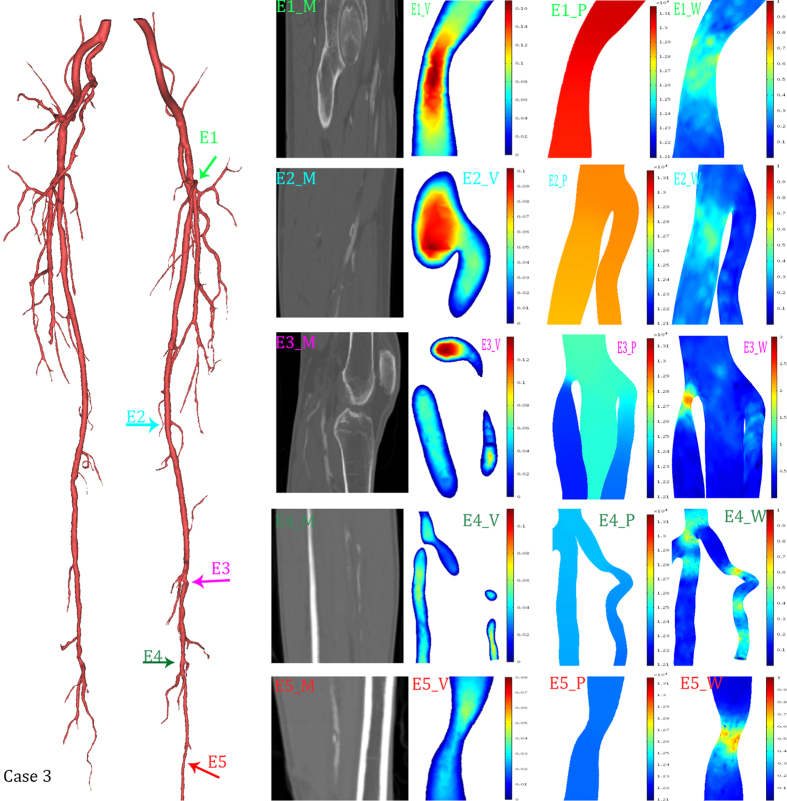
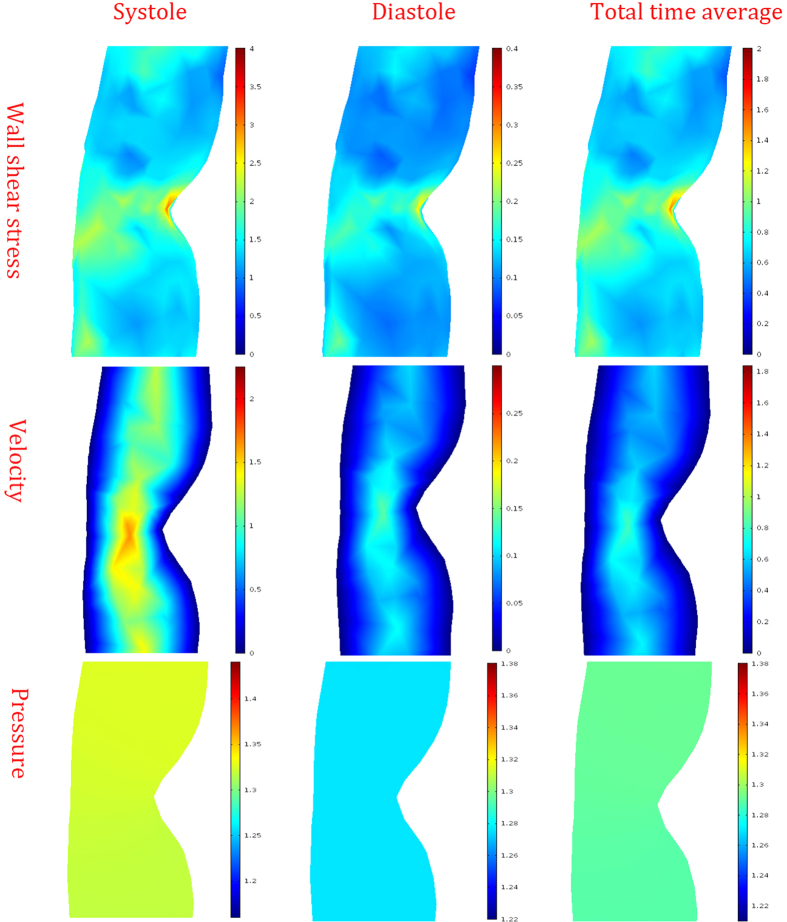
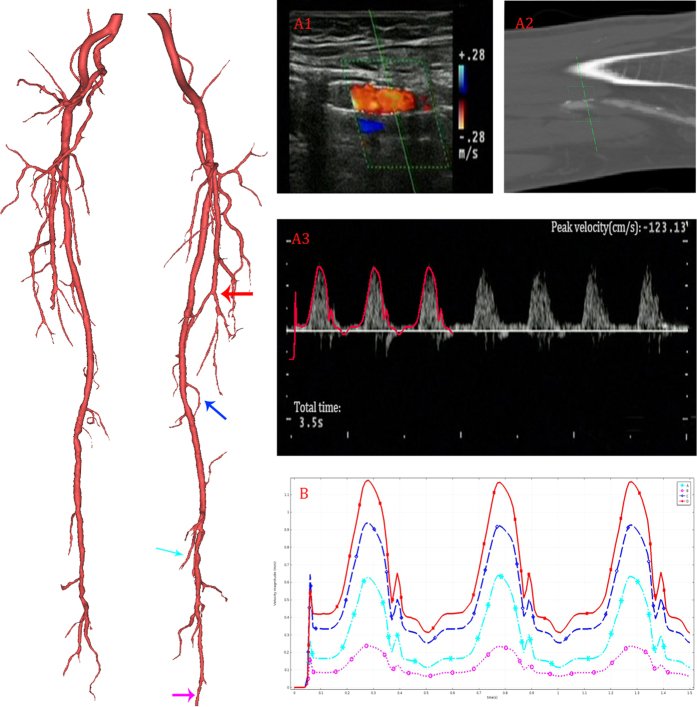
Lower limb peripheral artery disease is a prevalent chronic non-communicable disease without obvious symptoms. However, the effect of ischemic lower limb peripheral arteries on hemodynamics remains unclear. In this study, we investigated the variation of the hemodynamics caused by patient-specific structural artery characteristics. Computational fluid dynamic simulations were performed on seven lower limb (including superficial femoral, deep femoral and popliteal) artery models that were reconstructed from magnetic resonance imaging. We found that increased wall shear stress (WSS) was mainly caused by the increasing severity of stenosis, bending, and branching. Our results showed that the increase in the WSS value at a stenosis at the bifurcation was 2.7 Pa. In contrast, the isolated stenosis and branch caused a WSS increase of 0.7 Pa and 0.5 Pa, respectively. The WSS in the narrow popliteal artery was more sensitive to a reduction in radius. Our results also demonstrate that the distribution of the velocity and pressure gradient are highly structurally related. At last, Ultrasound Doppler velocimeter measured result was presented as a validation. In conclusion, the distribution of hemodynamics may serve as a supplement for clinical decision-making to prevent the occurrence of a morbid or mortal ischemic event.


Figures

Figure 1
Figure 1. Visual illustration of the patient-specific geometrical models.
These models were reconstructed from the lower limb arteries of the seven patients. The reconstructed geometric models differed from each other, according to a difference in MRI data acquisition.
Figure 2
Figure 2. Visual illustration of the mesh-generated result of one lower limb artery from one patient.
Panels shown from left to right are increasingly zoomed views of the mesh.
Figure 3
Figure 3. Density test of the mesh for CFD simulation.
The maximum pressure of the simulation calculated by varying density is shown in A. The minimum pressure of the simulation calculated by varying density is shown in B.
Figure 4
Figure 4. Hemodynamics distributions of the case 1.
The reconstructed model in 3D (left), and its typical geometrical features were marked with colored arrows. The first column (C1_M, C2_M, C3_M) were MRI data; the second column (C1_V, C2_V, C3_V) were slice rendered velocity distribution, the unit of the color bar was m/s; the third column (C1_P, C2_P, C3_P) were pressure distribution, the unit of the color bar was Pa; the fourth column (C1_W, C2_W, C3_W) were distribution of the mean diastolic wall shear stress, the unit of the color bar was Pa. Each row described the same geometrical feature marked in the 3D model and MRI data.
Figure 5
Figure 5. Hemodynamics distributions of the case 2.
The reconstructed model in 3D (left), and its typical geometrical features were marked with colored arrows. The first column (F1_M, F2_M, F3_M) were MRI data; the second column (F1_V, F2_V, F3_V) were slice rendered velocity distribution, the unit of the color bar was m/s; the third column (F1_P, F2_P, F3_P) were pressure distribution, the unit of the color bar was 104 Pa; the fourth column (F1_W, F2_W, F3_W) were distribution of the mean diastolic wall shear stress, the unit of the color bar was Pa. Each row described the same geometrical feature marked in the 3D model and MRI data.
Figure 6
Figure 6. Hemodynamics distributions of the case 3.
The reconstructed model in 3D (left), and its typical geometrical features were marked with colored arrows. The first column (E1_M, E2_M, E3_M, E4_M, E5_M) were MRI data; the second column (E1_V, E2_V, E3_V, E4_V, E5_V) were slice rendered velocity distribution, the unit of the color bar was m/s; the third column (E1_P, E2_P, E3_P, E4_P, E5_P) were pressure distribution, the unit of the color bar was Pa; the fourth column (E1_W, E2_W, E3_W, E4_W, E5_W) were distribution of the mean diastolic wall shear stress, the unit of the color bar was Pa. Each row described the same geometrical feature marked in the 3D model and MRI data.
Figure 7
Figure 7. Hemodynamic distribution of different periods.
The distributions of the wall shear stress were showed in the top column, the unit was Pa. The distributions of the velocity were showed in the middle column, the unit was m/s. The distributions of the pressure were showed in the bottom column, the unit was 104Pa.
Figure 8
Figure 8. Computational results of velocity profile.
The reconstructed model in 3D (left), and UDV measured location was marked in red arrow. The UDV measured result was shown in A1. The corresponding location of MRI data was shown in A2. In A3, the calculated velocity profile (outlined in red) are overlapped on the UDV measurements to validate the accuracy of the simulation. The velocity profiles of four typical outlets (marked by colored arrow in 3D model) calculated by CFD are shown in B.
Figure 9
Figure 9. The schematic illustration of the Windkessel model.
The parameters were defined as follows: Rp represents the proximal resistance, Rd represents the distal resistance, C represents the compliance of the artery, pout represents the pressure in the realistic terminal, and i represents the flow rate at the boundary outflow.

References

    1. Fowkes F. G. et al.. Comparison of global estimates of prevalence and risk factors for peripheral artery disease in 2000 and 2010: a systematic review and analysis. Lancet 382, 1329 (2013). - PubMed
    1. Hirsch A. T., Criqui M. H., Treat-Jacobson D. & Et. A. PEripheral arterial disease detection, awareness, and treatment in primary care. Jama 286, 1317 (2001). - PubMed
    1. Fowkes F. G. R. et al.. Edinburgh Artery Study: Prevalence of Asymptomatic and Symptomatic Peripheral Arterial Disease in the General Population. Int J Epidemiol 20, 384 (1991). - PubMed
    1. Donnelly R. & Yeung J. M.. Management of intermittent claudication: the importance of secondary prevention. Eur J Vasc Endovasc Surg 23, 100 (2002). - PubMed
    1. Layden J., Michaels J., Bermingham S. & Higgins B.. Diagnosis and management of lower limb peripheral arterial disease: summary of NICE guidance. BMJ 345, e4947 (2012). - PubMed

Publication types