. 2016 Dec 15:6:39279.
doi: 10.1038/srep39279.

A pathway-centric view of spatial proximity in the 3D nucleome across cell lines

Affiliations

A pathway-centric view of spatial proximity in the 3D nucleome across cell lines

Hiren Karathia et al. Sci Rep. .

Abstract

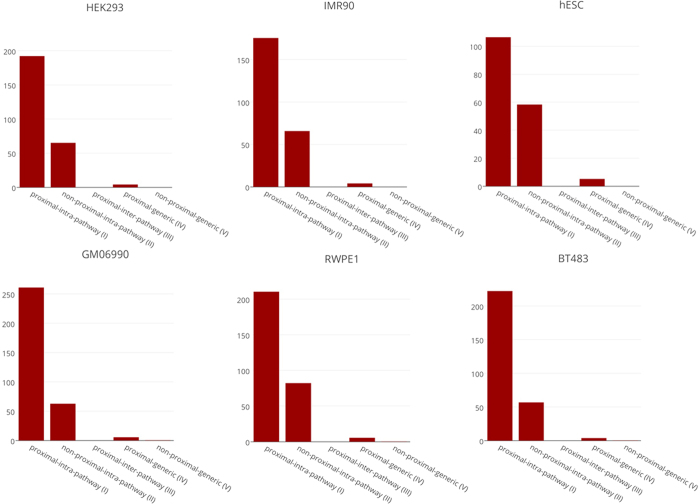
In various contexts, spatially proximal genes have been shown to be functionally related. However, the extent to which spatial proximity of genes in a pathway contributes to the pathway's context-specific activity is not known. Leveraging Hi-C data in six human cell-lines, we show that spatial proximity of genes in a pathway is highly correlated with the pathway's context-specific expression and function. Furthermore, spatial proximity of pathway genes correlates with interactions of their protein products, and the specific pathway genes that are proximal to one another tend to occupy higher levels in the regulatory hierarchy. In addition to intra-pathway proximity, related pathways are spatially proximal to one another and housekeeping-genes tend to be proximal to several other pathways suggesting their coordinating role. Substantially extending previous works, our study reveals a pathway-centric organization of 3D-nucleome, whereby, functionally related interacting driver genes tend to be in spatial-proximity in a context-specific manner.


Figures

Figure 1
Figure 1. Relationships between chromatin compartments (based on HiC-PCA analysis) spatial proximity at 10 kb resolution and expression.
(A) Genes were partitioned into active and inactive compartments based on Hi-C contact matrix as in ref. and the number of spatially proximal (blue) and spatially non-proximal (red) genes in the two compartments are shown. Fisher test was performed to assess the differences in the two compartments: HEK293 (odds: 1.7; pval: 9.3e-74), IMR90 (odds: 1.9; pval: 2.2e-118), hESC (odds: 0.8, pval: 7.4e-12), GM06990 (odds: 3.5; pval: 0.0), RWPE1 (odds: 2.4; pval: 1.2e-169), BT483 (odds; 1.3; pval: 2.4e-22). (B) LOG2 of RNA-seq expression value (y-axis) for the genes categorized in active-proximal (AP), active-non-proximal (ANP), non-active-proximal (NAP), non-active-non-proximal (NANP) sets. Wilcoxon p-values for HEK293 (AP~ANP: 8.8e-32; AP~NAP: 1.3e-04; AP~NANP: 1.8e-46), IMR90 (AP~ANP: 8.3e-38; AP~NAP: 2.6e-06; AP~NANP: 7.2e-46), hESC (AP~ANP: 1.0e-36; AP~NAP: 0.5; AP~NANP: 3.6e-17), GM06990 (AP~ANP: 1.2e-27; AP~NAP: 5.0e-05; AP~NANP: 2.0e-41), RWPE1 (AP~ANP: 4.7e-16; NAP~AP: 3.2e-05; AP~NANP: 2.5e-05) and BT483 (AP~ANP: 1.4e-23; AP~NAP: 0.001; AP~NANP: 7.9e-25).(see Supplementary Fig. 3 for 100 kb resolution).
Figure 2
Figure 2. Z-score distribution of intra-pathway spatial proximity at 10 kb resolution.
The figure shows the distributions of spatial-proximity z-scores for three sets of gene sets, pooled from 6 cell lines (with 10 kb resolution processed HiC data). Blue: KEGG pathway (excluding housekeeping genes). Red: Random gene-sets matching each KEGG pathway controlled for gene lengths and chromosomal distributions. Green: intersection of each pair of KEGG pathways.
Figure 3
Figure 3. Spatial proximity of intra-pathway genes in selected KEGG pathways.
(excluding Housekeeping genes) and Housekeeping genes, as a virtual pathway itself, across six cell lines from 10 kb (a) and 100 kb (b) Hi-C data. (Supplementary Figs 4 and 5 for full pathways).
Figure 4
Figure 4. Schematic defining sets of genes and gene-pairs.
Outermost rectangle represents all genes. Inner rectangle represents all genes that are in spatial proximity to at least one other gene. Circles represent annotated pathways. Nodes represent genes and edges represent spatially proximal gene pairs. All spatially proximal gene pairs are partitioned into three groups: proximal-intra-pathway: intra-pathway spatially proximal gene pairs (orange nodes and edges), proximal-inter-pathway: Spatially proximal pair of genes where each gene is in a different pathway (light blue nodes and edges), and proximal-generic:Spatially proximal pair of genes such that at least one of the genes is not in any pathway (red nodes and edges). Similarly all non-proximal gene pairs are partitioned into two categories: non-proximal-intra-pathway: a non-proximal gene pair within a pathway, and non-proximal-generic:any pair of genes that are not spatially proximal to any other gene and not within any pathway (pairs of dark blue nodes).
Figure 5
Figure 5. Spatial proximity and gene expression (10 kb and 100 kb resolutions).
The figure shows box-plots of gene expression (FPKM) values of the genes in three different groups (see Fig. 4) pooled from all 6 cell lines. A~B Wilcoxon test 10 kb p-value = 1.5e-13 and 100 kb p-value = 1.6e-12, A~C Wilcoxon test 10 kb p-value = 1.7e-98 and 100 kb 6.8e-59. See Supplementary Fig. 8 for results of 6 individual cells at 10 kb and 100 kb resolutions.
Figure 6
Figure 6. Spatial proximity versus mean pathway expression (10 kb and 100 kb resolutions).
This figure shows scatter plot between proximity z-scores of pathways versus z-scores of expression values of the proximal-intra-pathway genes pooled from all 6 cells. Spearman rho = 0.67 (p-value: 2.7e-28) and rho = 0.82 (p-value: 6.6e-45) are respectively for 10 kb and 100 kb resolutions. See Supplementary Fig. 9 for results of 6 individual cells at 10 kb and 100 kb resolutions.
Figure 7
Figure 7. Pathway membership, spatial proximity and PPI (10 kb resolution).
The figure shows fraction of gene pairs (Y-axis) in different gene groups (X-axis; see Fig. 5) whose protein products physically interact in each of the 6 cell lines. Chi-square p-value for each tissues are - HEK293 (I~II: 6.0e-04; I~III: *; I~IV: 4.0E-83; I~V: 0.0), IMR90 (I~II: 2.2e-03; I~III: *; I~IV: 1.8e-76; I~V: 4.5e-266), hESC (I~II: 0.2; I~III: *; I~IV: 8.3e-17; I~V: 2.9e-135), GM06990 (I~II: 5.1e-04; I~III: *; I~IV: 2.7e-47; I~V: 3.6e-287), RWPE1 (I~II: 0.1; I~III: *; I~IV: 8.6e-23; I~V: 1.1e-201) and BT483 (I~II: 0.2; I~III: *; I~IV: 5.9e-09; I~V: 3.5e-92). See Supplementary Fig. 10 for results of 6 individual cells at 100 kb resolutions. (*) Indicates zero fraction of PPI found in the class.
Figure 8
Figure 8. GO enrichment analysis (a. 10 kb and b. 100 kb resolution).
This figure enriched different terms (GO Biological Process) at FDR <= 0.1 for active proximal-intra-pathway genes relative to other spatially proximal active genes (see Fig. 4).

References

    1. Shaw P. J. Mapping chromatin conformation. F1000 Biol Rep 2, doi: 10.3410/B2-18 (2010). - DOI - PMC - PubMed
    1. Burton J. N. et al.. Chromosome-scale scaffolding of de novo genome assemblies based on chromatin interactions. Nat Biotechnol 31, 1119–1125, doi: 10.1038/nbt.2727 (2013). - DOI - PMC - PubMed
    1. van Berkum N. L. et al.. Hi-C: a method to study the three-dimensional architecture of genomes. J Vis Exp, doi: 10.3791/1869 (2010). - DOI - PMC - PubMed
    1. Aguilar-Arnal L. & Sassone-Corsi P. Chromatin landscape and circadian dynamics: Spatial and temporal organization of clock transcription. Proc Natl Acad Sci USA, doi: 10.1073/pnas.1411264111 (2014). - DOI - PMC - PubMed
    1. Duggal G., Wang H. & Kingsford C. Higher-order chromatin domains link eQTLs with the expression of far-away genes. Nucleic Acids Res 42, 87–96, doi: 10.1093/nar/gkt857 (2014). - DOI - PMC - PubMed

Publication types

LinkOut - more resources