. 2016 Dec 15:7:13669.
doi: 10.1038/ncomms13669.

Multivoxel neurofeedback selectively modulates confidence without changing perceptual performance

Affiliations

Multivoxel neurofeedback selectively modulates confidence without changing perceptual performance

Aurelio Cortese et al. Nat Commun. .

Abstract

A central controversy in metacognition studies concerns whether subjective confidence directly reflects the reliability of perceptual or cognitive processes, as suggested by normative models based on the assumption that neural computations are generally optimal. This view enjoys popularity in the computational and animal literatures, but it has also been suggested that confidence may depend on a late-stage estimation dissociable from perceptual processes. Yet, at least in humans, experimental tools have lacked the power to resolve these issues convincingly. Here, we overcome this difficulty by using the recently developed method of decoded neurofeedback (DecNef) to systematically manipulate multivoxel correlates of confidence in a frontoparietal network. Here we report that bi-directional changes in confidence do not affect perceptual accuracy. Further psychophysical analyses rule out accounts based on simple shifts in reporting strategy. Our results provide clear neuroscientific evidence for the systematic dissociation between confidence and perceptual performance, and thereby challenge current theoretical thinking.


Conflict of interest statement

There is a potential financial conflict of interest; one of the authors is the inventor of patents related to the neurofeedback method used in this study, and the original assignee of the patents is ATR, with which M.K. is affiliated. The remaining authors declare no competing financial interests.

Figures

Figure 1
Figure 1. Conceptual illustration of the putative generation of confidence in the brain.
Given a certain visual stimulus as input to the system, the brain makes perceptual decisions with a corresponding level of internal perceptual evidence and noise. (a) Highlights the view that confidence is computed by the same neural substrates encoding perceptual evidence, and the two evolve together to give rise to a subjective report. According to this view, manipulations of confidence should change perceptual performance too. (b) Confidence is generated downstream from the processing of perceptual evidence, inheriting noise and signal from the earlier stages, but additional noise at this level further modulates confidence. This hierarchical view therefore considers confidence as a metacognitive process. We further hypothesize that a previous study of rTMS might have mainly affected the self-reporting mechanism, rather than confidence per se. This is congruent with the result that confidence ratings only became less diagnostic of accuracy, but overall confidence levels did not change in a specific direction in this previous rTMS study. If a manipulation such as decoded neurofeedback (DecNef) can specifically affect confidence representations, we should be able to selectively up- and downregulate confidence, without affecting task accuracy.
Figure 2
Figure 2. Experimental design and behavioural performance during the MVPA session.
(a) The experiment consisted of six neuroimaging sessions. First, we conducted a retinotopy session to functionally define the brain's visual areas. Second, we conducted an MVPA session, the data from which were used to read out the voxel-based activation patterns evoked during discrimination of motion direction with high or low confidence. Last, the multivoxel activation patterns for high or low confidence were induced in each of two separate DecNef blocks, each comprising two neurofeedback sessions (that is, 2 days), in a counterbalanced order. Each neurofeedback block was preceded by a pre-test and followed by a post-test procedure to measure the behavioural changes induced by DecNef. (b) The trial sequence of the two-choice discrimination task with a random dot-motion stimulus. Upon stimulus presentation, the participants were required to indicate the motion direction (leftward or rightward) and to judge confidence (four-point scale) on their perceptual decision. Importantly, the corresponding buttons were randomized and assigned after stimulus presentation, so the participants could not prepare for a specific motor response during the delay. The same trial sequence was used in the MVPA session and the pre-/post-tests. (c) Discrimination accuracy during the MVPA session was at a threshold level of 75% correct, achieved via stimulus titration (see the ‘Methods' section). (d) Confidence in the correct and incorrect trials of the MVPA session. The correct trials were rated with higher confidence compared with the incorrect trials. n=17, ***P<10−5. Centre values correspond to means, and error bars to s.e.m. DecNef, decoded fMRI neurofeedback.
Figure 3
Figure 3. MVPA results.
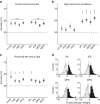
MVPA results reveal that accuracy, confidence and percept can all be decoded in multiple brain regions of interest (ROIs), but the representations may differ (ad). Shown here are accuracies (%) in classifying the participants' responses from their brain activation patterns within different ROIs. Accuracy in classifying (a) correct versus incorrect trials, (b) high- versus low-confidence trials and (c) perceived motion direction (left versus right). (d) Pruned weights of the confidence decoder. The SLR algorithm automatically selected relevant voxels that carried information to decode confidence. The weights were distributed to both the negative and positive sides of the abscissa; thus, the classification of high versus low confidence depended upon spatial activation patterns, rather than general activation changes; n=17, *P<0.05, **P<0.01, ***P<0.005, ****P<10−3, *****P<10−4; P values corrected for multiple comparisons (Holm–Bonferroni). Centre values correspond to means, and error bars to s.e.m. FFG, fusiform gyrus; IFS, inferior frontal sulcus; IPL, inferior parietal lobule; MFG, middle frontal gyrus; MFS, middle frontal sulcus.
Figure 4
Figure 4. Rectification analysis for task accuracy.
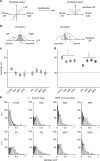
(a) We initially constructed a decoder that classified perceptual responses into leftward versus rightward motion. When generalizing to correct versus incorrect trials, the output of this decoder (the linear discriminant function, LDF) was rectified (absolute value taken where zero was the discrimination criterion for left versus right motion) before assigning labels to each trial. (b) Rationale of the analysis: before rectification, the output of the LDF does not distinguish between correct and incorrect trials. The distribution of LDF output values for the incorrect trials is expected to be unimodal and centred at the left–right decision boundary, while the distribution for correct trials is expected to be bimodal, with peaks distributed on either side of the left–right decision boundary. Importantly, the two distributions should have approximately the same mean. However, upon rectification, the distribution for correct trials will have a higher mean value and therefore a new boundary can be set to discriminate between correct versus incorrect trials. (Please see the main text for a more detailed explanation). (c) As expected, before rectification, the decoder for perceptual responses fails to generalize to the discrimination of correct versus incorrect trials. (d) Following rectification, the information contained in the voxels' spatial activation patterns can be used to successfully discriminate between correct versus incorrect trials. (e) Distributions of normalized rectified LDF values for correct and incorrect trials (all participants pooled; a.u, arbitrary unit); n=17, ****P<10−3; P values corrected for multiple comparisons (Holm–Bonferroni). Centre values correspond to means, and error bars to s.e.m. ROI labels as in Fig. 3.
Figure 5
Figure 5. Confidence is not just the rectified perceptual response.
We applied the same steps described in Fig. 4a,b, and found that the rectified perceptual response cannot predict confidence in most brain regions. (a) As expected, before rectification, the decoder for perceptual responses cannot generalize to confidence. (b) If confidence were a direct product of the transformed internal sensory signal, this would predict that by rectifying the output of the decoder, confidence levels could be classified. Our results suggest that this was not the case for most ROIs, as only a marginal improvement of decoding accuracy was found in hMT and FFG—which did not survive correction for multiple comparisons. (c) Distributions of normalized rectified LDF values for high- and low-confidence trials are highly similar (all participants pooled; a.u., arbitrary unit), confirming the negative results in b; n=17, centre values correspond to means, and error bars to s.e.m. ROI labels as in Fig. 3.
Figure 6
Figure 6. Relationship between linear classifier output and confidence.
Here we graphically assessed the relationship between confidence and the output of the classifier (linear discriminant function, LDF) constructed on the basis of the perceived direction of motion (leftward, rightward). Larger magnitude of LDF value represents trials of higher signal strength. For each ROI, black circles represent binned data points pooled from all the participants, at each confidence level, respectively. The size of the circles reflects the number of data points within each bin; each side of the LDF function was subdivided into 20 bins. Thick lines (dark for negative LDF values, light for positive LDF values) are linear fits to the LDF against confidence levels. On the basis of normative optimality models, one would expect higher absolute LDF magnitude to be associated with higher confidence ratings, thereby forming a ‘v-shaped' pattern on these plots. V1/V2 alone shows a relevant significant correlation between negative LDF values (leftward motion), and confidence (Pearson's r, corrected for multiple comparisons across ROIs). In all other ROIs, there seem to be negligible meaningful relationship between LDF magnitude and confidence. *P<0.05 ROI labels as in Fig. 3.
Figure 7
Figure 7. DecNef trial design and bi-directional confidence manipulation.
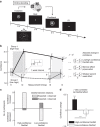
(a) The sequence of a single DecNef trial. The participants were instructed to modulate their brain activity during the induction period with the goal of making the grey feedback disc as large as possible. Online decoding was performed with fMRI BOLD activity patterns from all four frontoparietal ROIs (IPL, IFS, MFS and MFG) during 6–12 s after the onset of the induction cue, to account for the hemodynamic delay. The feedback disc size indicated the amount of monetary reward earned in that trial (max=18.75 yen, approximately 0.15 US dollars in each trial), and was determined by the likelihood of the real-time activation patterns being classified as high or low confidence (depending on the session), given previous subject-specific MVPA results. (b) Confidence measurements for the two groups across four time points of the experiments: the pre-, post-tests on week one (1 and 2, respectively), and pre- and post-tests on week 2 (3 and 4, respectively). Thick solid line shows the results for high–low confidence DecNef order group, thick dashed for low–high confidence DecNef order group. Grey backgrounds (darker for high confidence DecNef) indicate when DecNef training took place. Vertical arrows a, b denote the change in confidence from time point 1 while the line c represents the difference from the previous time point 3. Superscripts + and − indicate the directionality of the manipulations: high and low confidence DecNef, respectively. The ratio formulations of the raw parameters are shown on the right side; n=5, centre values correspond to means, and error bars represent s.e.m. (c) Illustration of the binomial probability between the observed and expected directions of confidence changes. Nine out of 10 changes were in the expected direction for high confidence DecNef, and 7/10 for low confidence DecNef. (d) Bi-directional net effects of high- and low-confidence DecNef. The second week confidence change was standardized with the gamma ratio week-2/week-1 effects (indicated in b), to account for the interference of the first week DecNef with the second week effects. The changes were significant in both the directions, demonstrating that confidence was bi-directionally manipulated by neurofeedback training, n=10, centre values correspond to means, and error bars represent s.e.m. ***P<0.005, *P<0.05.
Figure 8
Figure 8. Additional behavioural effects of DecNef.
(a) Discrimination accuracy in pre- and post-tests did not change; a two-way ANOVA with repeated measures resulted in a nonsignificant interaction, as well as nonsignificant main effects of time and neurofeedback. (b) Net confidence changes for correct and incorrect trials, in high- and low-confidence DecNef. The data plotted take into account the order and interference of DecNef sessions and integrate the estimated gamma parameter (see main text). Qualitatively, DecNef had a larger effect on incorrect trials. Confidence change for incorrect trials in high-confidence DecNef was significantly different from 0, while in low-confidence DecNef the change was close to significance. A clear trend emerges from these data, indicating that the effect had opposite effects in high- and low-confidence DecNef, and that it was larger for incorrect trials. (c) Asymmetrical changes in confidence for correct and incorrect trials, in high- and low-confidence DecNef, plotted with respect to pre- and post-test measures. A three-way ANOVA (factors of response type, neurofeedback and time) with repeated measures showed a close-to-significance three-way interaction, a significant interaction between neurofeedback and time, and a significant main effect of response accuracy. As in the previous panel, the data plotted take into account the order and interference of DecNef sessions and integrate the estimated gamma parameter. (d) Meta-d′ was significantly reduced following high-confidence DecNef, indicating that a mere change in criterion cannot account for the results reported in b,c and Fig. 7d; see main text for explanation. Two-way ANOVA with repeated measures showed no significant interaction, but the main effect of time was close to significance; n=10, +P=0.108, *P<0.05, ***P<0.005. Centre values correspond to means, and error bars to s.e.m.
Figure 9
Figure 9. Correlation between neurofeedback success and confidence changes.
(a) Confidence rating changes between pre- and post-tests correlated with induction success on combined DecNef on day 2. The ordinate represents the change in confidence between pre- and post-tests. The abscissa, the likelihood of high-confidence induction, indexes neurofeedback success, 0.5 being the null point, with no effect expected. Values below 0.5 translate into higher likelihood of low-confidence induction. Each data point represents one participant—n=20 data points, as all participants performed in two DecNef blocks—averaged across trials and runs performed on day 2 of each block. Correlations were inferred by computing Pearson's r. (b) Relative contributions to induction success. For each participant, in both high-confidence DecNef and low-confidence DecNef combined, the ROI with the overall highest induction success was selected. Bars represent the averaged net confidence change (absolute change in confidence) in participants for which the parietal ROI (IPL, n=7) and one of the frontal ROIs (LPFC, n=3) were selected. *P<0.05, P values corrected for multiple comparisons (Holm–Bonferroni). Centre values correspond to means, and error bars to s.e.m. ROI labels: IPL, inferior parietal lobule; LPFC, lateral prefrontal cortex.
Figure 10
Figure 10. Information communication criterion analysis.
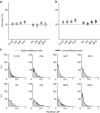
The information communication criterion analysis shows that induction of high- and low-confidence activation patterns in frontoparietal areas did not result from activation patterns in visual areas. The mean (±s.e.m.) coefficient of determination—goodness of fits between the likelihood in (a) IPL, (b) IFS, (c) MFS, (d) MFG and the predicted value for each area—multiplied by 100 for the sparse linear regression prediction by each of the activation patterns in V1/V2, V3A, hMT, FFG, IPL, IFS, MFS and MFG during DecNef, and from the IPL, IFS, MFS and MFG themselves as a control. The coefficient of determination is akin to variance-accounted-for (VAF). Centre values correspond to means, and error bars to s.e.m. FFG, fusiform gyrus; IFS, inferior frontal sulcus; IPL, inferior parietal lobule; MFG, middle frontal gyrus; MFS, middle frontal sulcus.

Similar articles

Cited by

References

    1. Kepecs A. & Mainen Z. F. A computational framework for the study of confidence in humans and animals. Philos. Trans. R Soc. Lond. B Biol. Sci. 367, 1322–1337 (2012). - PMC - PubMed
    1. Fleming S. M., Dolan R. J. & Frith C. D. Metacognition: computation, biology and function. Philos. Trans. R Soc. Lond. B Biol. Sci. 367, 1280–1286 (2012). - PMC - PubMed
    1. Hampton R. R. Multiple demonstrations of metacognition in nonhumans: converging evidence or multiple mechanisms? Comp. Cogn. Behav. Rev. 4, 17–28 (2009). - PMC - PubMed
    1. Terrace H. S. & Metcalfe J. The Missing Link in Cognition: Origins of Self-Reflective Consciousness Oxford Univ. Press (2005).
    1. Smith J. D., Shields W. E. & Washburn D. A. The comparative psychology of uncertainty monitoring and metacognition. Behav. Brain Sci. 26, 317–339 discussion 340–373 (2003). - PubMed

Publication types

LinkOut - more resources