

Review
doi: 10.1021/acs.analchem.6b04631.
Epub 2016 Dec 15.
Analytical Methods for Imaging Metals in Biology: From Transition Metal Metabolism to Transition Metal Signaling
Affiliations
- PMID: 27976855
- PMCID: PMC5827935
- DOI: 10.1021/acs.analchem.6b04631
Item in Clipboard
Review
Analytical Methods for Imaging Metals in Biology: From Transition Metal Metabolism to Transition Metal Signaling
Anal Chem.
.
No abstract available
Conflict of interest statement
The authors declare no competing financial interest.
Figures
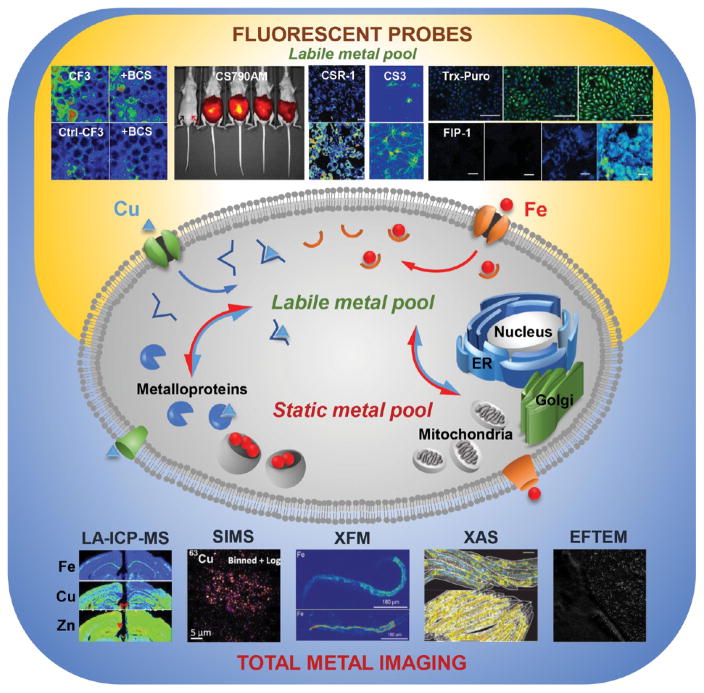
The total metal pool comprises the labile and static metal pools. Physical techniques that map the distribution of the total metal pool in cells, tissues, and organisms include technologies that measure atomic mass (LA-ICPMS and SIMS) and technologies that probe electronic structure (e.g., XFM, XAS, and EFTEM, among others). Fluorescent sensors map the labile metal pool. Representative data were reproduced from the following publications: CF3/Ctl-CF3 ± BCS: from Dodani, S. C.; Firl, A.; Chan, J.; Nam, C. I.; Aron, A. T.; Onak, C. S.; Ramos-Torres, K. M.; Paek, J.; Webster, C. M.; Feller, M. B.; Chang, C. J. Proc. Natl. Acad. Sci. U.S.A.
2014, 111, 16280–16285 (ref 164). Copyright 2016 National Academy of Sciences. CS790AM: from Hirayama, T.; Van de Bittner, G. C.; Gray, L. W.; Lutsenko, S.; Chang, C. J. Proc. Natl. Acad. Sci. U.S.A.
2012, 109, 2228–2233 (ref 170). Copyright 2012 National Academy of Sciences. CSR1: from Krishnamoorthy, L.; Cotruvo, J. A.; Chan, J.; Kaluarachchi, H.; Muchenditsi, A.; Pendyala, V. S.; Jia, S.; Aron, A. T.; Ackerman, C. M.; Vander Wal, M. N.; Guan, T.; Smaga, L. P.; Farhi, S. L.; New, E. J.; Lutsenko, S.; Chang, C. J. Nat. Chem. Biol.
2016, 12, 586–592 (ref 167). Copyright 2016 Nature Publishing Group. CS3: from Dodani, S. C.; Domaille, D. W.; Nam, C. I.; Miller, E. W.; Finney, L. A.; Vogt, S.; Chang, C. J. Proc. Natl. Acad. Sci. U.S.A.
2011, 29, 686–700 (ref 160). Copyright 2016 National Academy of Sciences. Trx-Puro: from Spangler, B.; Morgan, C. W.; Fontaine, S. D.; Vander Wal, M. N.; Chang, C. J.; Wells, J. A.; Renslo, A. R. Nat. Chem. Biol.
2016, 12, 680–685 (ref 138). Copyright 2016 Nature Publishing Group. FIP-1: from Aron, A. T.; Loehr, M. O.; Bogena, J.; Chang, C. J. J. Am. Chem. Soc.
2016, 138, 14338–14346 (ref 136). Copyright 2016 The American Chemical Society. LA-ICPMS: from Portbury, S. D.; Hare, D. J.; Sgambelloni, C.; Finkelstein, D. I.; Adlard, P. A. Metallomics
2016, 8, 193–200 (ref 61) with the permission of The Royal Chemical Society. SIMS: from Biesemeier, A.; Eibl, O.; Eswara, S.; Audinot, J.-N.; Wirtz, T.; Pezzoli, G.; Zucca, F. A.; Zecca, L.; Schraermeyer, U. J. Neurochem.
2016, 138, 339–353 (ref 71). Copyright 2016 Wiley. XFM and XAS: from James, S. A.; Roberts, B. R.; Hare, D. J.; de Jonge, M. D.; Birchall, I. E.; Jenkins, N. L.; Cherny, R. A.; Bush, A. I.; McColl, G. Chem. Sci.
2015, 6, 2952–2962 (ref 195) with the permission of The Royal Chemical Society. EFTEM: from Treiber, C. D.; Salzer, M. C.; Riegler, J.; Edelman, N.; Sugar, C.; Breuss, M.; Pichler, P.; Cadiou, H.; Saunders, M.; Lythgoe, M.; Shaw, J.; Keays, D. A. Nature
2012, 484, 367–370 (ref 110). Copyright 2016 Nature Publishing Group.
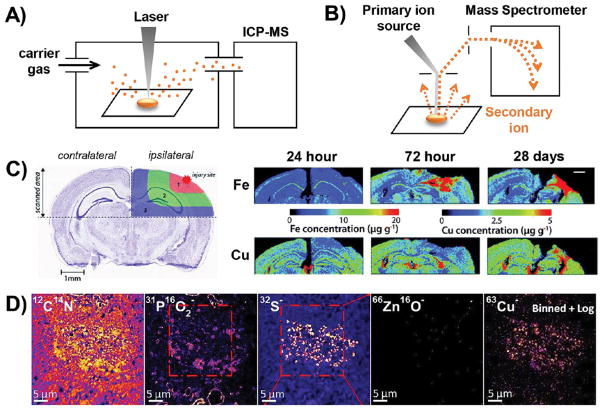
Schematic illustration and representative data for technologies that map metals by measuring atomic mass. (A) Schematic illustration of LA-ICPMS. (B) Schematic illustration of NanoSIMS. (C) LA-ICPMS was used in a longitudinal study of mouse brain slices. Using the healthy contralateral hemisphere as a control, changes in the metal content of the injured ipsilateral hemisphere were observed at multiple time points during the wound-healing process. Reproduced from Portbury, S. D.; Hare, D. J.; Sgambelloni, C.; Finkelstein, D. I.; Adlard, P. A. Metallomics
2016, 8, 193–200 (ref 61) with the permission of The Royal Chemical Society. (C) Representative data highlighting the use of NanoSIMS for colocalizing metal and nonmetal signals at subcellular resolution. PO2− marks lipid bodies, while S− marks neuromelanin. Copper localizes in a pattern that is most similar to S–, indicating that Cu associates with neuromelanin rather than lipid bodies within neurons. Reproduced from Biesemeier, A.; Eibl, O.; Eswara, S.; Audinot, J.-N.; Wirtz, T.; Pezzoli, G.; Zucca, F. A.; Zecca, L.; Schraermeyer, U. J. Neurochem.
2016, 138, 339–353 (ref 71). Copyright 2016 Wiley.
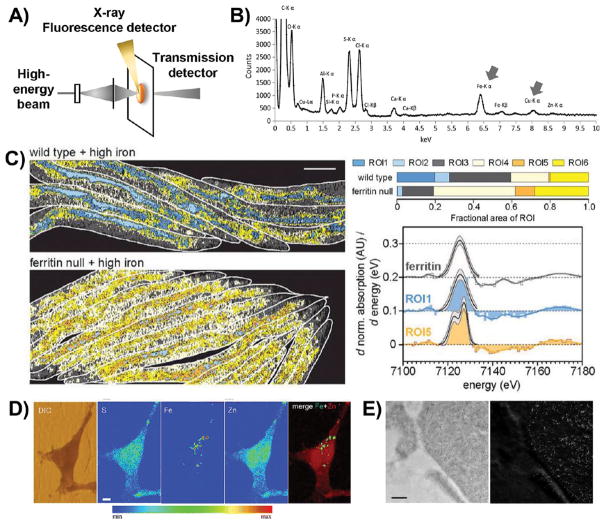
Schematic illustration and representative data for technologies that map metals by probing electronic structure. (A) Schematic illustration of the basic setup for technologies that probe the electronic structure of metals. The high-energy beam is composed of X-rays for XFM and XAS; a particle beam is used for μ-PIXE; and an electron beam is used for EDX, STEM-EELS, and EFTEM. (B) An X-ray emission spectrum illustrating the location of the Fe and Cu Kα-lines, which are well-defined, lying outside the crowded low-energy region. Reproduced from Biesemeier, A.; Eibl, O.; Eswara, S.; Audinot, J.-N.; Wirtz, T.; Pezzoli, G.; Zucca, F. A.; Zecca, L.; Schraermeyer, U. J. Neurochem.
2016, 138, 339–353 (ref 71). Copyright 2016 Wiley. (C) φ-XANES maps of wildtype worms and worms lacking the iron storage protein ferritin; computationally defined ROIs are color coded according to their Fe2+/Fe3+ ratio. Cool colors indicate a low Fe2+/Fe3+ ratio, similar to ferritin (as shown in the spectral comparisons on the right), while warm colors indicate high Fe2+/Fe3+ ratios. Warmer pixels are more prevalent in worms lacking ferritin (percentages are illustrated in the ROI bar graphs on the right). Reproduced from James, S. A.; Hare, D. J.; Jenkins, N. L.; de Jonge, M. D.; Bush, A. I.; McColl, G. Sci. Rep.
2016, 6, 20350 (ref 76). Copyright 2016 Nature Publishing Group. (D) XFM images of iron-treated PC12 rat neural tumor cells overexpressing alpha-synuclein. While sulfur and zinc are relatively homogeneously distributed throughout the cell, iron is confined to subcellular puncta. DIC, differential interference contrast. Reproduced from Ortega, R.; Carmona, A.; Rodeau, S.; Perrin, L.; Dučić, T.; Carboni, E.; Bohic, S.; Cloetens, P.; Lingor, P. Mol. Neurobiol.
2016, 53, 1925–1934 (ref 89). Copyright 2016 Springer. (E) TEM (left) and EFTEM (right) images of ferritin molecules in macrophages. The dark spots in the TEM image correlate well with the high signal in the EFTEM Fe image, confirming a high iron concentration in these electron-dense puncta. Reproduced from Treiber, C. D.; Salzer, M. C.; Riegler, J.; Edelman, N.; Sugar, C.; Breuss, M.; Pichler, P.; Cadiou, H.; Saunders, M.; Lythgoe, M.; Shaw, J.; Keays, D. A. Nature
2012, 484, 367–370 (ref 110). Copyright 2016 Nature Publishing Group.
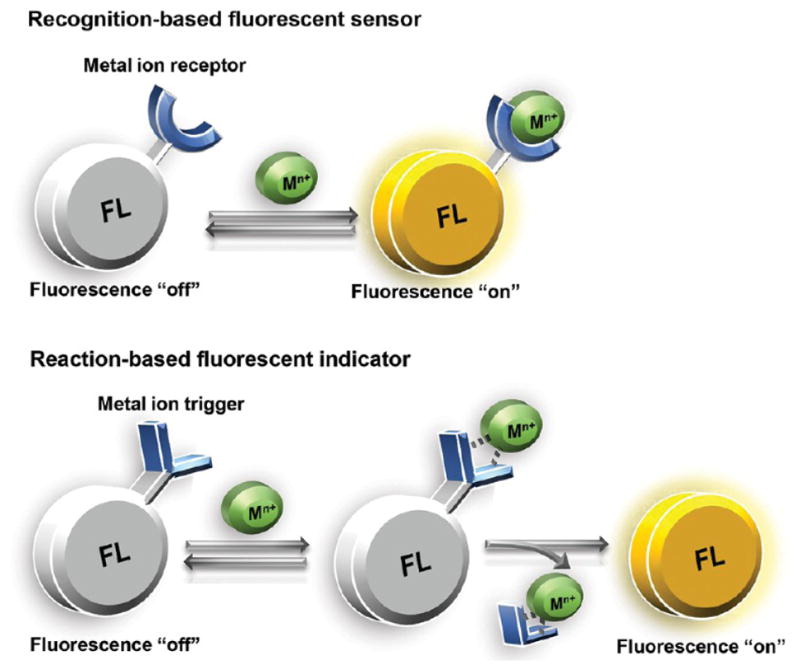
Illustration of recognition-based and reaction-based fluorescent sensors for metal ions. (A) Recognition-based turn-on sensors fluoresce when the metal is bound; they are reversible, turning off when the metal is released. (B) Reaction-based indicators fluoresce after a metal-catalyzed, irreversible chemical event. The fluorophore does not remain associated with the metal after the reaction takes place.
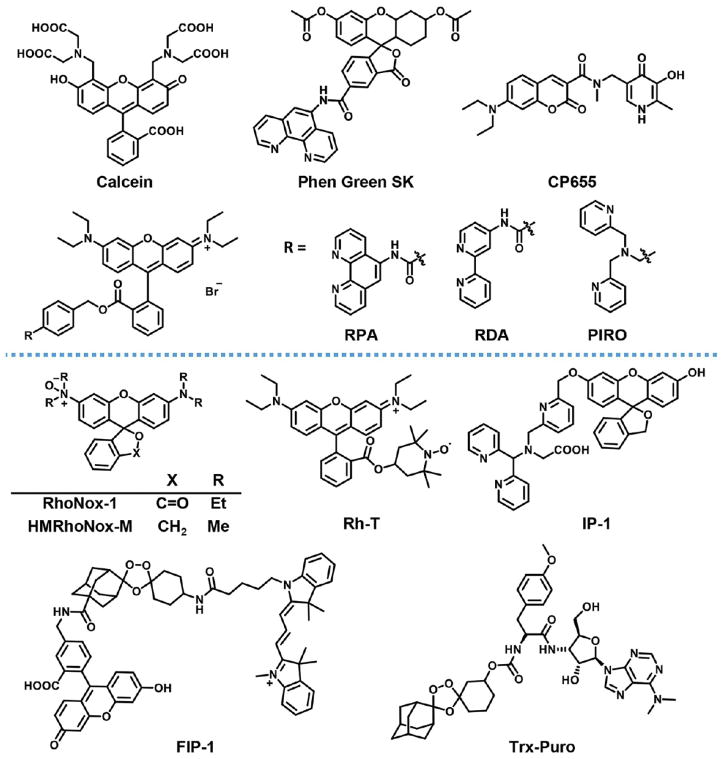
Structures of recognition-based (upper section) and reaction-based (lower section) Fe2+ probes.
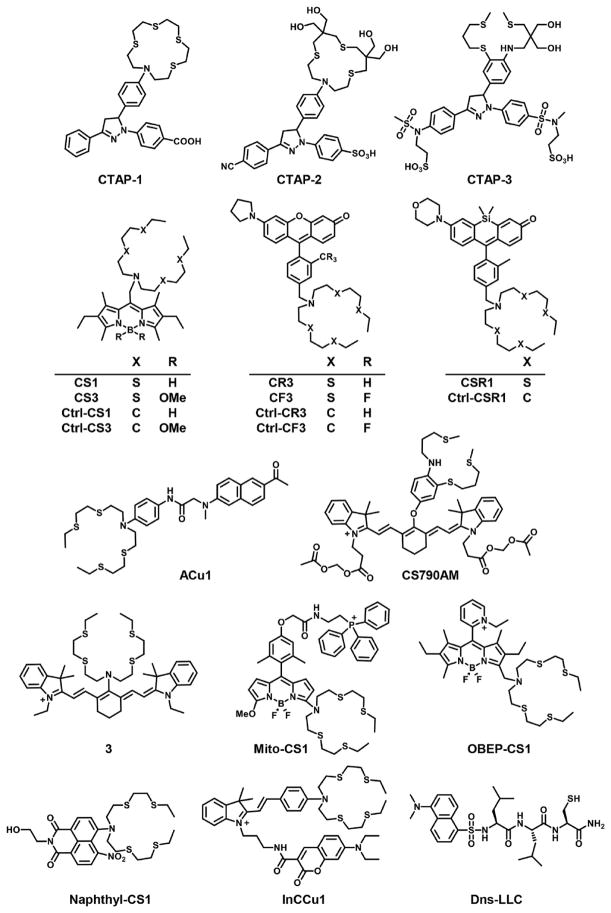
Structures of recognition-based Cu+ sensors.
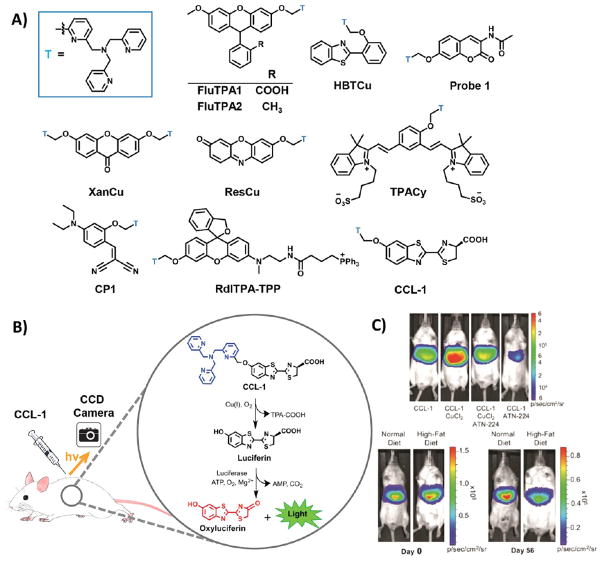
Structures and representative data from reaction-based indicators for Cu+. (A) All reaction-based triggers for Cu+ are based on the TPA trigger (designated “T”, in blue). This trigger has been appended to many small molecule reporters, including fluorescein (FluTPA1), Tokyo Green (FluTPA2), cyanine-quinone (TPACy), an imino-coumarin precursor (CP1), benzothiazole (HBTCu), coumarin (Probe 1), xanthone (XanCu), resorufin (ResCu), rhodol with a mitochondrial tag (RdlTPA-TPP), and, most recently, luciferin (CCL-1). (B) The use and mechanism-of-action of CCL-1 for imaging Cu+ in live animals is illustrated. (C) In mice expressing liver-specific luciferase, CCL-1 signal is observed only in the liver and is dependent on copper levels (top panel); its signal increases in response to copper supplementation with copper chloride and decreases in response to copper chelation with ATN-224, a derivative of tetrathiomolybdate. (C, Bottom panel) After 8 weeks of a high-fat diet, mice have lower CCL-1 liver signal than mice fed a control diet for 8 weeks, even though both groups of mice began the study with the same CCL-1 liver signal. Reproduced from Heffern, M. C.; Park, H. M.; Au-Yeung, H. Y.; Van de Bittner, G. C.; Ackerman, C. M.; Stahl, A.; Chang, C. J. Proc. Natl. Acad. Sci. U.S.A.
2016, in press, DOI: 10.1073/pnas.1613628113 (ref 192). Copyright 2016 Academy of Sciences.
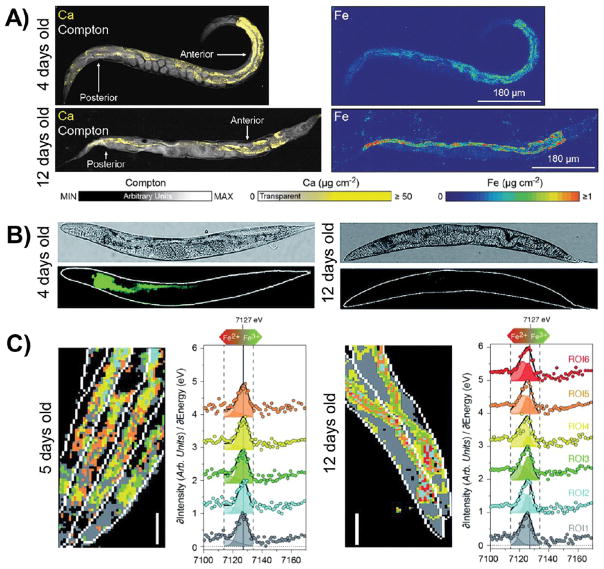
Iron accumulates, and the Fe2+/Fe3+ ratio increases, in aging worms. (A) XFM images reveal total iron accumulation, but no change in calcium levels, in old worms compared to young worms. Compton scattering provides anatomical structure. (B) Calcein staining is lower in older worms, indicating an increase in labile iron with aging. (C) XANES imaging shows a shift to higher Fe2+/Fe3+ ratios in older worms, as observed by a shift in the Fe K-edge to lower energies. Reproduced from James, S. A.; Roberts, B. R.; Hare, D. J.; de Jonge, M. D.; Birchall, I. E.; Jenkins, N. L.; Cherny, R. A.; Bush, A. I.; McColl, G. Chem. Sci.
2015, 6, 2952–2962 (ref 195) with the permission of The Royal Chemical Society.
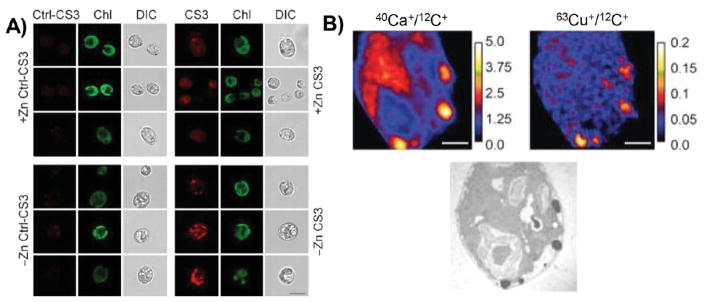
The localization of copper changes on the time scale of hours, in order to respond to changes in nutrient availability. (A) In the model organism C. reinhardtii, the copper sensor CS3 reveals the accumulation of copper in subcellular structures, termed cuprosomes, under conditions of zinc starvation (– Zn) compared to control (+ Zn). Cuprosomes were not observed by the control sensor Ctl-CS3. Chl, chlorophyll autofluorescence; DIC, differential interference contrast. (B) By NanoSIMS, calcium and copper are observed within electron-dense structures along the cell periphery. NanoSIMS scale bars are metal counts normalized to carbon counts. Reproduced from Hong-Hermesdorf, A. M.; Miethke, M.; Gallaher, S. D.; Kropat, J.; Dodani, S. C.; Chan, J.; Barupala, D.; Domaille, D. W.; Shirasaki, D. I.; Loo, J. A.; Weber, P. K.; Pett-Ridge, J.; Stemmler, T. L.; Chang, C. J.; Merchant, S. S. Nat. Chem. Biol.
2014, 10, 1034–1042 (ref 70). Copyright 2016 Nature Publishing Group.
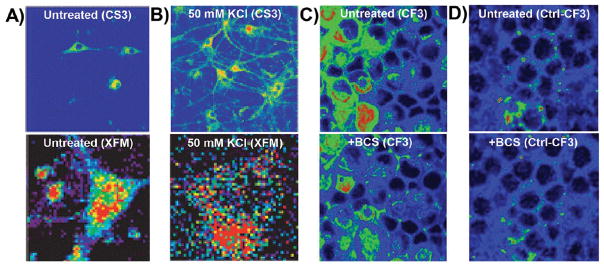
Metals undergo dramatic relocalization on short time scales. The copper sensor CS3 was used to visualize the movement of copper in primary hippocampal neurons from (A, upper panel) cell bodies in resting neurons to (B, upper panel) dendritic spines upon neuronal depolarization with potassium chloride. (A, lower panel; B, lower panel) These results were confirmed by XFM. Reproduced from Dodani, S. C.; Domaille, D. W.; Nam, C. I.; Miller, E. W.; Finney, L. A.; Vogt, S.; Chang, C. J. Proc. Natl. Acad. Sci. U.S.A.
2011, 29, 686–700 (ref 160). Copyright 2016 National Academy of Sciences. (C, upper panel) The copper sensor CF3 revealed a loosely bound copper pool in retinal neurons, which could be rapidly depleted (C, lower panel) upon incubation with an extracellular copper chelator. (D, upper panel) The signal from the matched control probe, Ctl-CF3, was not altered (D, lower panel) by chelator treatment. Reproduced from Dodani, S. C.; Firl, A.; Chan, J.; Nam, C. I.; Aron, A. T.; Onak, C. S.; Ramos-Torres, K. M.; Paek, J.; Webster, C. M.; Feller, M. B.; Chang, C. J. Proc. Natl. Acad. Sci. U.S.A.
2014, 111, 16280–16285 (ref 164). Copyright 2016 National Academy of Sciences. All color schemes scale from cool colors (low signal) to warm colors (high signal) with arbitrary units of fluorescence counts.
References
Publication types
MeSH terms
Substances
Grants and funding
LinkOut - more resources
Full Text Sources
Other Literature Sources
